Kanban
A Knowledge-centric Perspective
Related Articles
Abstract
Kanban is a method for defining, managing, and improving services that deliver knowledge work such as software development. It promotes a "start from what you do now" approach, acting as a catalyst for rapid and focused organizational change. A hallmark of Kanban is the use of a kanban board to visualize work, partitioned into columns that represent workflow. Kanban encourages viewing the board as a knowledge discovery process, with each column denotes different knowledge discovery activity that a work item passes through.
However, the typical Kanban practice advices on limiting work in progress (WIP) by the number of cards, which controls the flow of tangible work items rather than the flow of intangible knowledge. In knowledge work we need to limit the missing knowledge a team needs to discover. We adopt the Knowledge-centric perspective and limit not the number of cards, but the amount of missing knowledge.
The Knowledge-centric perspective does not contradict the principles of Kanban. Instead, it substantiates the claim that a Kanban board maps a knowledge discovery process.
Here’s how you can apply a Knowledge-centric perspective to your Kanban practices starting next Monday:
-
Refine Your Kanban Board:
Begin by viewing your Kanban board as a map of your knowledge discovery process.
The board not only segments work into stages but also acts as a navigational tool that guides through the steps of gaining new knowledge.
The differentiation between the discovery and delivery parts of the Kanban board
highlights the management of work items from initial exploration to the commitment of delivery,
emphasizing the critical role of experiments and the pull system in managing work in progress effectively.
This helps you and your team visualize where knowledge is discovered and where bottlenecks might occur.
In our Knowledge-centric approach, WIP limits are set at the top of each column, but the numbers reflect the minimum bits of missing information that need to be present in a column at any time.
It's essential not to think of the Kanban board as segregating 'discovery' and 'delivery' into distinct phases. Rather, discovery and delivery are concurrent processes; we are always discovering as we deliver, and vice versa, ensuring a continuous flow of knowledge and tangible work.
- Categorize Work with a Complexity Profile Matrix: Use a Complexity Profile (CP) matrix to categorize work items based on the missing knowledge they require to be disoevered. This classification will guide you in prioritizing tasks and managing workflows more effectively.
- Implement the Knowledge Discovery Funnel: Integrate the Knowledge Discovery Funnel into your daily routines. This tool acts as a dynamic guide for filling in gaps in understanding and ensuring that every task is aligned with the team’s skills and project goals.
- Use the Pull System: Emphasize experimenting with new ideas and solutions within the discovery stages of your board. Utilize the pull system to manage work in progress by ensuring tasks are only moved forward when they are truly ready and the necessary knowledge to do so has been acquired.
- Merge Knowledge-Centric and Flow Metrics: Finally, integratte the Knowledge-Centric Metrics with traditional Flow Metrics to provide a holistic view of the process. While Flow Metrics quantify tangible logistics, Knowledge-Centric Metrics address the intangible aspects, offering insights into the knowledge gaps, cognitive load, and overall efficiency of the knowledge discovery process. Together, these metrics provide a comprehensive framework for understanding and improving practices, bridging the gap between tangible logistics and the intangible aspects of knowledge work.
- Track Learning Curves: Monitor the cumulative growth of knowledge within your team using learning curves. This approach to measuring and analyzing the rates of knowledge discovery provides valuable insights into project complexity, team adaptability, and the overall project lifecycle, thereby enabling more informed decision-making regarding resource allocation, training, and process adjustments.
- Adopt Probabilistic Forecasting: Replace traditional project forecasting methods with a probabilistic approach using Reference Class Forecasting (RCF). This uses historical data about rates of knowledge discovery from similar projects to better manage the uncertainties of project timelines, considering both past outcomes and current learning rates.
By integrating these practices, your team can start improving your workflows right away. This practical, knowledge-centered approach to Kanban will help you manage complexity more effectively and make more informed decisions about your projects and resources. This isn't just theory—it's a set of actionable steps that can transform the way your team works.
Overview of Kanban principles and practices
Kanban is a method for defining, managing and improving services that deliver knowledge work. It can be characterized as a "start with what you do now" method, a catalyst for rapid and focused change within organizations[1].
The Kanban method is designed for managing knowledge work that culminates in products and services
Kanban's principles are twofold: Change Management Principles and Service Delivery Principles. The Change Management Principles are:
- Start with what you do now
- Agree to pursue improvement through evolutionary change
- Encourage acts of leadership at all levels
The Service-oriented Principles are:
- Understand and focus on customer needs and expectations
- Manage the work; let people self-organize around it
- Regularly review the network of services and its policies in order to improve outcomes
The general practices of Kanban are:
- Visualize: Effective visualization is key to collaboration and identifying areas of improvement.
- Limit Work in Progress (WIP): Manage the number of work items in progress at a given time.
- Manage Flow: Aim for smooth and predictable work completion at a sustainable pace.
- Make Policies Explicit: Detail policies visibly and understandably, ensuring they are consistently applied and easily adjustable.
- Implement Feedback Loops: Establishing context-appropriate feedback loops strengthens the organization's learning capabilities and fosters its evolution through managed experiments.
- Improve Collaboratively, Evolve Experimentally: Use models and the scientific method to design experiments.
Kanban teaches that it is a mistake if thinking that product development workflow is like a manufacturing process or a series of handoffs. A workflow maps the discovery of information (or knowledge) based on the performing of some activity that produces that information. When the activity reaches a point of diminishing returns and a new activity might produce more information then the dominant activity switches. A Kanban board maps these activities, the work could remain with a single person, small group of collaborators and it would still flow.
Remember, Kanban is more than just a board. It is about improving processes by making data-driven decisions based on system feedback. For example, recurrent bottlenecks in a workflow section signal an impediment requiring attention. The visualization of work on a Kanban board allows teams to see the flow of work in real-time, making it easier to identify patterns, bottlenecks, and opportunities for improvement. This visibility is key to understanding the complex dynamics of knowledge work and to making informed decisions about how to optimize the workflow.
Kanban is not a process, or a recipe, or a framework. It's how to see work[3]. Specifically the Kanban Lens allows us to see:
- work as flow
- workflow as a Knowledge Discovery Process i.e. as a sequence of knowledge discovery steps
- knowledge work as a service
- organizations as networks of services
Through the Kanban Lens, we discern the true nature of software development as a progression from some knowledge about an idea to full comprehension of a finished product ready for delivery. Essentially, software development is a process of knowledge acquisition and ignorance reduction[8]. It's a journey to identify and close knowledge gaps, reduce our uncertainty, and increase our knowledge iteratively. This way, we model the software development process as a knowledge discovery process.
The process of knowledge discovery starts with identifying the knowledge to be discovered, which can be thought of as the question "what do we need to know?" This represents the gaps in understanding or information that an individual or group believes they lack.
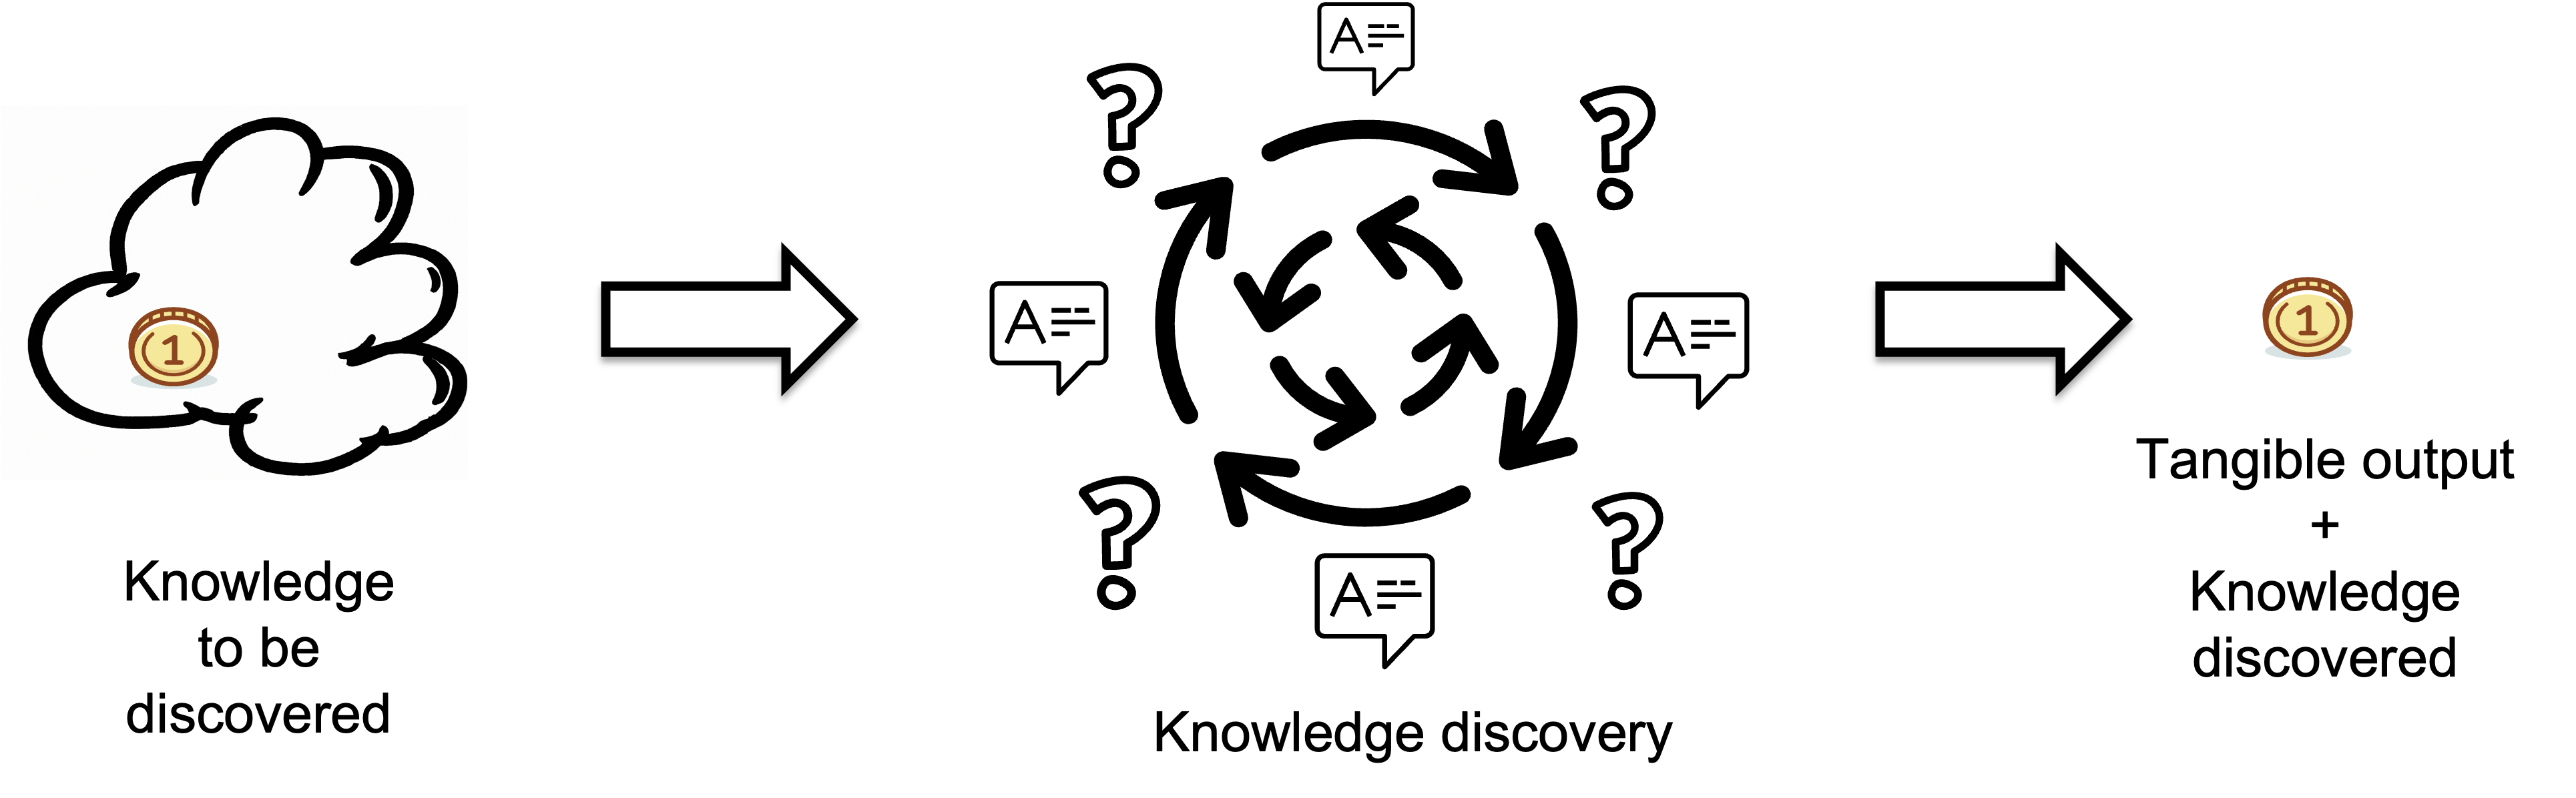
By recognizing what is unknown, i.e., the questions without answers, the knowledge discovery aims to fill in these gaps by finding answers through research, investigation, and other means. We consider the knowledge discovery part as a black box, and we don't know how it produces tangible output in response to input questions. This black box may contain a human or an AI tool, such as ChatGPT.
The tangible output represents the knowledge discovered through the knowledge discovery process, encapsulating the new information that has been acquired. In contrast, the input represents the missing information or knowledge that needs to be discovered. We do not address the question of the quality of the tangible output, assuming that it meets appropriate standards.
Understanding the Nature of Knowledge Work
Knowledge work involves the cognitive effort to close the gap between what is known and what needs to be known in order to effectively complete a task. It becomes necessary when there is an imbalance between required knowledge and prior knowledge.
Understanding this concept is crucial as different professions demand varying proportions of manual and knowledge work. While some jobs embed much of the required knowledge within the tools and procedures used, others necessitate continuous learning and adaptation to bridge the gap between existing skills and the demands of the task. This variability highlights how the same profession, when executed by people with different levels of prior knowledge, can require different proportions of knowledge work.
In software development, distinguishing between 'knowledge' work and 'manual' work is essential. Software developers engage in extensive knowledge acquisition for problem-solving and innovation, thus we may speculate that there is 95% of knowledge work and 5% manual work..
This is exemplified by Margaret Hamilton's contribution to the Apollo 11 program in 1969. In the picture below to the right we have Margaret being awarded the Presidential Medal of Freedom by President Obama.
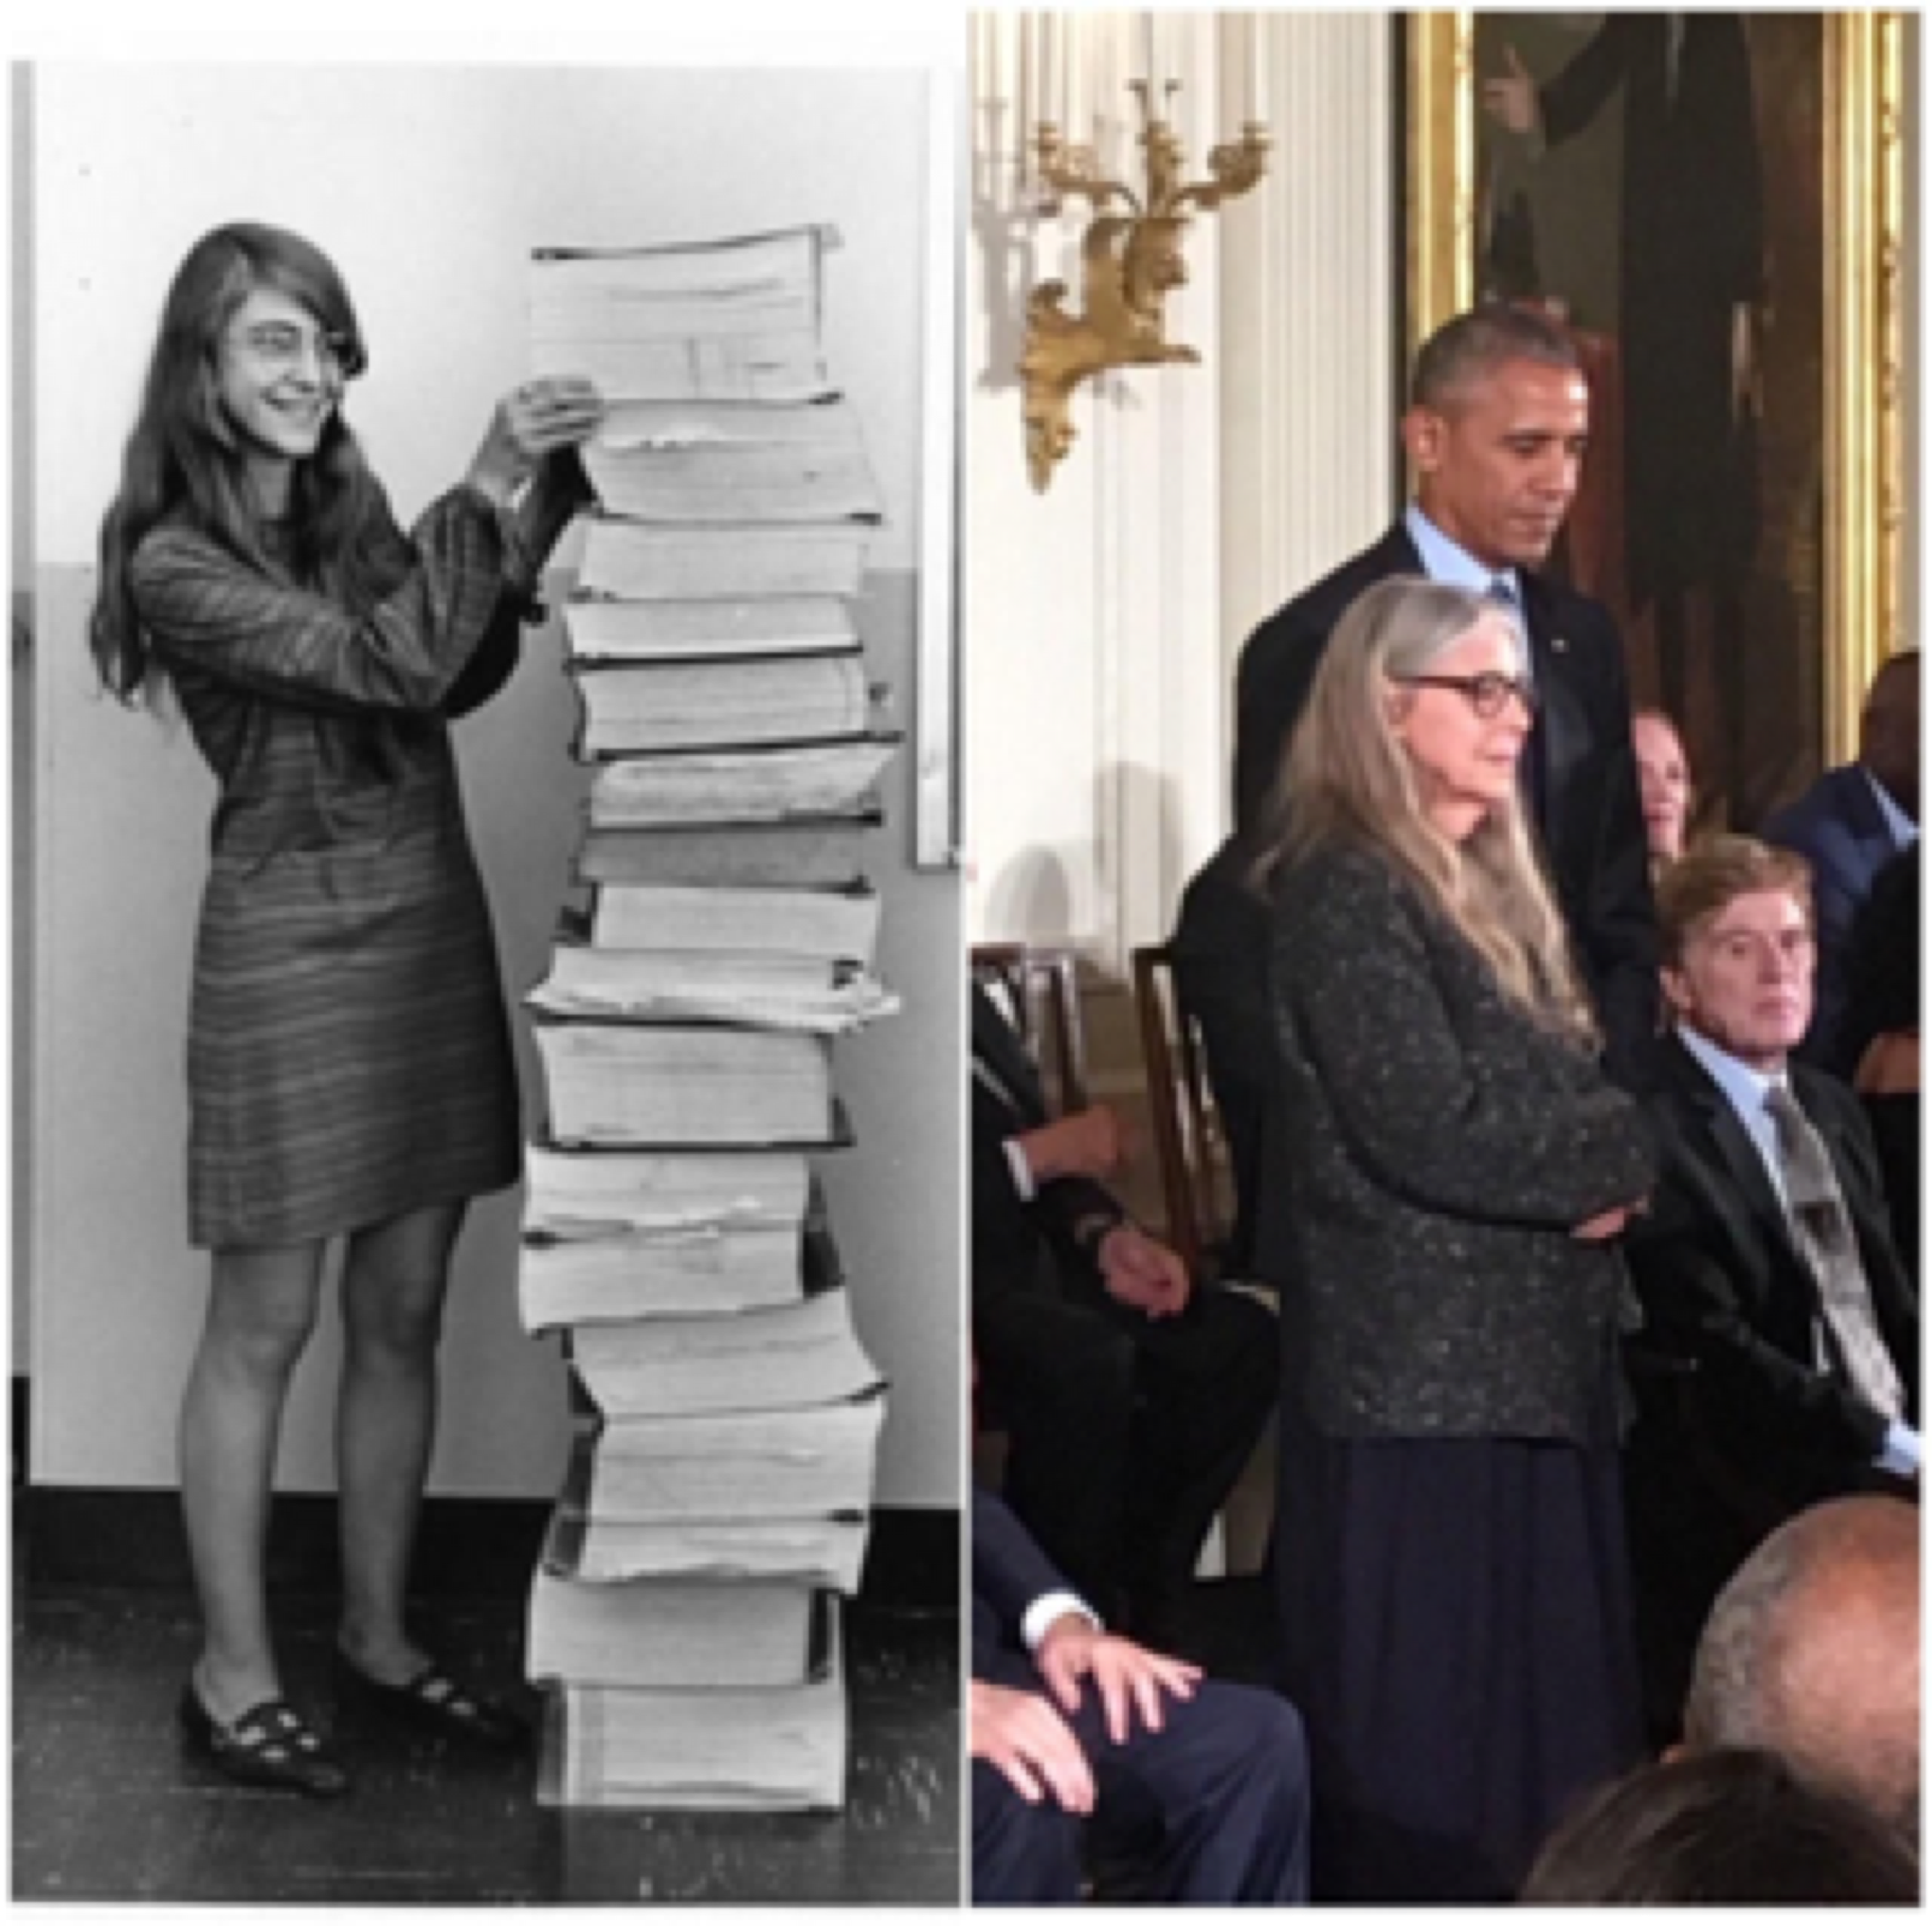
On the picture to the left we have Margaret standing next to part of the computer code she and her team developed for the Moon landing. What we witness is an example of the manual part of the knowledge work. The software developers had to type all of those pages manually. All the knowledge went from their brains, through their fingers and ended up as symbols on sheets of paper. The difficult and time consuming activity in creating Moon landing software was not in typing their already-available knowledge into source code. It was in effectively acquiring knowledge they did not already have i.e. getting answers to the questions they already had. Even more specifically, it was in discovering the knowledge necessary to make the system work that they did not know they were missing. The symbols are the tangible output of their knowledge work. The symbols are not the knowledge itself, but the trace of the knowledge left on the paper.
Quantifying the Knowledge discovered
To calculate the knowledge discovered by a knowledge discovery process, we need to find the missing information in bits.
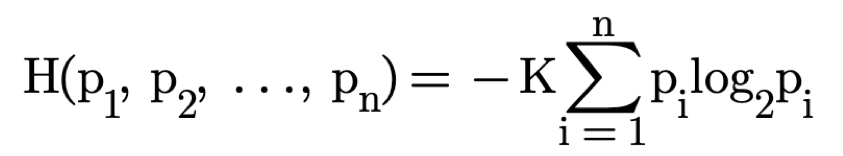
Consider finding a gold coin among 64 boxes using binary ("Yes" or "No") questions, like if the coin is in the specified half of the boxes.
The missing information H equals the average number of questions needed to locate the coin, typically 6 for this example.
Below is an animation of calculating knowledge discovered when we search for the gold coin.
getKanban: A Knowledge-Centric Perspective
In order to understand what knowledge to be discovered is in knowledge work let's consider the most popular Kanban board game.
getKanban Game Overview
getKanban is a popular simulation game, invented by Russell Healy It has since become a standard tool in Kanban training workshops.
The game is designed for teams of four to six players, with one game set per team. Each team is provided with a playing board that simulates a Kanban board and a set of tickets that represent work items to be completed. Tickets are moved through different stages—typically Analysis, Development, and Testing. Each ticket is marked with several white dots divided into three sections: Analysis, Development, and Test. These dots indicate the amount of work needed to complete the task. Teams must clear all the dots in one column to move a ticket to the next.
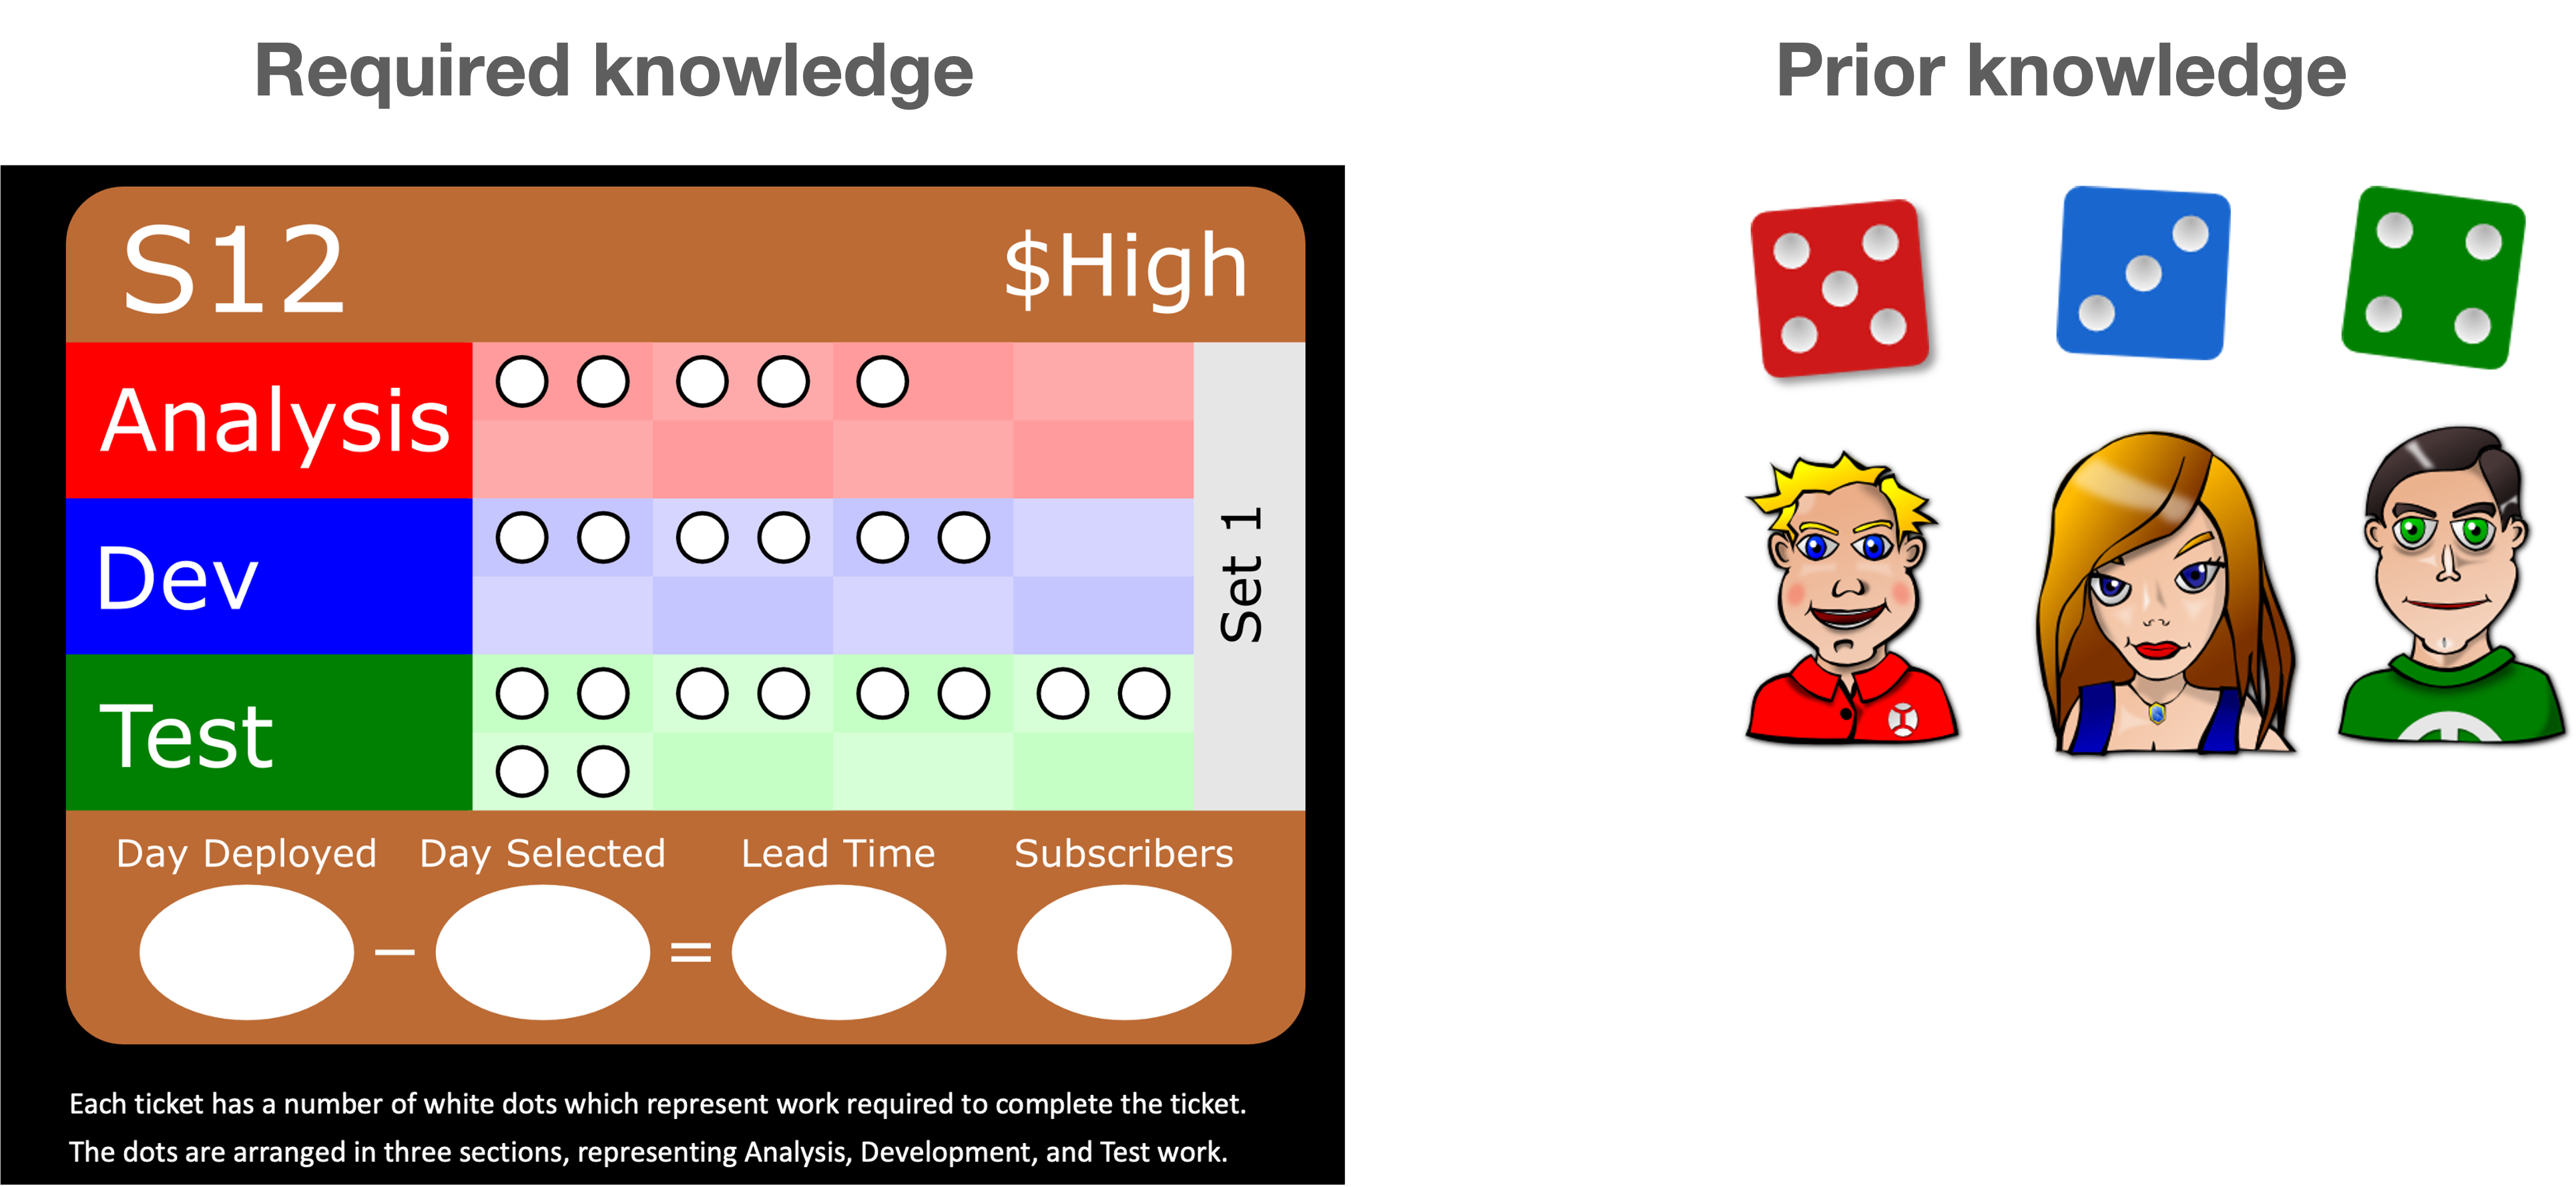
A team has two Analysts, represented by two red dice, three Developers represented by three blue dice, and two Testers represented by two green dice. During gameplay, dice are allocated to tickets to represent work efforts. Dice can be assigned to tasks outside their specific roles. For example, an Analyst might work on a Development task. However, when a die is used for a non-specialized task, its value is halved and rounded up to the nearest whole number. Once all dice are placed, they are rolled to progress the tickets. After being rolled, the dice are considered "spent".
A Knowledge-Centric Interpretation
What does “work needed” mean? Is the work to write the source code? Or the effort to think about and decide what to write? It is not clear what is being "spent" - is that physical, manual effort or something intangible like knowledge?
Here is the Knowledge-Centric Interpretation:
- Each white dot on the game's tickets symbolizes a unit of required knowledge.
- Each section on a ticket represents a type of knowledge. Analysis represents mostly "what to do" knowledge. Development represents "how to implement the what to do" knowledge. Testing represents "what to do" knowledge.
- Each pip (dot) on a die represents a unit of prior knowledge. Sometimes the die will roll 1, other times it will roll 6. That represents the likelihood of a team member possessing the required knowledge for a task. .
- Using a die outside its specific function halves its value, illustrating the challenges when a person's prior knowledge doesn't perfectly align with task requirements. and probability to have the required missing knowledge decreases.
- The difference between the required knowledge and the prior knowledge is the knowledge to be discovered. That simulates a real world situation where people need to discover new knowledge on top of their prior knowledge.
For instance if we say that the ticket S12 is to be worked on and the team has rolled their dice and got:
- 6 pips on 1 read die
- 2 pips on 1 blue die
- 4 pips on one blue die
Manage the Knowledge Discovery Process
"The organization and the people within it need to discover a quantity of knowledge that they do not have, and factor that knowledge into something that works." ~ Phillip Glen Armour[8]
How to manage the knowledge discovery process in practice? For that we will put on the lens of the knowledge-centric perspective on software development to differentiate between knowledge discovery and knowledge application in defining an effective knowledge discovery process. The primary purpose of the knowledge discovery process is to show us where we lack knowledge. Not only to show us what we know and what we don't know as much as to show us what we don't know we don't know. We acknowledge that the true role of the development process is to acquire knowledge, and the most valuable knowledge is knowledge we do not already have[8]. Armed with the new understanding we'll take an end-to-end view on the way we manage software development.
Categorizing work items by knowledge to be discovered.
"In knowledge work the key question is: What is the task?" ~ Peter Drucker [9]
A service is a system composed by the people, who will deliver and the people, who define what to be delivered. We shall call the former group Capability and the latter group Client. Capability is represented by the delivering organization's knowledge, skills and experience. The Client is responsible for defining the task i.e. "what to do". The Capability is responsible for defining "how to do the what".
In Kanban we don't use "task" but "work item". A Work Item is a deliverable or a component thereof resulting from the demand placed at the system that will be worked on by a service. A Workflow is a series of activities that results in products or services being delivered. The workflow or a selected part of it is represented on a Kanban board by a set of sequential columns showing the knowledge discovery activities that the work item passes through. In Kanban, a Work Item Type is a grouping of work items that behave similarly and follow the same workflow. Examples of work item types are information requests, campaigns, incidents, defects, product features, whole products, or projects.
We will categorize work items by the amount of knowledge to be discovered i.e. by the amount of missing information. All work items can be broadly categorized into three types:
- Having Knowledge to be discovered on what to do: This pertains to the overall problem definition of the work item.
- Having Knowledge to be discovered on how to do it: This involves the specific solution or methods required to complete the work item.
- Having Knowledge to be discovered on both what to do and how to do it: This encompasses both the overall problem definition and the specific solution or methods needed to complete the work item.
When a work item is a whole project we will use the process explained in detail here to find the amount of missing information in bits.
It's essential to note that the observed missing information is subjective and conditional. The same work item could have different observed missing information for different observers, depending on their prior knowledge, understanding, and perspective.
Prior knowledge significantly influences the knowledge to be discovered, as it provides a foundation upon which new information is built. Additionally, prior knowledge of different domains can jointly support the recall of arguments[5].
It is more convenient to represent the three types of knowledge to be discovered in order to deliver a work item in a matrix, which we will refer to as Complexity Profile (CP) as presented on the figure below.
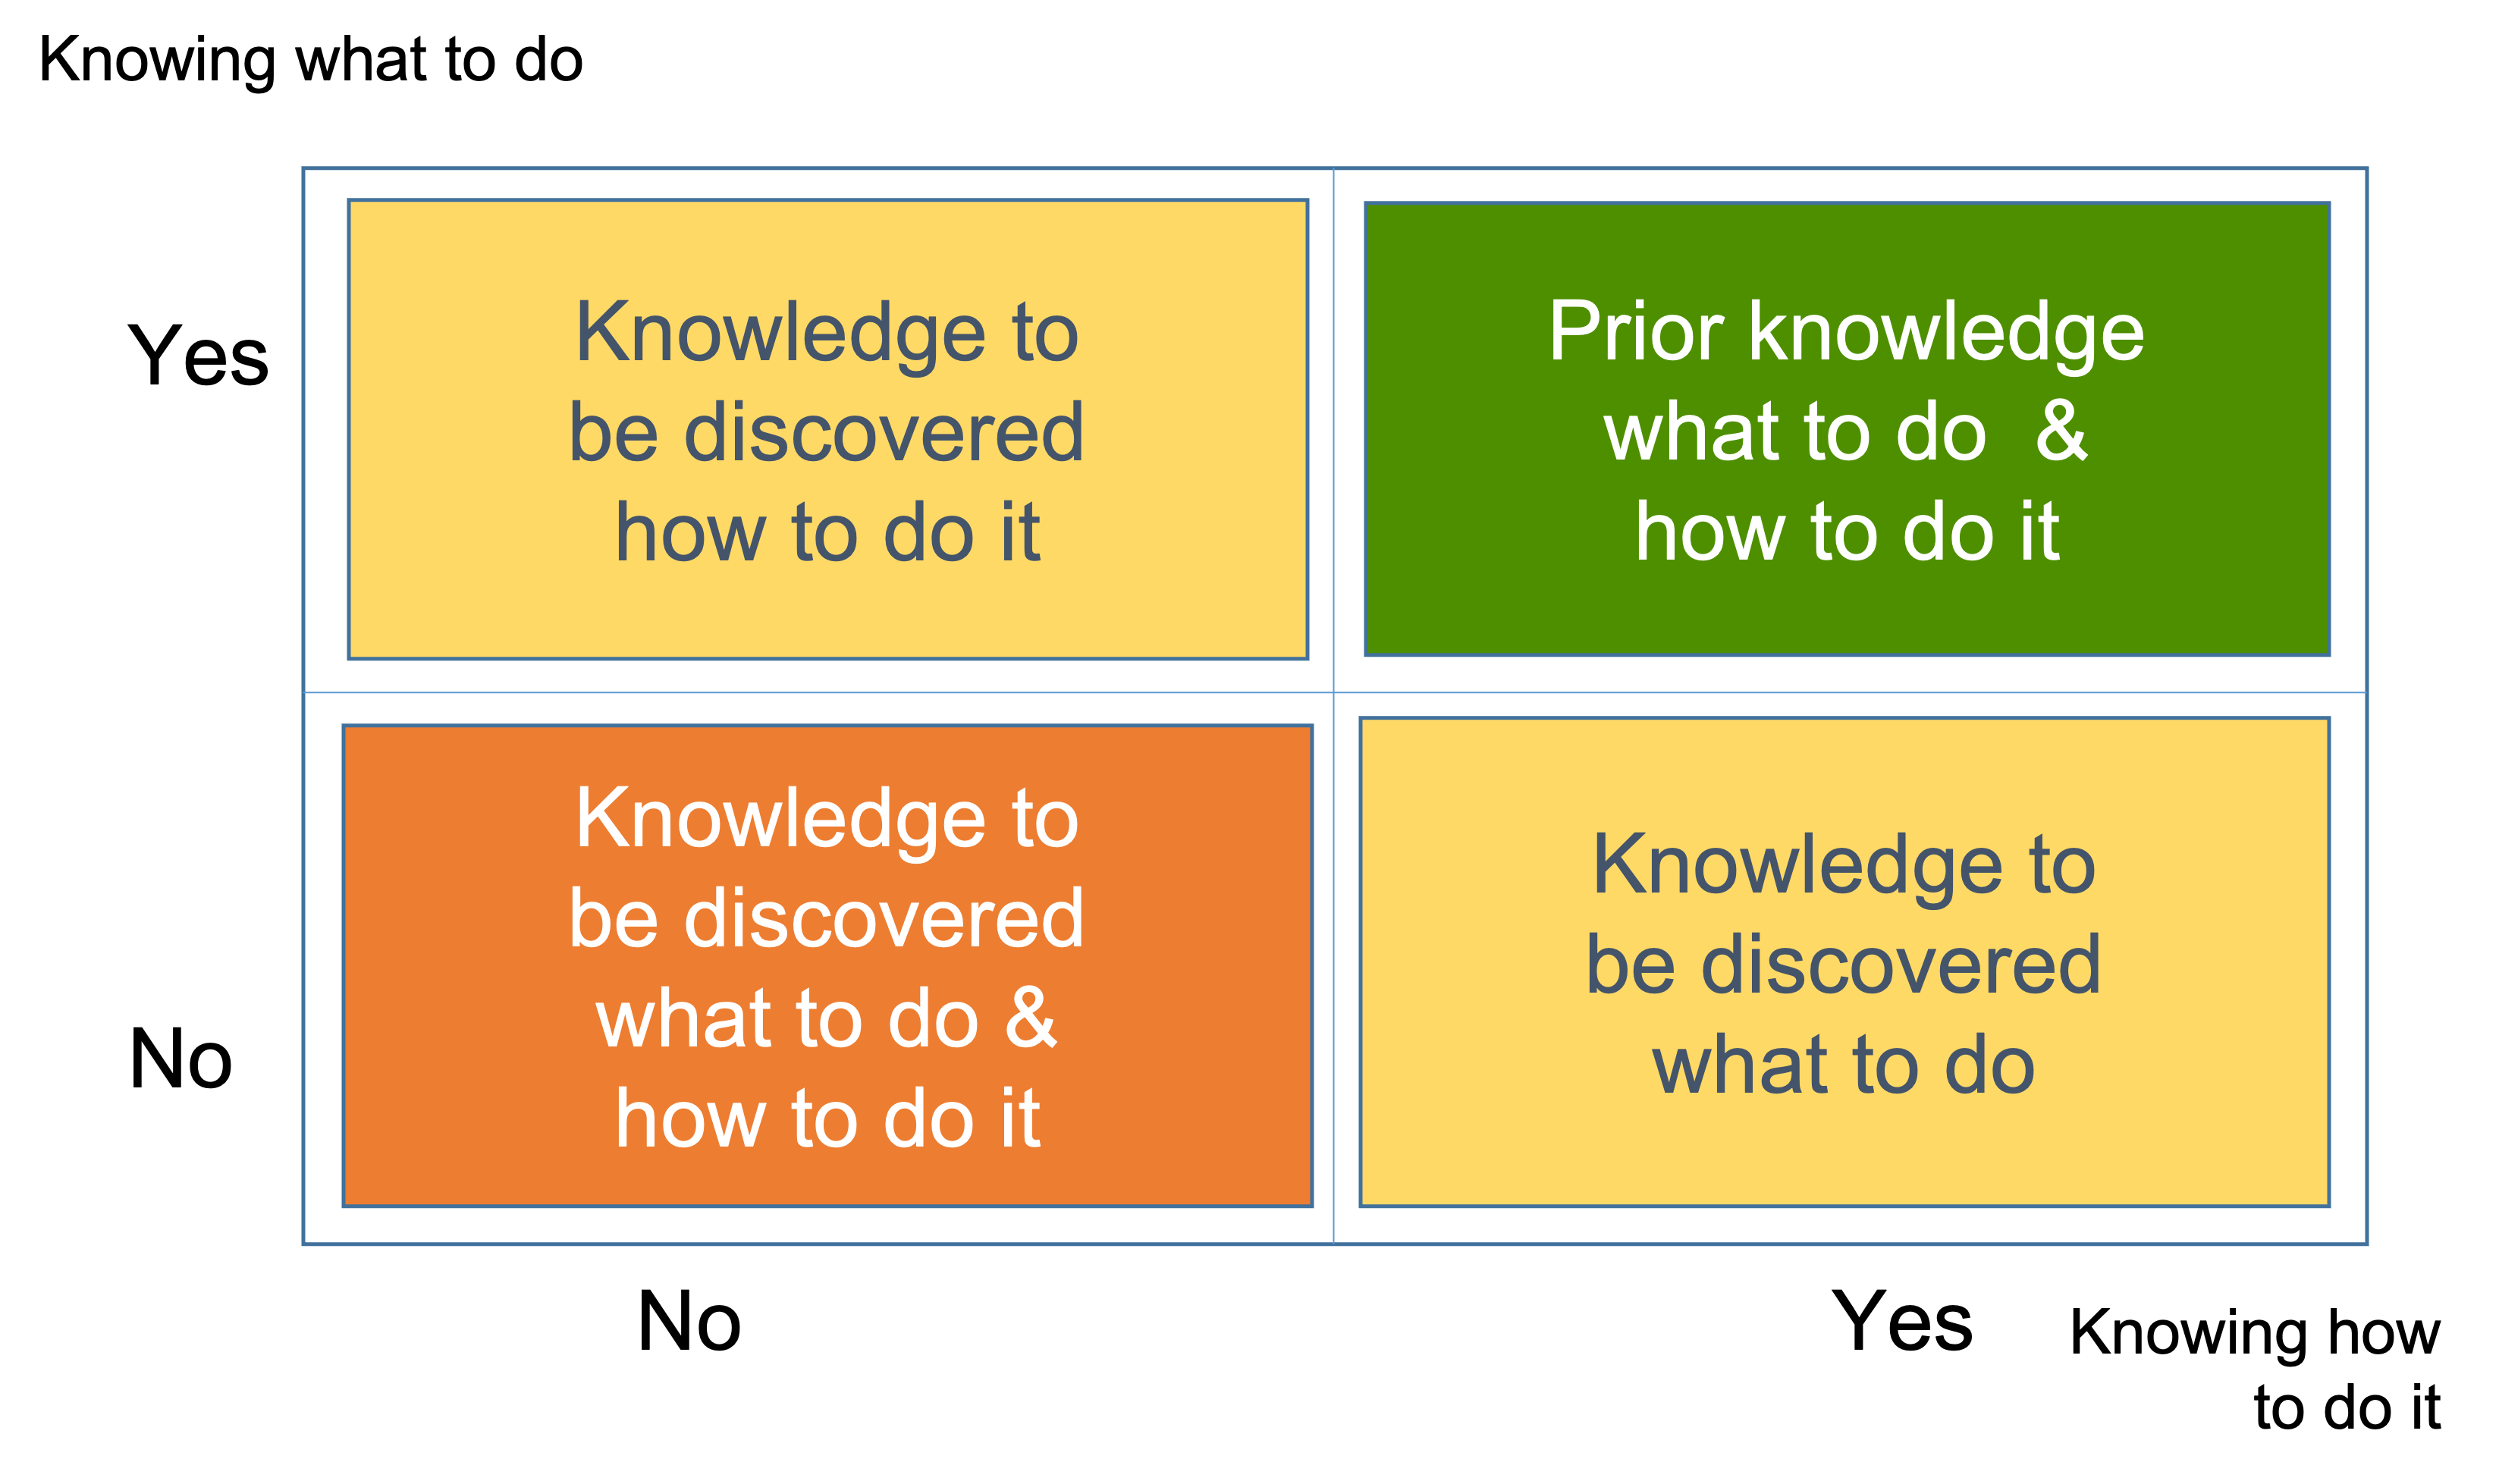
The vertical axis in the matrix represents whether the team has a clear and distinct understanding of the work item, that is, whether they know what to do. The horizontal axis represents whether the team knows how to complete the work item. Here knowing is represented as a binary variable, where the team either knows or does not know.
The green quadrant represents a state where the team has a complete understanding of both the problem definition and the solution, and according to our definition of knowledge this means that no new questions need to be asked. No alternatives, only one clear problem-solution combination to deliver the work item.
The orange and amber quadrants represent states where multiple alternative combinations of problem definition and solution exist.
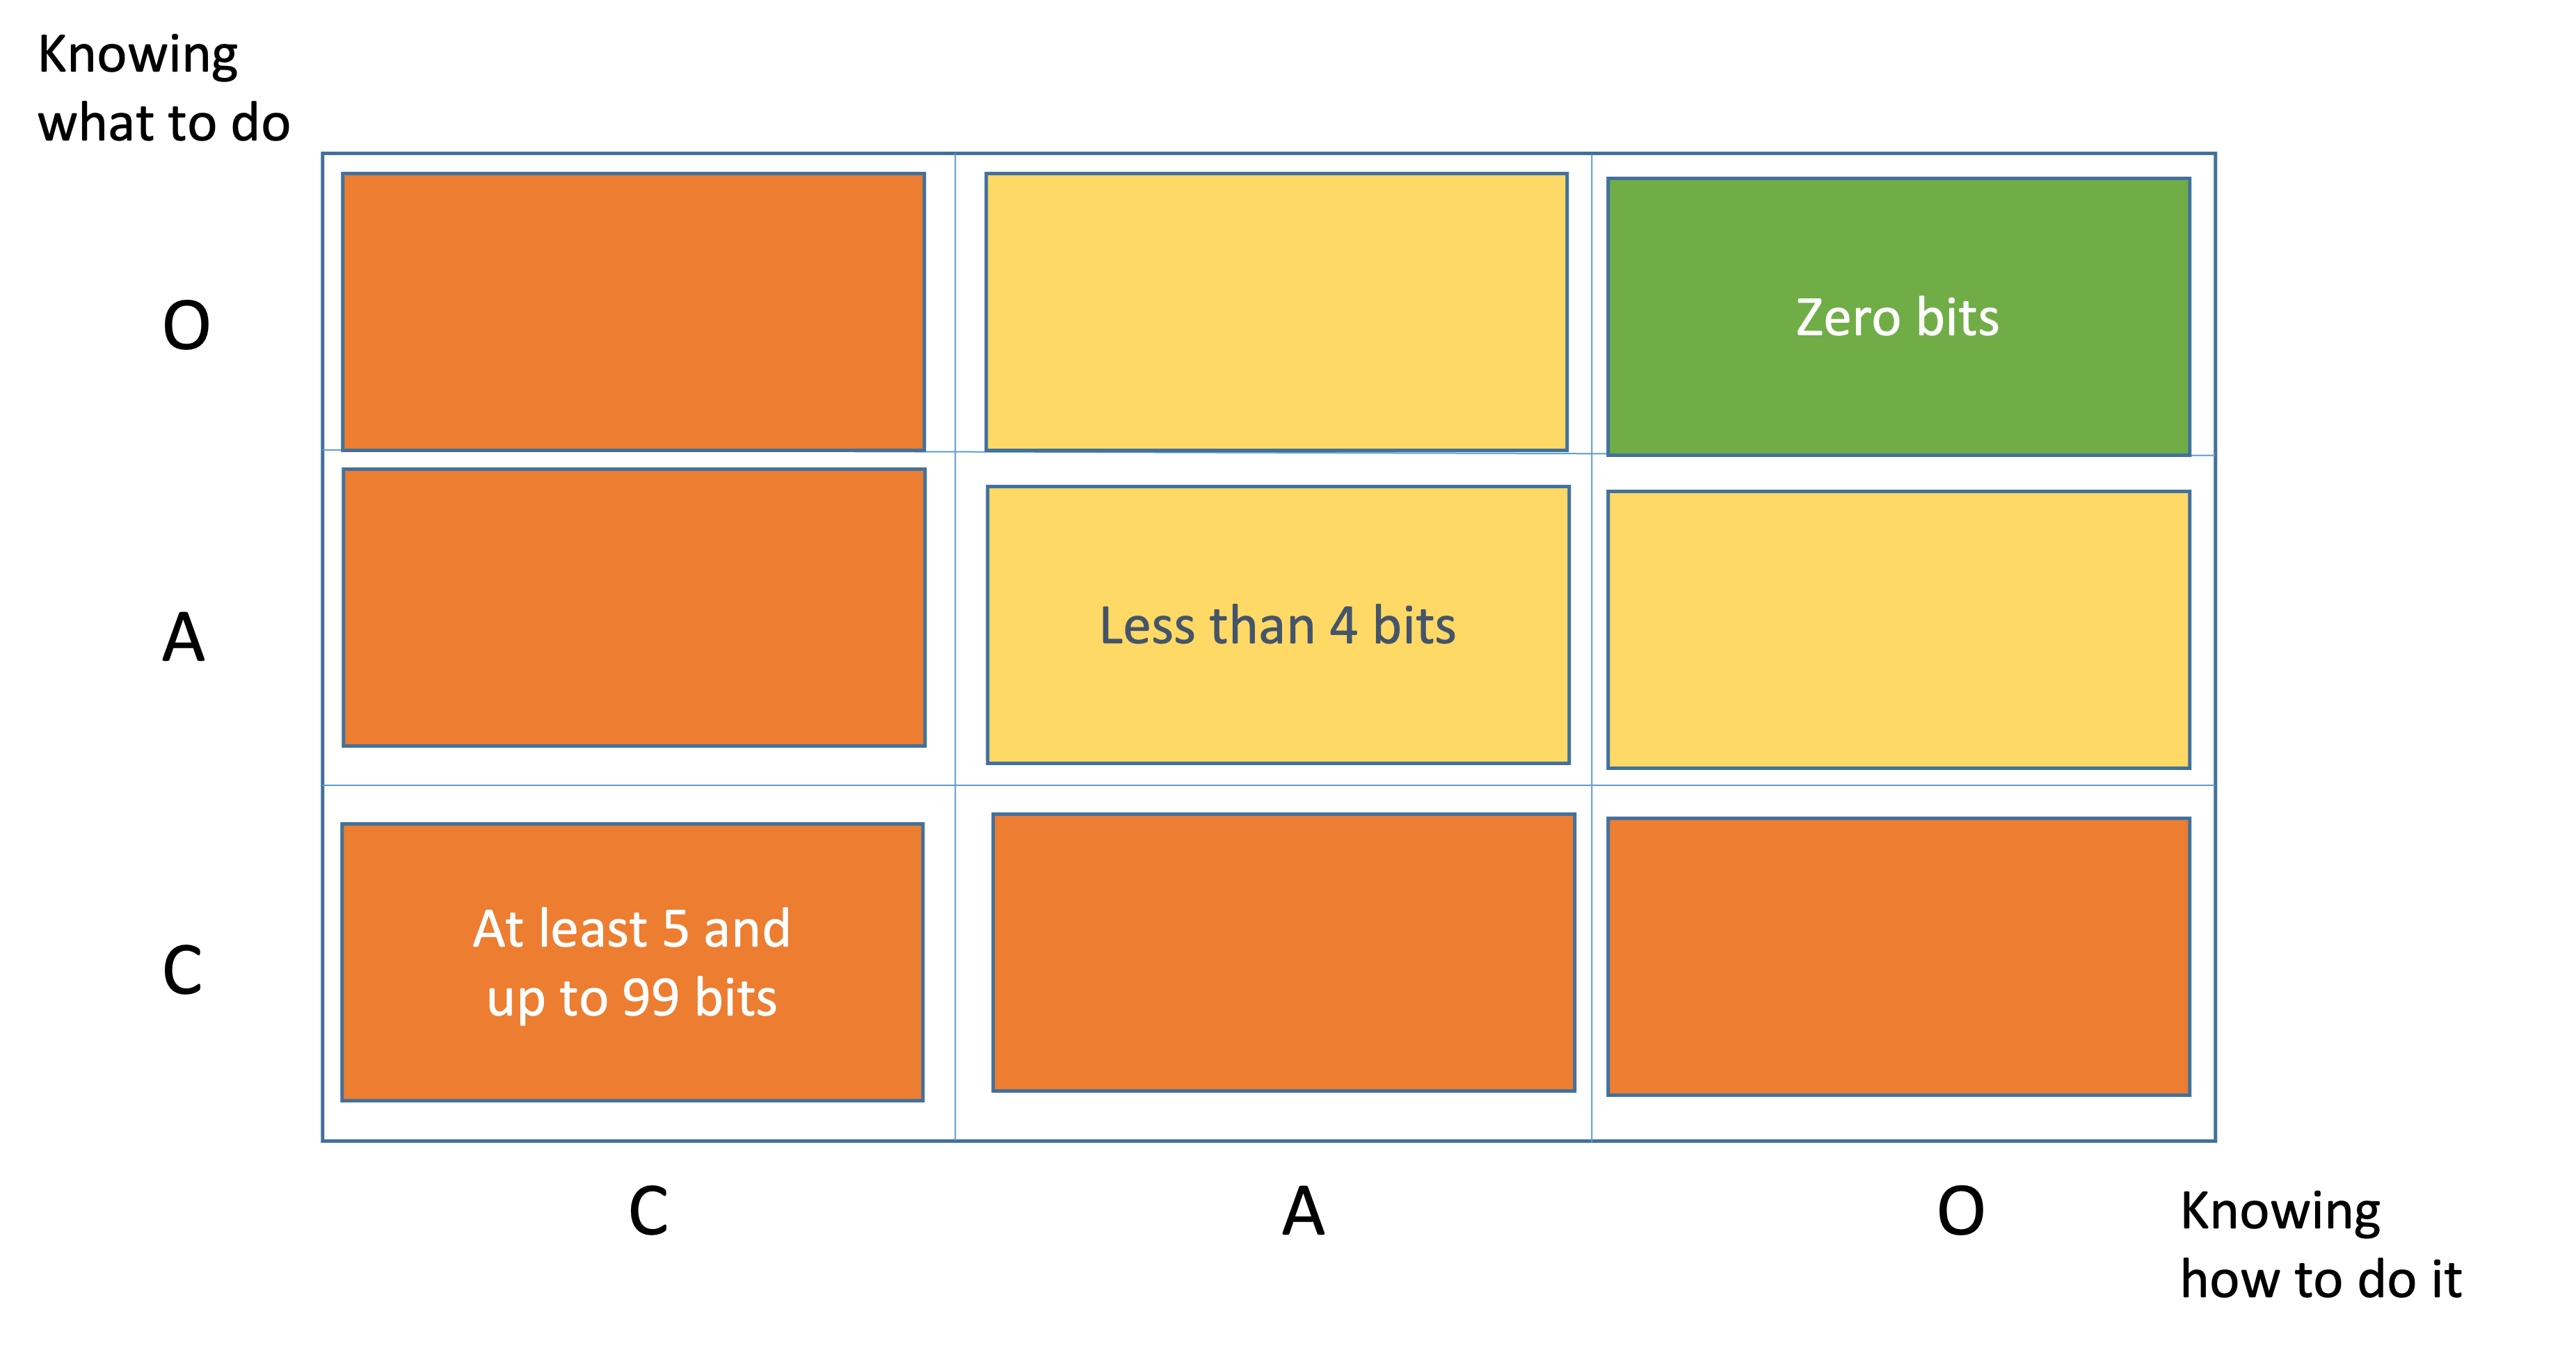
We subdivide each of the two dimensions into three ranges of the amount of knowledge to be discovered in bits of information:
- Clear. There are no alternatives. It requires zero questions to be asked. There are zero bits of missing information.
- Complicated. There are up to 16 alternatives and it requires at least 1 and up to 4 questions asked in a row, in sequence, linearly. There are between 1 and 4 bits of missing information.
- Complex. We have just a vague idea about what we don't know i.e. there are unknown unknowns. They'll have to explore many alternatives before picking one. It requires: at least 5 and up to 99 questions asked, but not in a row, not in sequence and non-linearly. That is, there are between 5 and 99 bits of missing information.
Below is the same presented in a table format:
| Domain | Questions (bits) | Alternatives |
|---|---|---|
| Clear | 0 | 1 |
| Complicated | 4 | 16 |
| Complex | 99 | Infinite |
We split the amber and orange boxes based on the number of Questions.. That will make the number of boxes nine instead of four and give us the operational Complexity Profile (CP) of our project as presented below.

Now we can color the nine boxes and omit the number of questions for convenience.
Importantly, when we're considering the combination of alternative problems and solutions for a work item, the total number of alternatives multiplies. However, the total bits of information is the sum of the bits of information for each individual alternative.
The rules are as follows:
- If a work item is Complex either from "How"" or from "What" perspective, it is considered Complex.
- If a work item is Complicated either from "How"" or from "What" perspective, it is Complicated.
- Clear are only work items which are Clear in both perspectives.
Filling the knowledge gaps
"Lack of knowledge…that is the problem. You should not ask questions without knowledge. If you do not know how to ask the right question, you discover nothing." ~ W. Edwards Deming
An operational complexity profile is a maneuverable space. Each movement is a clarification. Clarification results from knowledge discovery.
All possible movements between domains are presented below.
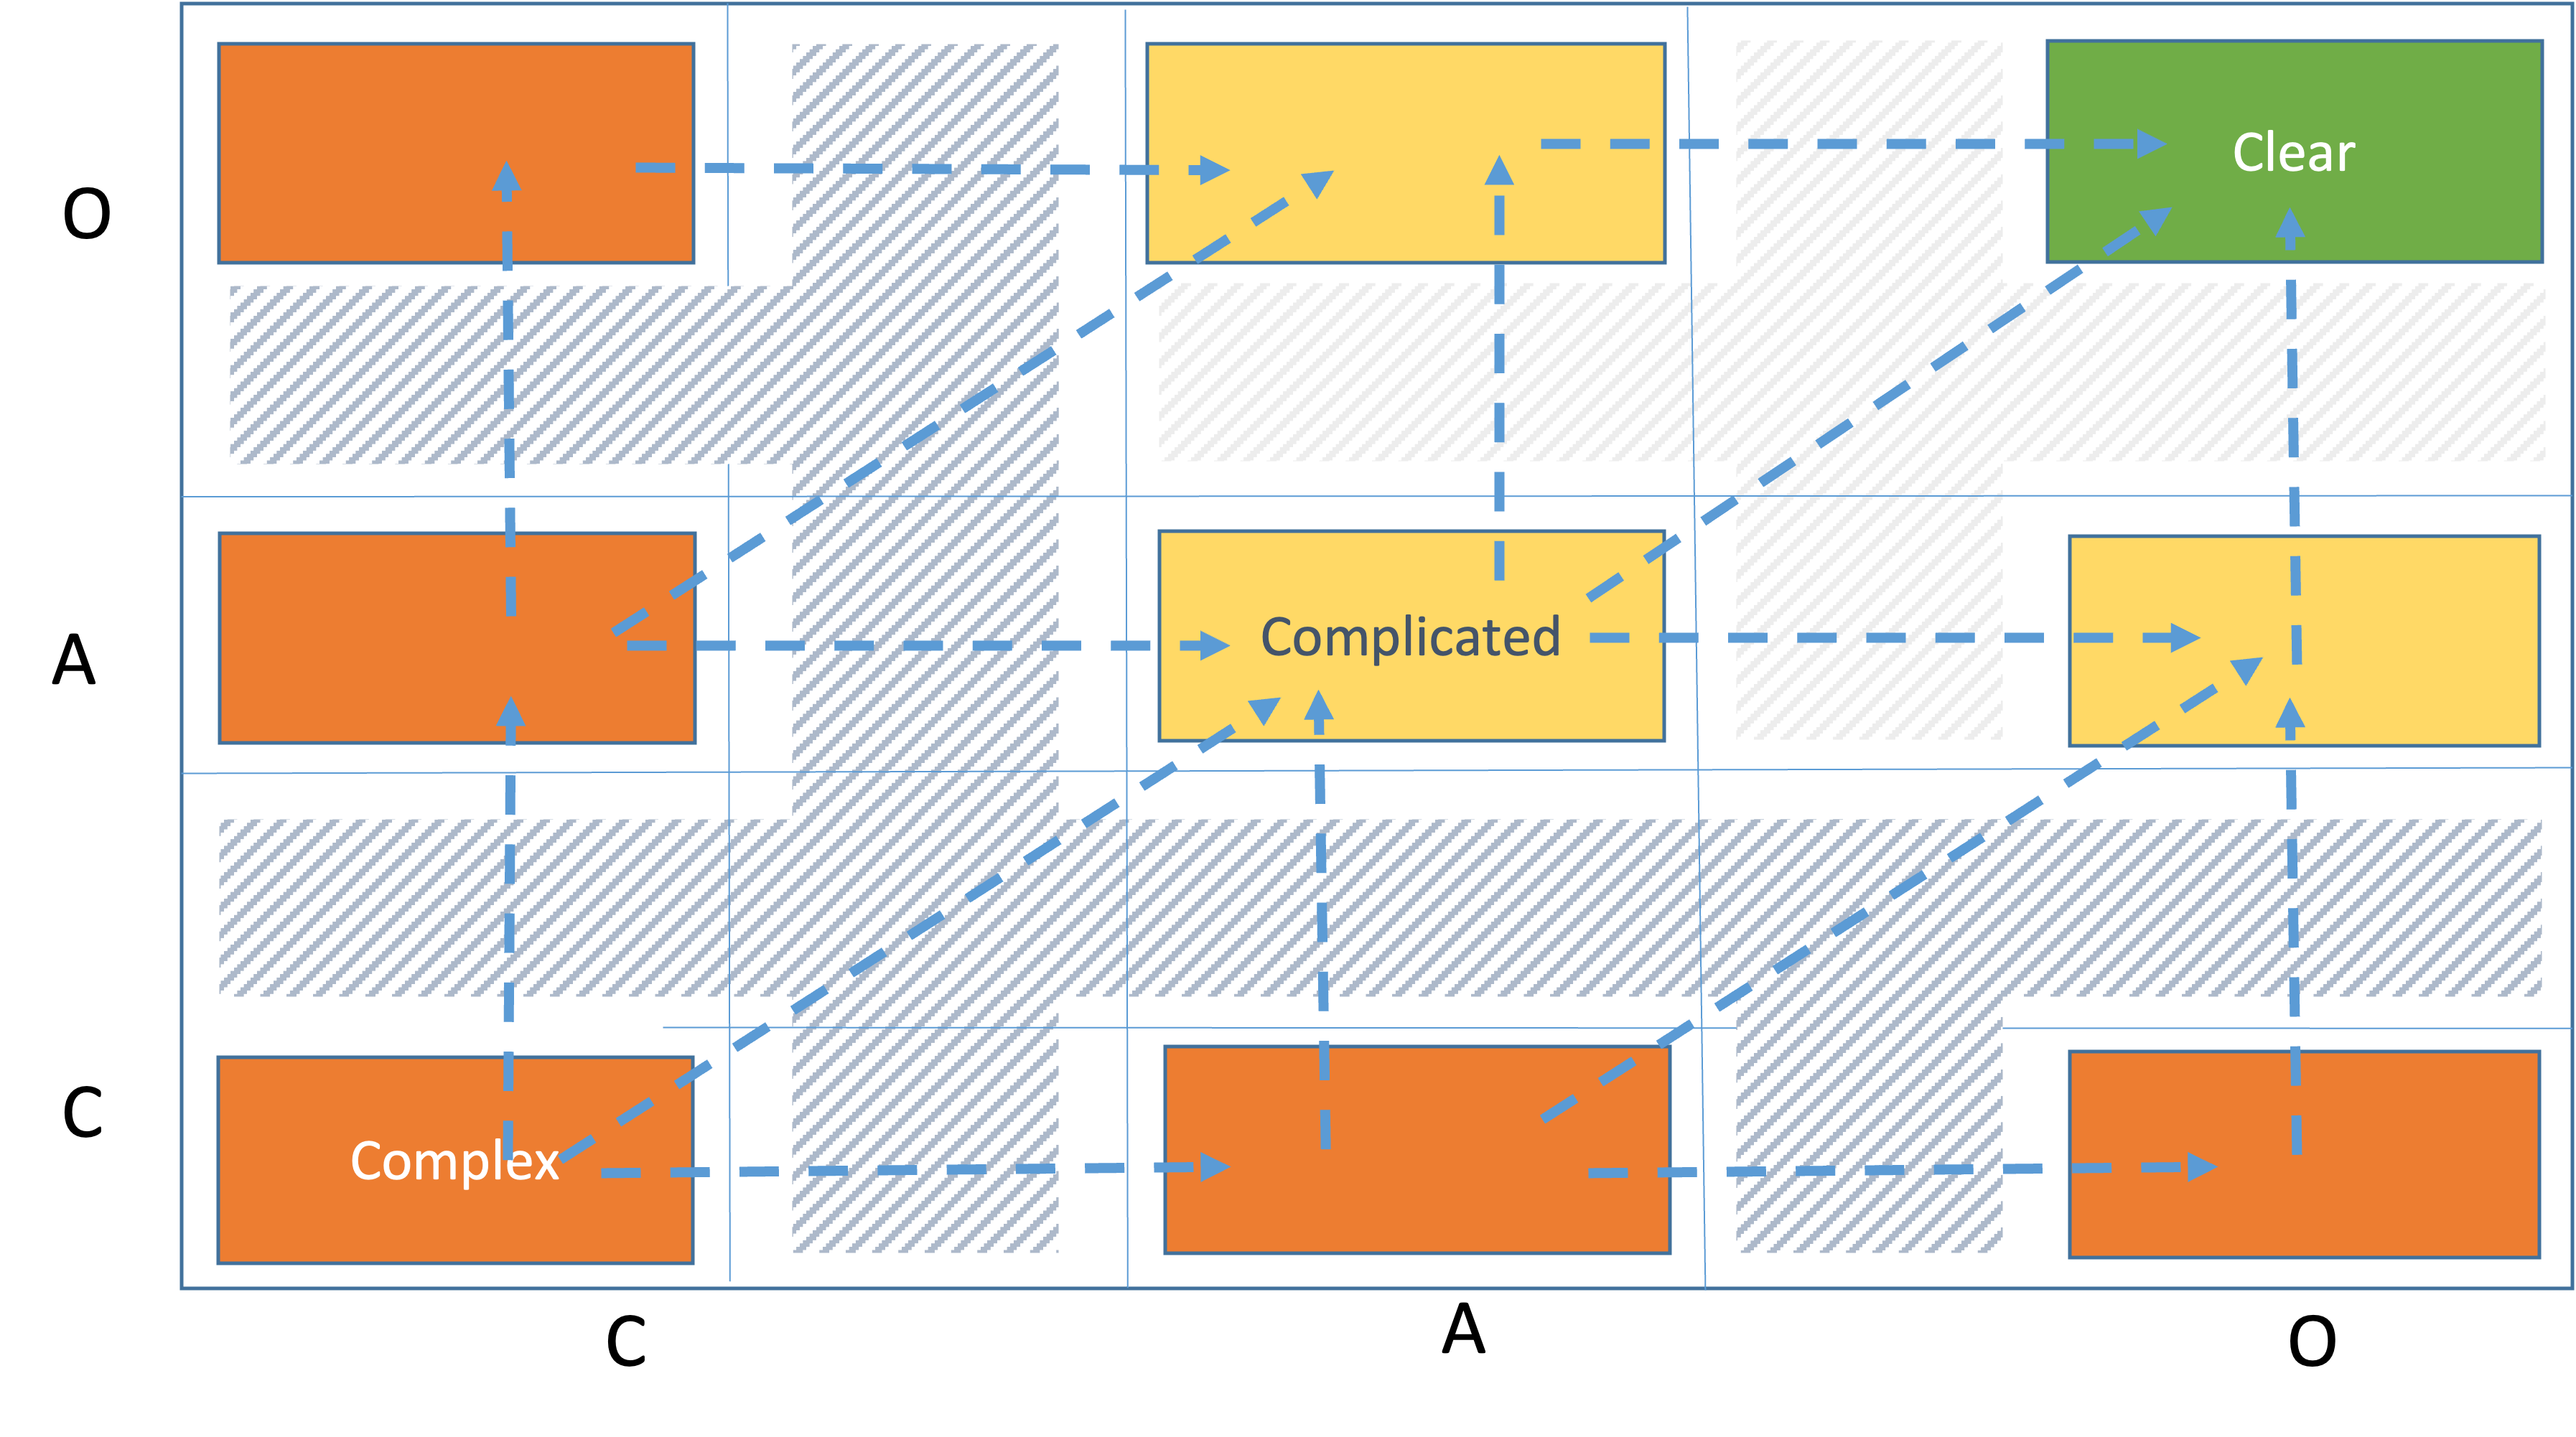
For example, if we want to move a work item from cell CC to cell AA we have three alternative routes:
- Linearly CC -> AC -> AA which means we clarify first the solution then the problem definition
- Linearly CC -> CA -> AA, which means we clarify first the problem definition then the solution
- Diagonally from CC to AA, which means we clarify both the problem definition and the solution
We also see the transition states between the cells. They are presented in stripes. A work item is in a transition state when it has left a cell but hasn't got into a new cell yet. That means work is being done to clarify the work item.
To clarify a complex work item the present day practice is to do two things:
- Meetings : meet and ask relevant people such as Subject Matter Experts (SMEs), software architects, external consultants etc.
- Experiments : employ numerous experiments in parallel which will provide the missing information needed.
Knowledge discovery funnel
We see that the complexity profile serves us as a map to show how we can acquire the missing knowledge. This dynamic can be presented in a simpler way as a movement through a funnel as shown below.
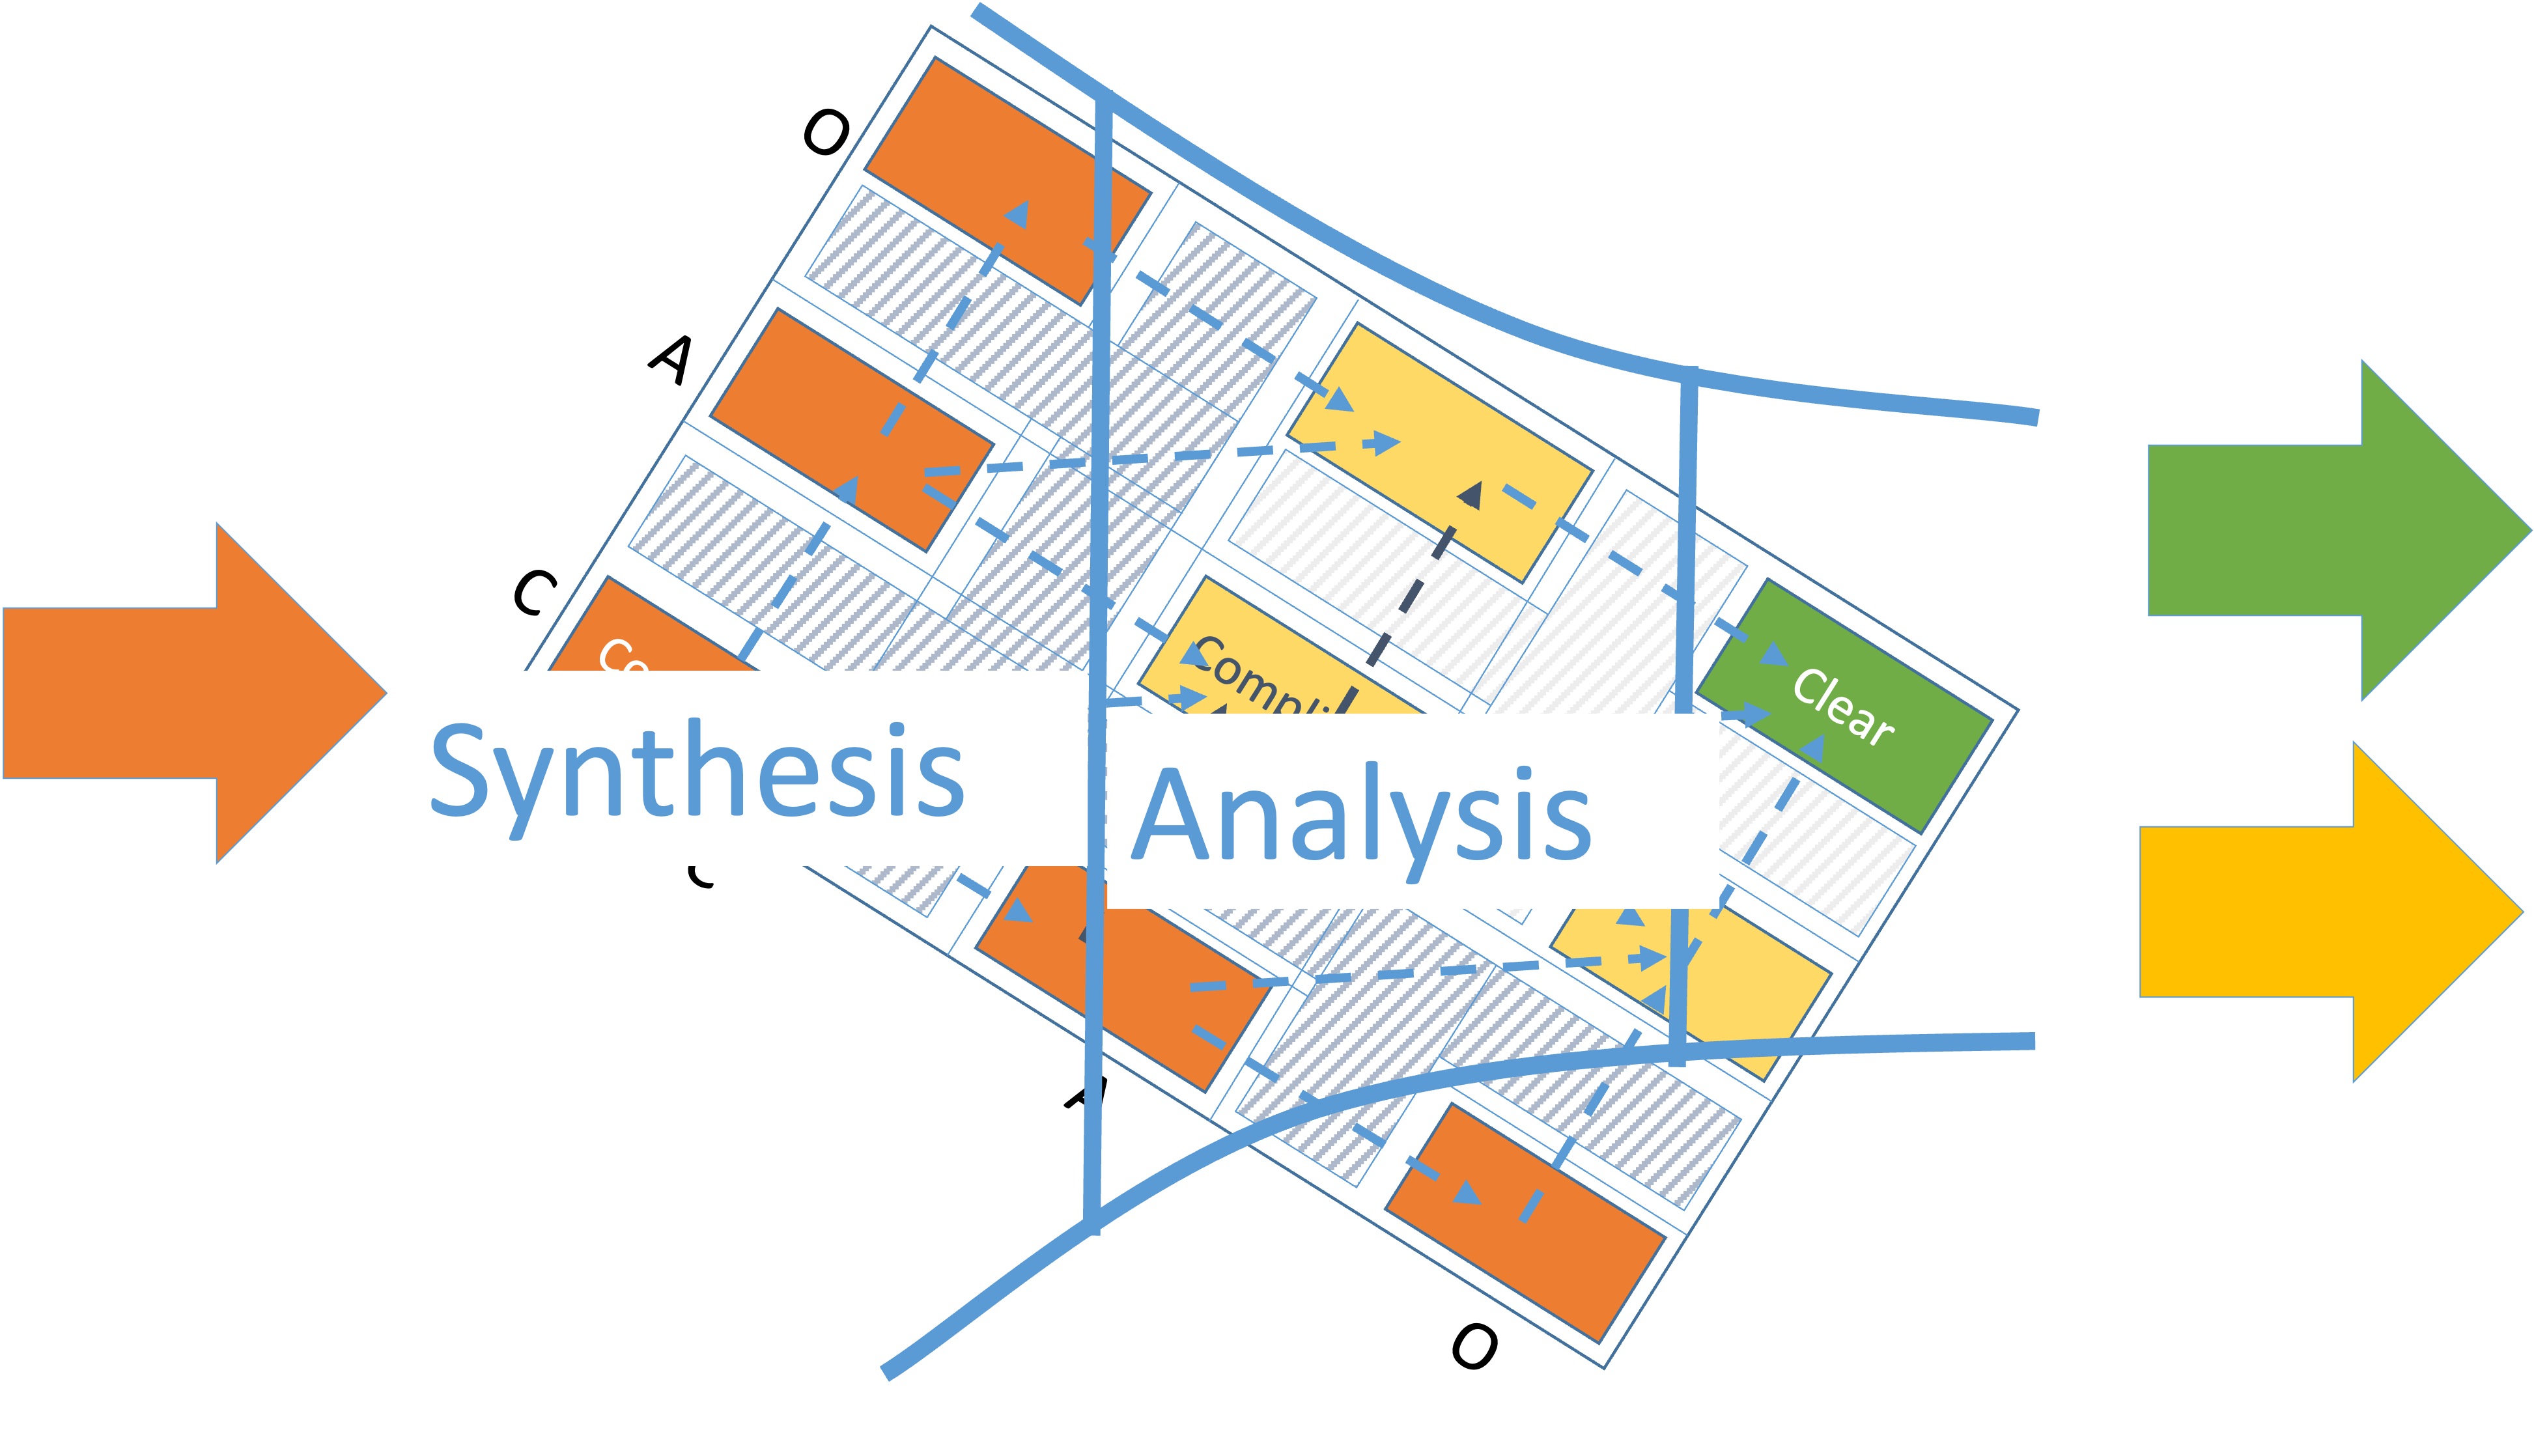
We have rotated the complexity profile 45 degrees so that the lines of movement from complex to complicated and from complicated to clear are horizontal.
The flow through the funnel should not be in a rush. Especially if the knowledge gaps are numerous, complex, and interrelated. It must enable efficient and effective learning to close the identified knowledge gaps. Otherwise, bad decisions would be made and cause rework that would be very costly to the project.
Delaying decisions will help you deal with making critical decisions with insufficient knowledge and simultaneously keep multiple options open until knowledge gaps are closed.
We have divided the funnel into two distinct parts: Synthesis and Analysis following the advice in the book “Essential Upstream Kanban”[2].
Unfortunately, analysis and thought are frequently treated as synonyms, but analysis is only one way of thinking; synthesis is another. While analysis provides the know-how, synthesis delivers understanding by connecting a work item's role and impact within the greater system. The distinction between knowledge (from analysis) and understanding (from synthesis) is fundamental for effective systems thinking, emphasizing the need to complement analytical thinking with synthetic views to fully grasp complex systems.
The Kanban board visualizes knowledge discovery processes
One of Kanban's notable practices is visualizing work on a board. Kanban advocates viewing the board not as a segmented workspace representing work steps, roles, or handoffs, but as a knowledge discovery process. Each column denoting a different phase of discovery and learning in an interconnected journey The workflow is perceived as a sequence of information discovery activities[1]
This perspective transforms the Kanban board from merely partitioning the process into stages, into a map outlining the dominant steps in discovering new knowledge[1]. This viewpoint allows us to capture the essence of Kanban, as a method designed to enhance learning and information acquisition in knowledge work.
As work items move from one column to the next, team members gain insights into various aspects of the work process, including efficiency, effectiveness, and areas where the knowledge discovery process can be improved. Thus, the board encourages team members to continuously question how and why things are done, leading to a deeper understanding of the work itself.
We can manage the knowledge discovery process on an End-to-End Kanban board as presented below.
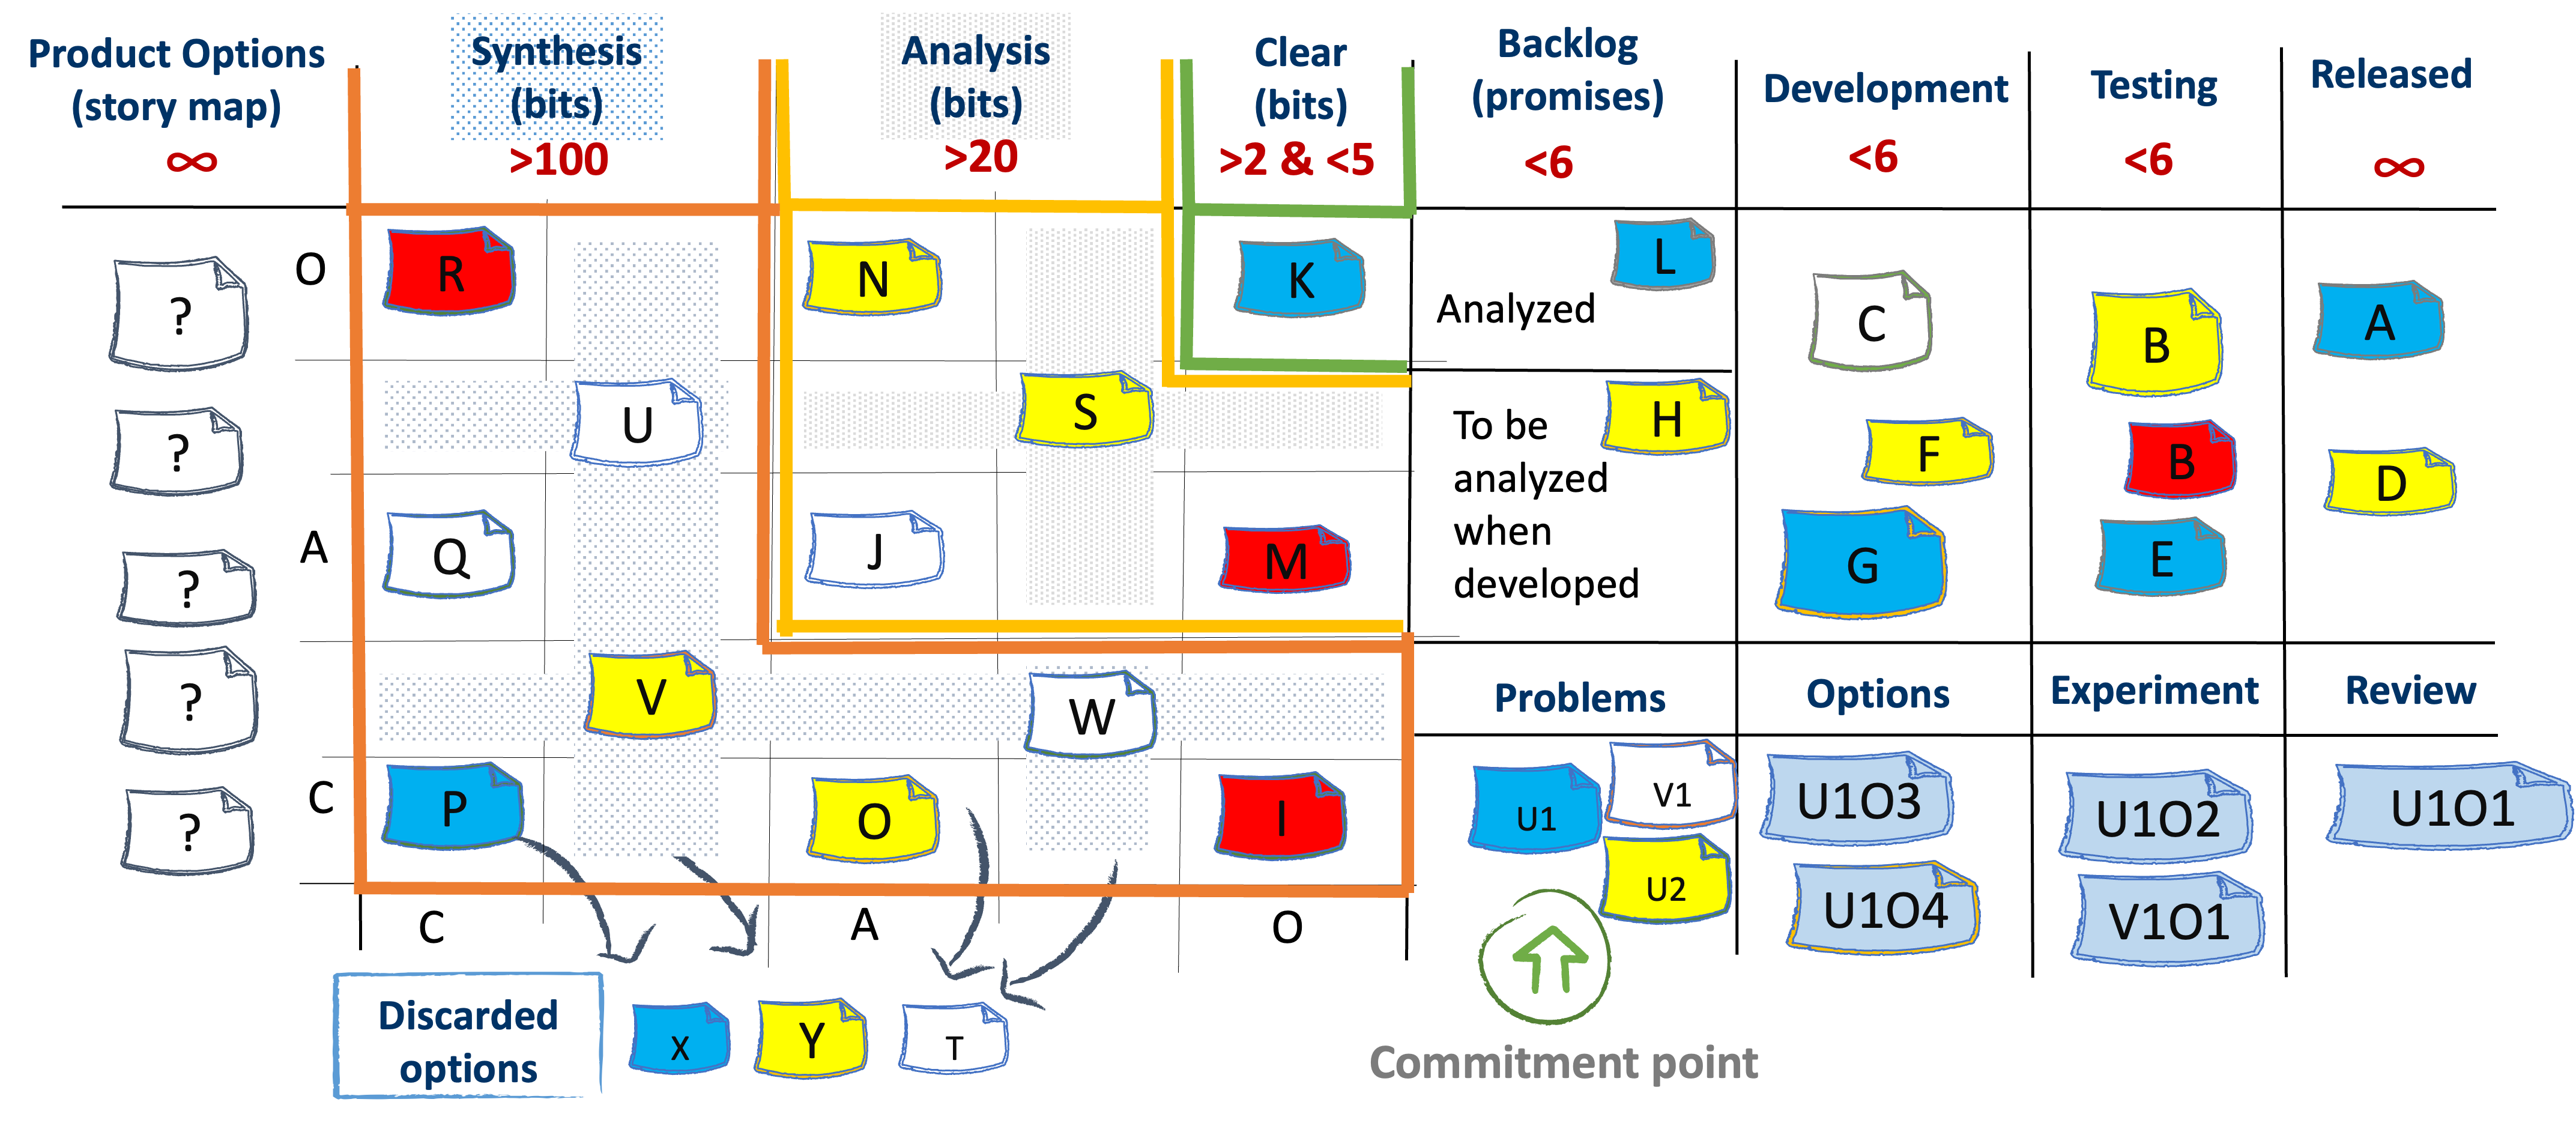
The left hand Discovery part of the board tracks exploring options. The right hand Delivery part of the board tracks promises to deliver.
Let's not forget that in the delivery part we are dealing with promises. Promises should not be canceled because the delivery system has a limited and expensive capacity. In the discovery part we are dealing with options. Options by definition can be discarded. That is presented as the “Discarded options” area of the kanban board.
It's essential not to think of the Kanban board as segregating 'discovery' and 'delivery' into distinct phases. Rather, discovery and delivery are concurrent processes; we are always discovering as we deliver, and vice versa, ensuring a continuous flow of knowledge and work.
The flow of work is not linear or sequential! – in reality it is done in parallel. We do the knowledge discovery in our heads and write software with our hands. The board just visualizes reality - what is happening in practice anyways.
Discovery Kanban board
The left hand part of the board is the Knowledge discovery funnel or the Discovery kanban board[2]. The requests for new things to be developed enter here. We'll call them options in order to show that it is not mandatory for them to be delivered at all.
A kanban system
The discovery Kanban board visualizes the Knowledge discovery funnel and has three columns Symbolizes, Analysis and Clear. They are highlighted in orange, amber and green respectively.
Cards in Synthesis represent complex options. Each complex option needs to go through synthesis and analysis in order to enter the Backlog part of the board. Complex options enter the funnel and get out as either Complicated or Clear.
The colors of the cards may reflect Classes of Service[1] or customer value[2]. Here we use colors to show the value. Red color means extreme urgency. White color means high and certain value. Yellow color means high, but uncertain value. Blue cards represent low, but certain value.
The typical Kanban practice focuses on limiting work in progress (WIP) by the number of cards, which controls the flow of tangible work items rather than the flow of intangible knowledge. In our knowledge-centric approach, WIP limits are set at the top of each column, but the numbers reflect the minimum bits of knowledge that need to be present in a column at any time.
For instance, the column Synthesis has to have at least 100 bits of knowledge to be discovered. They could be a few hundred but never less than 100. We see that the minimum values get smaller as we move to Analysis and Clear. This is because we are operating a funnel. The funnel starts at 100, then becomes 20 and ends in 2-5 bits of missing information.
We do that, because clear things are obvious for everybody else and hence not valuable to work on. We need a lot of knowledge to be discovered to enter the funnel because we want to acquire knowledge that remains unexplored by others
We have a pull system on the Discovery side. That means if we don't have at least 100 bits of knowledge to be discovered we have to do some work and find new options with knowledge to be discovered. But the low limit on Clear will prevent us from picking easy-to-find but non-valuable clear options. We don't want non-valuable, clear options to flood the delivery system with non-valuable delivery requests.
On the delivery side all work items have between 1 and 2 bits of knowledge to be discovered. Thus, we can limit work in progress in terms of the number of work items, just like in a traditional kanban system.
Knowledge discovery process
Here is how the process works following the Options workflow below.
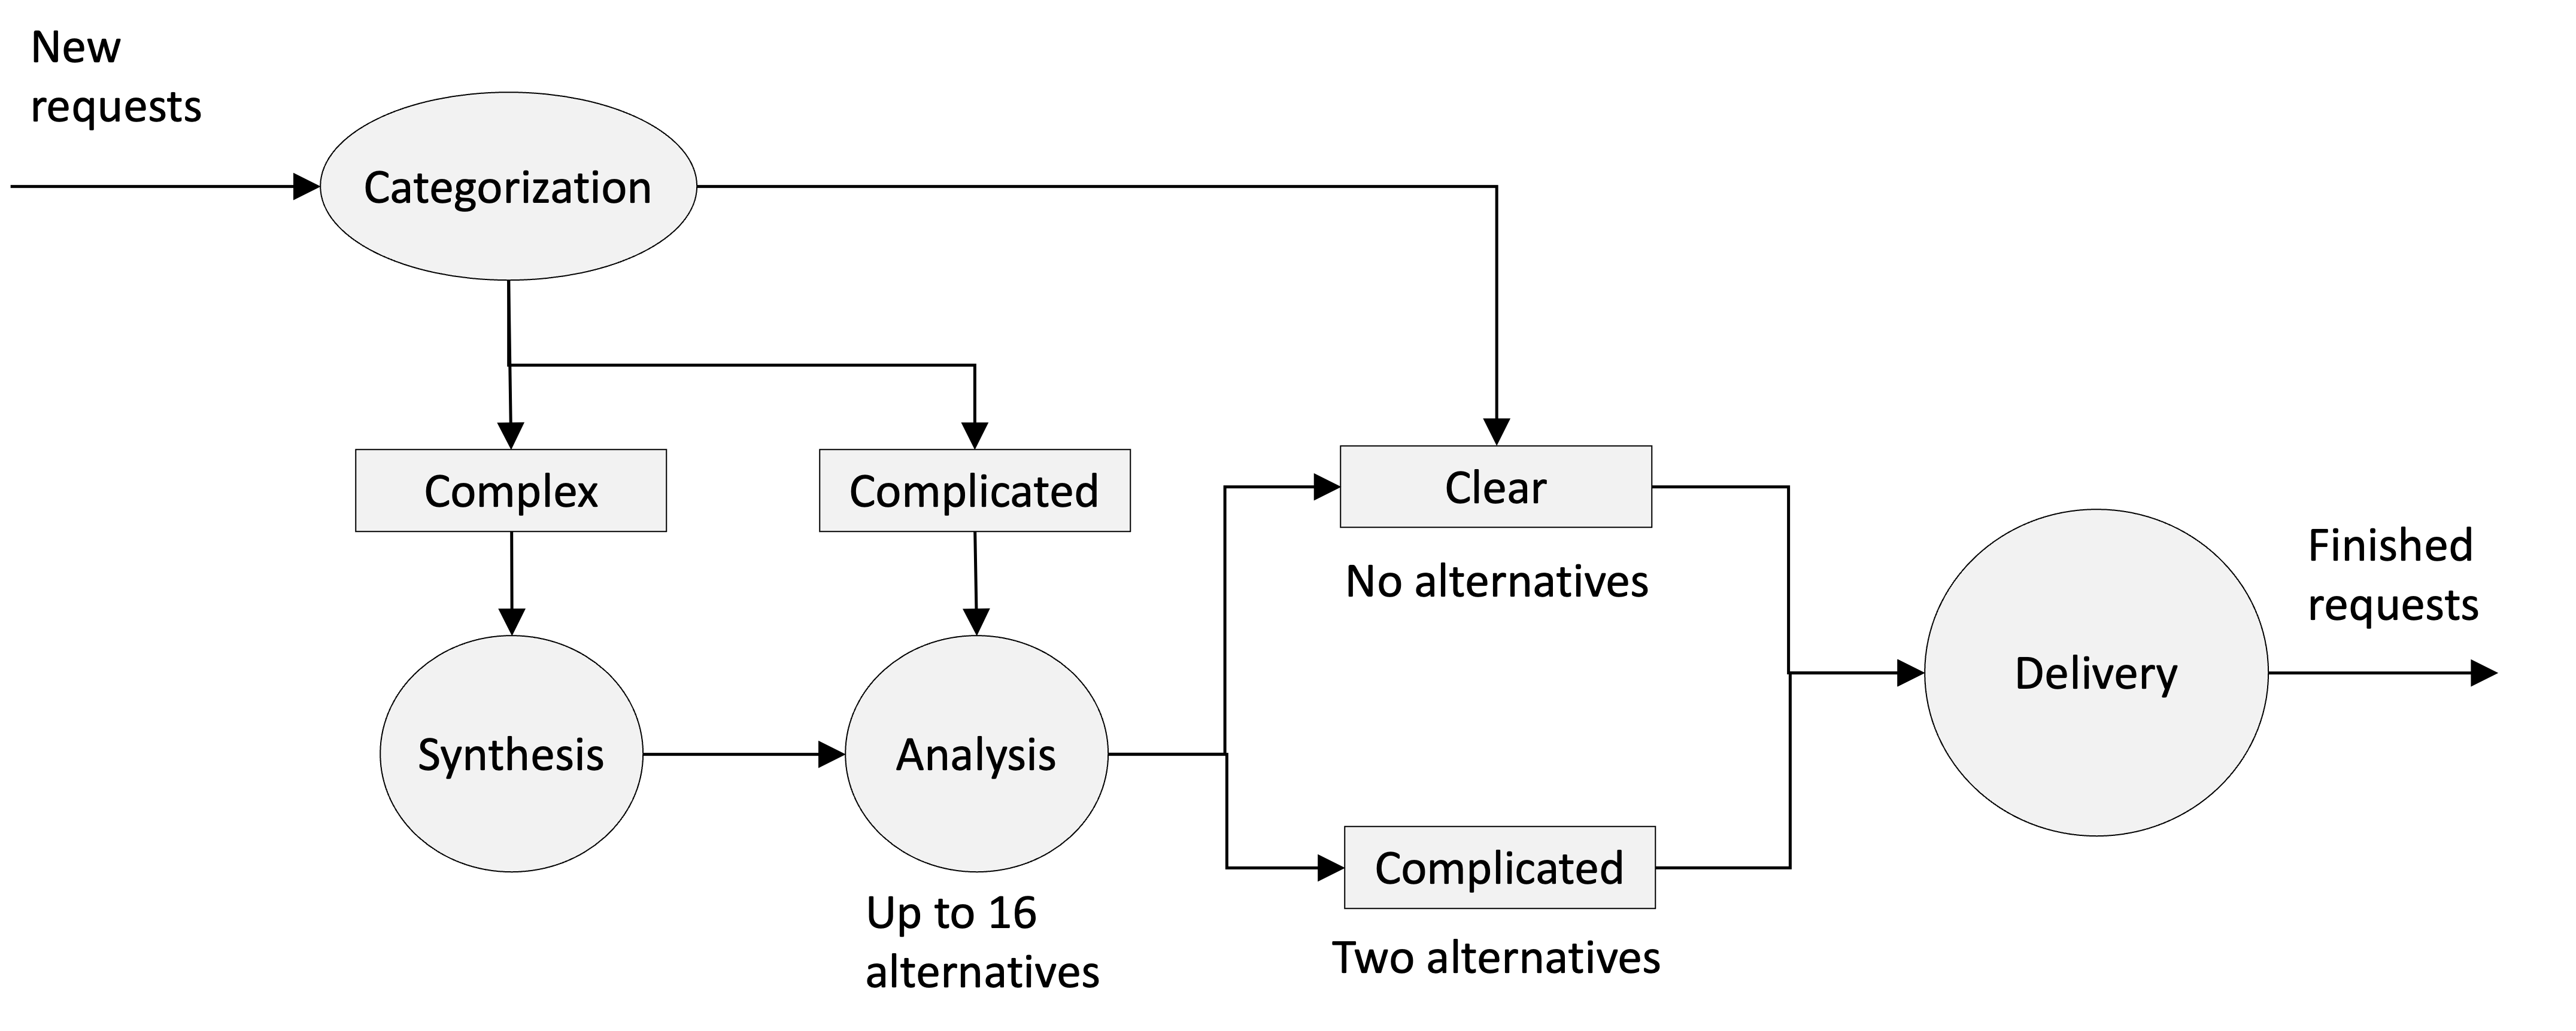
First step is to take one option and categorize it. Categorization means we place it at the proper cell in the complexity profile of the Discovery board. As we saw earlier the complexity profile acts like a funnel.
On the board an option can leave the discovery part and enter the delivery part either from Analysis or from Clear.
Cards in Clear can directly enter delivery. Cards in Analysis are complicated options. It is not mandatory for all complicated options to become clear. A complicated option may enter delivery when it is considered that the analysis can be done during the delivery. That could happen for two reasons:
- When an option is clear from client perspective and complicated from capability perspective because there are only two alternatives how to implement it. The choice of an alternative can be left to the delivery system to make.
- When the option is complicated from client perspective because there are small details to be decided e.g. text message content, colors etc. Those can be cleared during delivery.
An option cannot enter the delivery system directly from Synthesis. A complex option should never exit the funnel, because it will clutter the delivery process.
On the Knowledge discovery funnel (discovery board) it is also possible for cards to move “backwards”, say from complicated to complex. For example, we have a complicated option with a couple of alternatives about what to do. The client is considering which alternative to choose when new information from the market arrives and suddenly none of the alternatives is viable anymore. The client is back to the spot where they don't know what they want. The option is again complex.
Delivery Kanban board
The right hand part of the board is to visualize and manage the Knowledge Application work. Here we have a standard kanban board, with limiting the number of work items in each column.
Experiments Kanban board
Both analysis and synthesis of an option may require some experiments or probes e.g. a Proof of Concept (PoC).
How do we show on the board that we probe for an option? For that we use the Experiments Kanban board presented at the bottom. This Kanban board can be physically detached from the Delivery Kanban board. We put the option card in a transition cell e.g. between CC and AA, on the Discovery board. A new experiment card is placed in the Problems column. The experiment card follows the Problems - Options - Experiment - Review path. If the experiment provides the missing information then the option card is moved into an AA cell on the Discovery board. If not then it stays in transition. It could be the case that it is decided to abandon the option. That is presented as the “Discarded options” area of the kanban board.
Here is how the experiments are worked and tracked on the Experiments kanban board. We can use a great approach called POPCORN Flow[7].
Once we pick the problem we plan to focus on, we move the card to the “Options” column, which is next to the right of the “Problems” column. It is unlikely that a problem is so simple that there is only one option available to solve it. Thus, the problem that made its way into the "Options" column should be split into several possible options for solving it.
We then choose one option that seems to promise the best outcome. We move that option to the "Experiment" column to the right. Each experiment should be defined with three attributes:
- Action: which action is the experiment proposing?
- Duration: how long is the experiment expected to run?
- Expectation: What is the expected desired outcome of the experiment?
We can have additional columns like for the committed, worked on and finished experiments. We don't show that here because that is another large topic.
When the experiment is finished, it moves to the column to the right – “Review”. During the review, we ask some questions, such as:
- What did we expect to happen (i.e., the hypothesis)?
- What had actually happened?
- What did we learn?
- What opportunity do we perceive?
The problems, options and experiments must obey the constraints of the Work in Progress (WiP) for the delivery team. Importantly, each experimental option has 1 bit of information to discover e.g. A/B tests. This will assure experiments are small.
Measure the Knowledge Discovery Process
Now, after we looked at managing the Knowledge Discovery Process we shall delve into managing it. The present day favourite is to use Flow Metrics.
Flow Metrics focus on quantifying tangible logistics such as throughput and lead time for work items, providing insights into the efficiency and productivity of the software development process as a manufacturing system. However, there are inherent limitations. While Flow Metrics offer vital insights they don't cover the intangible aspects of knowledge work.
Recognizing this gap, we use Knowledge-Centric Metrics, which shed light on the intangible facets, providing insights into the performance of the software development process as a knowledge discovery process. Derived from the foundational Knowledge Discovery Efficiency (KEDE) metric, indicators such as Collaboration, Cognitive Load, Happiness (Flow State), Productivity(Value per Bit of information Discovered), and Rework (Information Loss Rate) present a multidimensional view of knowledge workers' experience and the overall efficiency of the knowledge discovery process.
We believe that when combined with Flow Metrics, the Knowledge-Centric Metrics provide a comprehensive, holistic view of knowledge work, thereby augmenting and enhancing the insights provided by Flow Metrics. For instance, there is no way to limit the number of alternatives a human being is holding in their head. Instead, we can limit the number of work items a team works on. The beauty of this approach is that Knowledge-Centric and Flow Metrics don't collide; they complement each other. They each offer a unique standpoint, and together, they provide a fuller picture of how knowledge work works.
Here, we focus on the Learning Curve as a metric, to capture the essence of knowledge growth within teams.
The Learning Curve
Recall, that software development is a process of knowledge acquisition and ignorance reduction[8]. It's a journey to identify and close knowledge gaps, reduce our uncertainty, and increase our knowledge iteratively. During each and every step, we discover and accumulate more knowledge about the work item. Upon delivery the process of knowledge discovery is completed. This dynamic can be represented by a learning curve.
The learning curve in software development encapsulates the accumulation of the knowledge discovered about "what to do" and "how to do it". Adopting a Knowledge-Centric approach, we measure this accumulation in bits of information, treating knowledge as the fuel that drives the software development engine.
The learning curve can be visualized by tracking the cumulative amount of knowledge discovered over time. For instance, consider a diagram illustrating the knowledge growth in bits for a specific project.
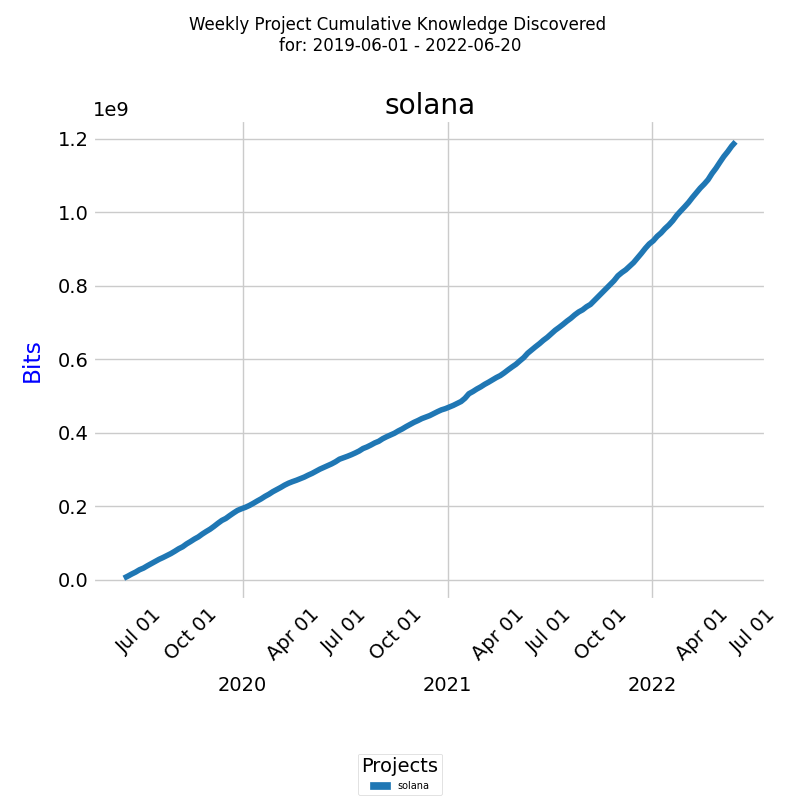
Over the given period, the total knowledge discovered accumulated to 1.2*109 bits or 1.2 terabits (Tbits). The blue line marks the cumulative knowledge growth, reflecting the team's advancement in the project.
To facilitate meaningful comparisons across projects with varying scales of knowledge acquisition, normalization of data is essential. Direct comparisons based on raw knowledge values, measured in bits, can be misleading due to differences in project scale.
Learning rate measured in bits of information discovered per unit of time, is a critical aspect of this curve. The higher the learning rate, the faster the knowledge discovery process. It assigns an improvement value to gauge the efficiency rate as engineers learn and become more knowledgeable[4].
We employ the cumulative growth rate (CR) of knowledge discovered, measured in bits of information discovered per unit of time, as a key metric for measuring normalized growth. CR effectively normalizes growth by taking into account variations in project sizes, durations, and initial knowledge levels. This approach transforms CR into a relative measure, enabling fair and equitable comparisons across diverse projects. The methodology for calculating CR is presented here.
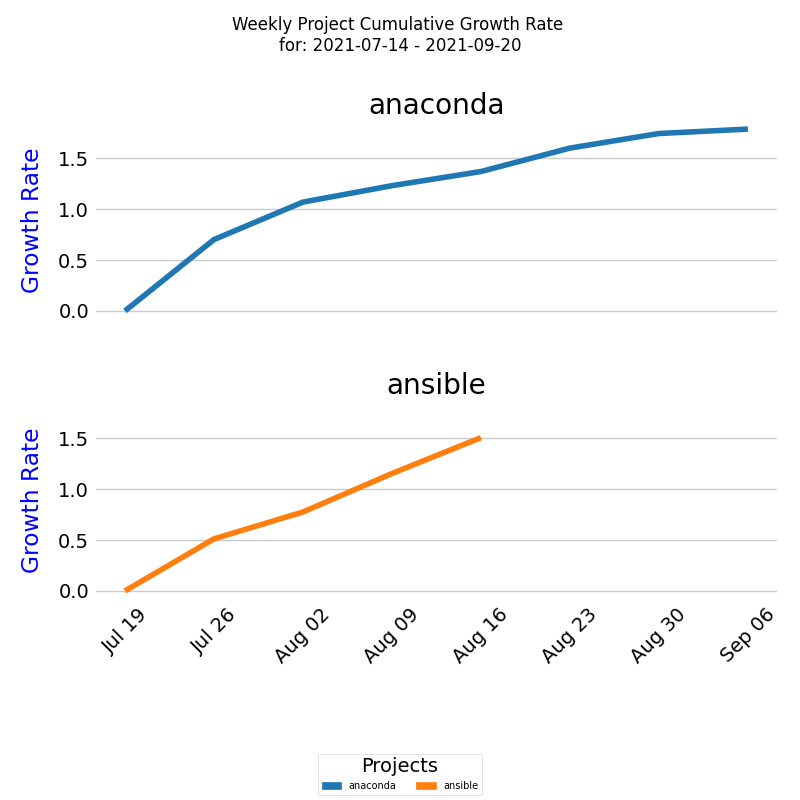
In the diagram below, the x-axis represents the timeline (in weeks), while the y-axis denotes the cumulative growth rate. The lines trace the cumulative growth rate for two projects over a period.
There are three different types of learning curves. We present them visually on the below diagram.
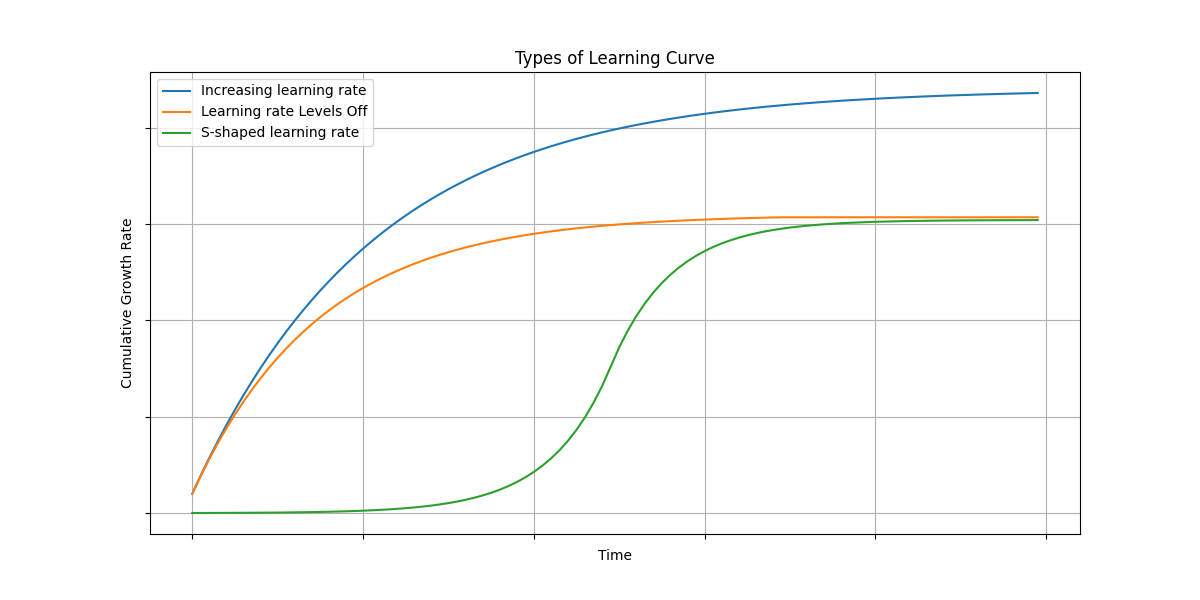
Each type provides insights into the dynamics of knowledge discovery and application, reflecting different project environments and stages of development.
Here's a short description for each of the three learning curve types measured using the Cumulative Growth Rate (CR) of knowledge discovered, along with insights into what each type might reflect about a project environment:
-
Increasing learning rate:
- Description: This curve shows a consistent increase in the learning rate over time, indicating that the rate of knowledge discovery is steadily growing.
- Project Environment Implication: This scenario might reflect a highly innovative environment where continuous experimenting and discovery are encouraged, and new challenges or technologies are frequently introduced. It might also indicate challenges or obstacles that are hindering learning and growth, such as ineffective knowledge sharing and collaboration, resource constraints, loss of key personnel, or a shift in project goals. For knowing the real cause we need to look inside the organization. Here is a case study of a blockchain company.
- Example scenario in real-world projects: A startup working on an innovative blockchain project. In the early stages, the team has a basic understanding of blockchain but needs to rapidly adapt to emerging technologies and methodologies. As the project progresses, they continuously encounter new challenges requiring novel solutions, leading to a consistently increasing learning rate.
-
Learning rate Levels Off:
- Description: The learning rate initially increases but then reaches a plateau, indicating that the rate of new knowledge discovery slows down and stabilizes.
- Project Environment Implication: This pattern is often seen in projects with a clear development, growth, and support phase, such as technology implementation projects. The initial fast growth represents a phase of rapid learning and low productivity, where there is accumulation of new knowledge. The slowdown indicates a phase of working on already well understood tasks, probably with high productivity. Finally, the project matures, and the rate of encountering new knowledge stabilizes. The leveling off suggests that while new knowledge is still being gained, the rate of learning has decreased, possibly due to the team becoming more experienced and encountering fewer unknowns. This pattern is typical of a mature project environment where the team has acquired substantial knowledge and established stable processes. This could also reflect a shift in focus away from exploration and towards optimization or routine work as the project goes into support mode.
- Example scenario in real-world projects: A software development team working on a long-term enterprise resource planning (ERP) implementation. Initially, there's a steep learning curve as the team familiarizes itself with the client's unique requirements and how they could be implemented with the specific ERP software. Over time, as they gain expertise, the learning rate stabilizes, and the team becomes more efficient in applying their knowledge.
-
S-shaped learning rate:
- Description: The learning rate curve starts with a slow knowledge growth, accelerates to a peak rate of knowledge discovery, and then slows down again, forming an S-shape.
- Project Environment Implication: This pattern is also often seen in projects that go through distinct stages. The initial slow growth of knowledge discovered represents working on routine, well understood tasks, leading to higher productivity. That could probably be done to make a good impression of high productivity. The acceleration indicates a phase of rapid learning and low productivity. As the curve progresses and the learning rate increases, this could indicate a phase where the team is encountering the real challenges of the work to be done, requiring more learning and potentially experiencing a temporary dip in productivity. Finally, the slowdown occurs as the project matures, and the rate of encountering new knowledge decreases. From a project management perspective, this is a wrong way, because they tried to deny the reality, which is a constant acquisition and application of new knowledge.
- Example scenario in real-world projects: A software development team is tasked with creating a new mobile application. Initially, they focus on basic functionality using familiar technologies, leading to a low learning rate and high productivity. However, as they start integrating advanced features like machine learning for personalized user experiences, the learning rate accelerates and productivity lowers. Eventually, as the major challenges are addressed and the team becomes proficient, the learning rate slows down and productivity improves again.
Each of these learning curve types not only reflects the rate of knowledge acquisition but also provides insights into the project's complexity, the team's adaptability, and the overall project lifecycle. By analyzing the learning rate, project managers and teams can better understand their learning environment, identify areas for improvement, and make informed decisions about resource allocation, training, and process adjustments.
The Learning Curve as a Leading Indicator
Project managers are encouraged to use the learning curve of their current project as a benchmark against a reference class of past similar projects. Unlike traditional metrics such as throughput and lead time, which are only measurable after work items are completed and delivered, the shape of the learning curve becomes visible just a few weeks into the project.
This early visibility allows managers to anticipate problems well before any deliverables are affected. If a team is not acquiring knowledge at an expected rate, it may indicate underlying issues within the project. Conversely, if a team acquires the necessary knowledge at the expected rate, the process is considered predictable. This insight allows managers to investigate and address the root causes proactively.
The below diagram provides a comparative view of six project learning curves:
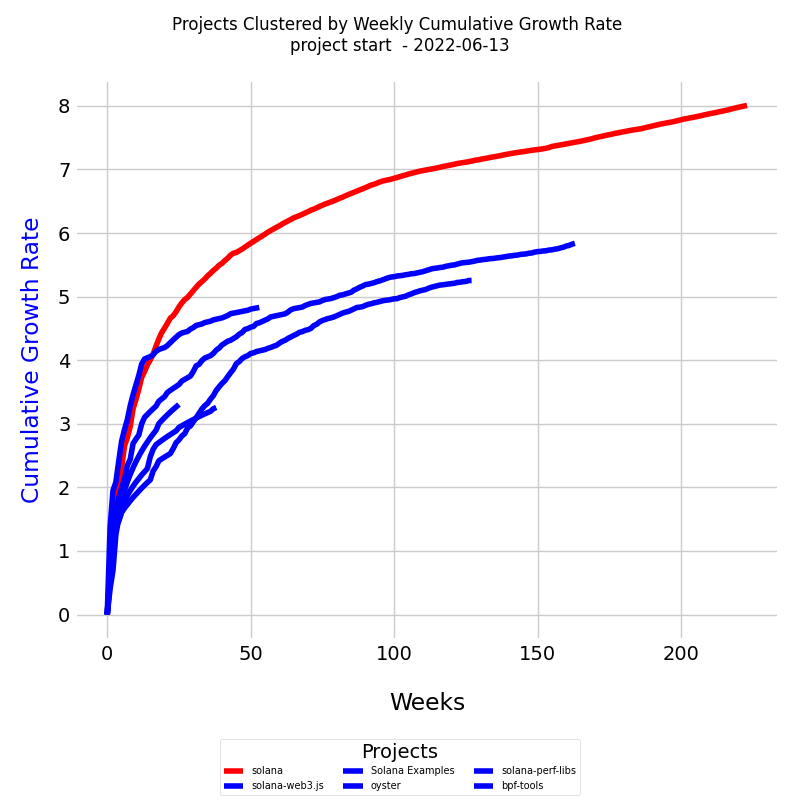
The x-axis of the diagram represents the timeline, measured in weeks, while the y-axis indicates the cumulative growth rate (CR). Reference Class Curves are in blue. These curves represent the learning trajectories of similar past projects. They serve as a benchmark for expected knowledge growth. The red curve illustrates the learning rate of the current project. How the diagram is prepared is explained here.
In this example, we observe that the CR of the new project is not aligning with the trend seen in the reference class. This discrepancy suggests potential areas within the new project that may require closer examination and intervention.
Forecasting Project Completion Time
Typically, project forecasting methods and frameworks focus on factors such as task breakdown, resource allocation, past experience, or statistical models. By bringing the knowledge discovery process to the forefront, we're highlighting the importance of understanding the learning curve, problem-solving, and adaptation involved in projects, and how these factors contribute to the overall completion time.
Emphasizing the role of knowledge discovery as part of projects in forecasting completion time provides a fresh perspective for project managers to consider when estimating and managing projects.
Forecasting is inherently uncertain, as it involves making predictions about future events or trends. To better manage this uncertainty, we will be using a probabilistic forecasting approach that generates multiple scenarios to represent various possible outcomes.
We will be using Reference Class Forecasting (RCF) as a useful tool for improving the accuracy of project estimates, as it relies on objective data from similar projects rather than relying solely on expert judgment or intuition.
The objective is to create an array of potential future scenarios for a project by considering the uncertainty in cumulative growth rates. Each of these scenarios represents a unique way in which the project's knowledge discovery might unfold.
By integrating the knowledge discovery process into RCF, we can create more nuanced and accurate project completion time forecasts, considering both historical data from similar projects and the unique learning and problem-solving aspects of our project.
To implement Reference Class Forecasting (RCF), we will follow these steps:
- Identify a Suitable Reference Class: Select past projects that are similar to the current project to serve as a reference class. When determining similarity, consider factors that impact knowledge acquisition and project complexity, such as gaps in understanding, client type, team structure, and business domain expertise. The reference class is established by comparing learning curves.
- Collect historical data: Gather data from the reference class on the key metric cumulative growth rate (CR) of knowledge discovered. This requires access to credible, empirical data for a sufficient number of projects within the reference class to make statistically meaningful conclusions.
- Forecasting: Using each of the CRT time series to forecast the completion time for the current project. We will make sure to consider uncertainty in the model predictions.
- Histogram: After obtaining the completion time forecasts for the current project based on each CRT time series, we create a histogram of the completion time values to visualize the frequency distribution. The histogram will provide a visual representation of the likely completion times and their probabilities, allowing us to assess the overall distribution of possible completion times.
This method is a reasonable approach for forecasting the project completion time while accounting for the inherent uncertainty in the cumulative growth rates. Just keep in mind that the actual project completion times may differ due to various factors not considered in the forecasting process.
Below is how the forecast may look: on the forecast graph, the thick blue line represents the cumulative growth rate of the knowledge expected to be discovered for the successful delivery of the project.
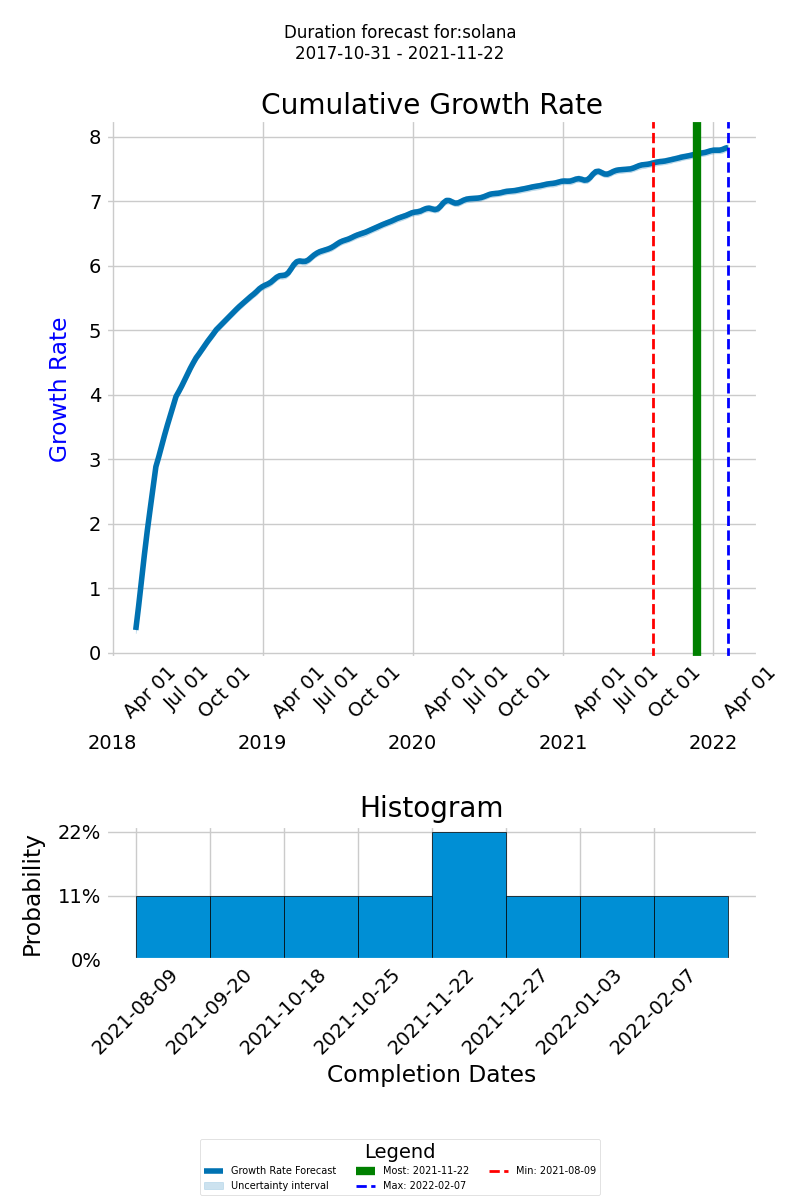
The x-axis displays the timeline of the new forecasted project, and the y-axis shows the cumulative growth of the knowledge to be discovered The green line represents the most likely completion date, the dashed red line indicates the earliest possible completion date, and the dashed blue line designates the latest possible completion date. This range of outcomes helps us prepare for different eventualities and plan the project more effectively.
The histogram of the completion dates is at the bottom of the diagram. Its purpose is to provide a visual representation of the likely completion dates and their probabilities, allowing us to assess the overall distribution of possible completion times.
Conclusion
In conclusion, this article has explored the process of knowledge discovery in Kanban, advocating for a Knowledge-Centric perspective that enriches traditional practices. By integrating the dynamic and intricate process of knowledge discovery into the foundational structure of Kanban, we illuminate the path from the initial identification of work items to their ultimate delivery. The introduction of the Complexity Profile (CP) and the Knowledge Discovery Funnel, visualized through a Kanban board, provides a structured framework for navigating the complexities inherent in knowledge work.
Through the measurement and comparison of learning curves, we have demonstrated the utility of these methods in understanding the nuances of knowledge acquisition across different projects. Furthermore, the application of probabilistic forecasting approaches like Reference Class Forecasting (RCF) to forecasting project completion times. This method provides a lens through which we can view the intricacies of knowledge growth and its pivotal role in project completion.
The Knowledge-Centric Metrics, focusing on aspects such as Collaboration, Cognitive Load, and Happiness, augment the insights provided by Flow Metrics, facilitating a deeper understanding of both tangible and intangible elements at play. By capturing both the tangible logistics and the intangible aspects of knowledge work, this holistic approach provides a more comprehensive framework for assessing and improving the knowledge discovery process.
This article posits that the future of knowledge work lies in our ability to effectively manage and navigate the knowledge discovery process. The journey through knowledge discovery to project completion is complex and fraught with uncertainty, yet armed with the insights and frameworks presented in this article, we can navigate these waters with greater confidence, clarity, and success.
Appendix
Meetings
In software development, the journey from an initial concept to a finished product involves continuously filling in gaps in knowledge about "What" needs to be done (the requirements and goals of the project) and "How" to do it (the technical and strategic implementation details). Meetings play a crucial role in this process by facilitating the exchange of information among all parties involved, such as developers, managers, and clients.
Here's how meetings help address these two foundational areas based on the Purpose of Meetings:
-
Understanding "What" to Do (The Requirements)
- Requirement Gathering Sessions: These meetings involve stakeholders and developers and are crucial for capturing the detailed needs and expectations of the client. The main goal is to transform vague ideas and business needs into clear, actionable requirements that the development team can work on.
- Planning and Prioritization Meetings: During these sessions, the team discusses and decides on the features and tasks that are of the highest priority based on the requirements gathered. This includes breaking down large tasks into manageable pieces, estimating timelines, and setting milestones.
- Progress Updates and Stand-ups: These are shorter, regular meetings where team members report their progress on the tasks assigned. This helps ensure that the project is on track and aligned with the 'What' that was defined. Any deviations or misunderstandings about the requirements can be quickly addressed.
- Client Review Meetings: These meetings are held to show progress to clients and confirm that the development aligns with their expectations. They are crucial for validating that the team's understanding of 'What' needs to be done matches the client's vision.
-
Understanding "How" to Do It (The Implementation)
- Design Discussions: Once the requirements are clearly understood, these meetings focus on the technical aspects of how to implement those requirements. This involves selecting technologies, defining software architecture, and discussing design patterns that best fit the project’s needs.
- Code Reviews: These meetings are technical sessions where developers critique each other’s code. The primary goal is to ensure that the code not only functions as intended but is also well-structured, clean, and maintainable. These sessions help disseminate best practices and shared understanding of the implementation details. These meetings are essential for ensuring that the code being written aligns with the project's standards and best practices. They help identify potential issues early on and maintain code quality throughout the development process.
- Retrospectives: These meetings are held after a project phase or sprint to reflect on what went well, what didn't, and what can be improved. They are crucial for learning from past experiences and continuously refining the development process. By discussing the 'How' of the project, teams can identify bottlenecks, inefficiencies, and areas for improvement.
- Knowledge Sharing Sessions: These meetings are focused on sharing expertise, best practices, and lessons learned among team members. They help disseminate knowledge, foster collaboration, and ensure that the team is aligned on the technical aspects of the project. By discussing the 'How' of the project, teams can identify bottlenecks, inefficiencies, and areas for improvement.
- Problem Solving and Debugging Sessions: When developers encounter technical hurdles or bugs, these meetings are used to pool collective expertise and find solutions efficiently. This collaborative approach can significantly speed up the problem-solving process.
By organizing and conducting these various types of meetings, software development teams create a structured approach to both discovering and disseminating knowledge. Meetings act as critical nodes where information is exchanged, decisions are made, and consensus is reached. As such, they are essential for systematically reducing the unknowns in both the 'What' and the 'How' of software projects, thereby driving the project from an idea to a deliverable product with minimized risks and maximized efficiency.
Synthesis
Synthesis is the intellectual process of combining different ideas to form a new, comprehensive understanding. It involves:
- Objects: The basic entities that make up reality, having properties that define their nature and identity.
- Properties: Attributes of objects, such as color, shape, and size, that distinguish them from one another.
- Relations: The connections between objects, or between objects and properties, like causality and spatiotemporal proximity.
Synthesis begins by viewing individual elements as part of a larger whole, focusing on the system rather than its components. This approach follows the principle that the behavior of a whole system explains the functions of its parts. Synthesis makes complex systems understandable by explaining parts through their roles in the whole, thereby simplifying the creation of comprehensive solutions.
For instance, in developing an e-commerce website, recognizing the relationships between products, customers, orders, and payment methods is crucial. A synthesized approach could lead to features that enhance user experience, such as easy access to purchase history or recommendations based on product relations.
Analysis
Analysis is the process of systematically examining an object to break it down into its manageable parts, understand their interconnections, and identify underlying patterns and relationships.
In software development, analysis involves dissecting a problem or system to grasp its essentials—requirements, constraints, and design considerations. This foundational understanding guides the creation of solutions that more accurately address the needs within a problem domain.
Analysis means obtaining answers to known questions.
Essentially, analysis is about answering specific questions to clarify complex scenarios or choose the best alternative. For example, in the context of an e-commerce website, analysis would entail examining the properties of "Products" and "Customers" and their interaction ("A customer can purchase one or more products") by asking:
- What are the properties of products (e.g., name, price, category)?
- What are the customer properties (e.g., name, email, purchase history)?
- How does the customer-product relationship influence the website's design and features?
This detailed inquiry leads to informed solutions that enhance the user experience, such as a navigable product catalog, efficient customer account management, and a streamlined checkout process. Through analysis, software developers can construct a website that not only aligns with customer needs but also optimizes their interaction with the site.
How to cite:
Bakardzhiev D.V. (2024) Kanban: A Knowledge-centric Perspective https://docs.kedehub.io/kede-manage/kede-kanban.html
Works Cited
1. Anderson, D. J., & Carmichael, A. (2016). Essential Kanban Condensed. Lean-Kanban University.
2. Steyaert, P. (2018). Essential Upstream Kanban (Illustrated edition). Lean-Kanban University.
3. The Kanban Lens: a way to see
4. L. B.S. Raccoon. 1996. A learning curve primer for software engineers. SIGSOFT Softw. Eng. Notes 21, 1 (Jan 1 1996), 77–86. https://doi.org/10.1145/381790.381805
5. Schmidt HK, Rothgangel M, Grube D. Prior knowledge in recalling arguments in bioethical dilemmas. Front Psychol. 2015 Sep 8;6:1292. doi: 10.3389/fpsyg.2015.01292. PMID: 26441702; PMCID: PMC4562264.
6. Shannon CE. (1948), A Mathematical Theory of Communication. Bell System Technical Journal. ;27(3):379-423. doi:10.1002/j.1538-7305.1948.tb01338.x
7. Q&A with Claudio Perrone on PopcornFlow
8. Armour, P.G. (2003). The Laws of Software Process, Auerbach
9. Drucker , Peter F, “Knowledge-Worker Productivity: The Biggest Challenge,California Management Review, vol. 41, no. 2, pp. 79–94, Jan. 1999, doi: 10.2307/41165987.x
Getting started


