How to measure Developer Happiness
A knowledge-centric approach.
Related Articles
Abstract
As software development is a highly cognitive and mentally demanding activity, it's important to understand how to measure the happiness of developers. A state of "flow" is a key indicator of optimal experience and happiness in work.
To achieve flow, one must find a balance between individual capability and work complexity, with a slight inclination towards challenges. This balance can be measured by tracking the knowledge discovered after successful work completion.
KEDEHub offers a way to measure knowledge discovery in software development, using the scientifically-backed and patented metric, Knowledge Discovery Efficiency (KEDE). With KEDEHub, you can assess the balance between a developer's skills and task complexity and measure the happiness of your developers.
What makes developers happy?
Developers find happiness in their day-to-day work, and a key indicator of this is achieving a state of flow
Flow is a state of optimal experience that generates feelings of happiness and enjoyment. Flow states are commonly referred to in many ways in society, such as "wired in," "in the groove," "in the moment," and "the zone."
Research indicates that flow experiences represent a distinct state that can be identified not only through self-report data but also through physiological measures[13]. The key characteristics of a person experiencing flow include:
- A sense of loss of self-consciousness.
- A perception of time passing faster.
- A sense of control over one's actions, as increased capabilities reduce the margin of error.
- A state of security and relaxation with the complete absence of worry.
Individuals who have experienced flow often wish to replicate the activity, regardless of whether it provides material rewards or not. This suggests that flow is an optimal experience that facilitates the fulfillment of individual potential.
According to Csikszentmihaly, flow appears at the boundary between boredom and anxiety, when the challenges are balanced with the individual's capabilities[1][2].
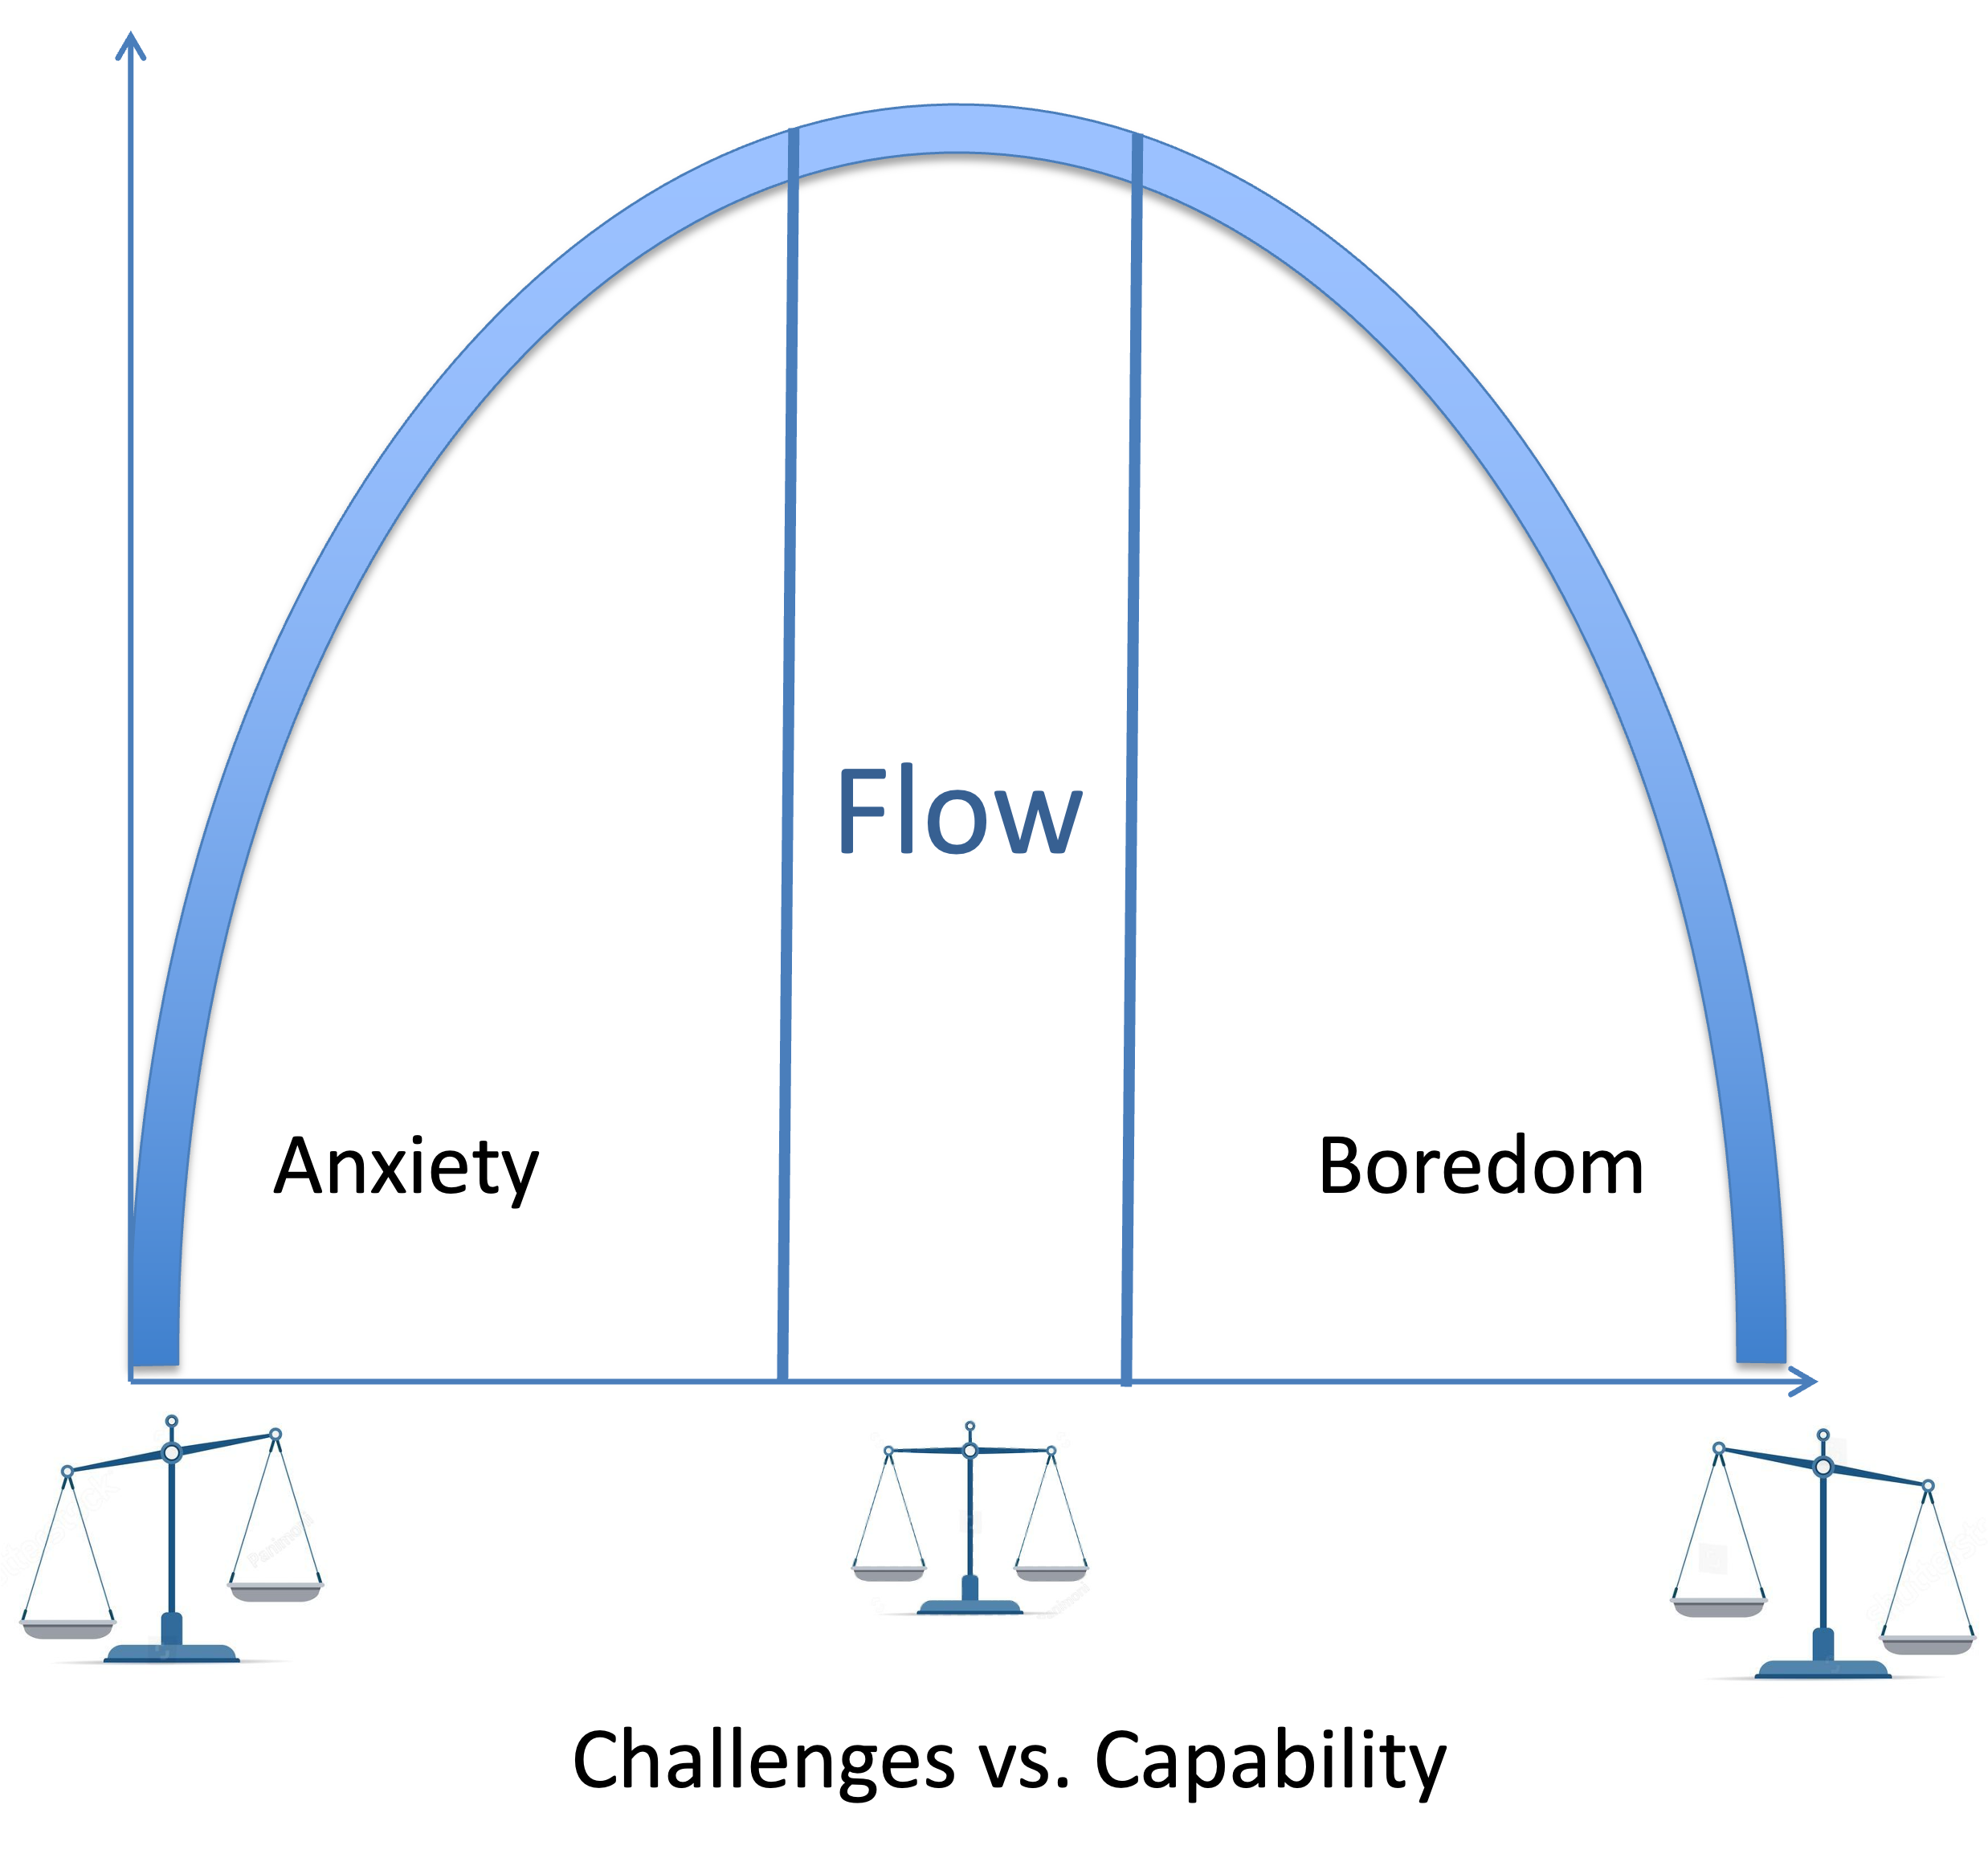
- Graph Axes: X = ratio between an individual's perceived skills and the perceived challenges
- FLOW: a balance between an individual's perceived skills and the perceived challenges
- Boredom: Low challenge, high capability — If challenges are too low, one gets back to Flow by increasing them.
- Anxiety: High challenge, Low capability — If challenges are too great, one can return to the Flow state by reducing the challenge or developing new capabilities.
Controlled experiments have shown that optimal challenges lead to flow[10]. The challenges that lead a developer to experience flow are those inherent in software development. These challenges are an integral part of software development and are not external to it. This is why flow is considered to be intrinsically motivating, rather than extrinsically motivating: the motivation comes from within the activity[5].
Sustaining flow is dependent on the fact that neither capabilities nor challenges remain constant. When the challenges presented exceed an individual's capabilities, they may experience states of perplexity, worry, and anxiety. On the other hand, if there are no challenges in a task that match the individual's capabilities, they may become bored. Prolonged boredom can eventually lead to a state of anxiety, as there may be a perception that current capabilities may be lost[4].
Entering Flow
Entering a flow state depends on finding a balance between an individual's perceived skills and the perceived challenges of a task. In other words, the individual's capability should match the complexity of the work.
To enter and maintain a flow state, the following conditions should be met[3]:
- The opportunity for action, with a clear and attainable goal. That doesn't meant having an overall goal for the activity, but knowing what to do next from moment to moment[9]
- An action with a balance between skill level and challenge, meaning that the activity is neither too easy nor too difficult.
- Clear and immediate feedback, so that successes and failures are apparent and behavior can be adjusted as needed.
The balance should be established for each task the developer will face. Once the conditions for action are in place, the developer is able to engage in a series of challenging tasks that are neither too difficult (not overwhelming) nor too easy (not boring). By balancing each task, we can create the conditions for entering flow for each set of tasks, each feature, and ultimately, for the scope of the project.
When the conditions for flow are met, they create a feedback loop between action and feedback that allows for continuous, effortless tuning of performance while taking action. This feedback loop makes an activity worth doing for its own sake[3].
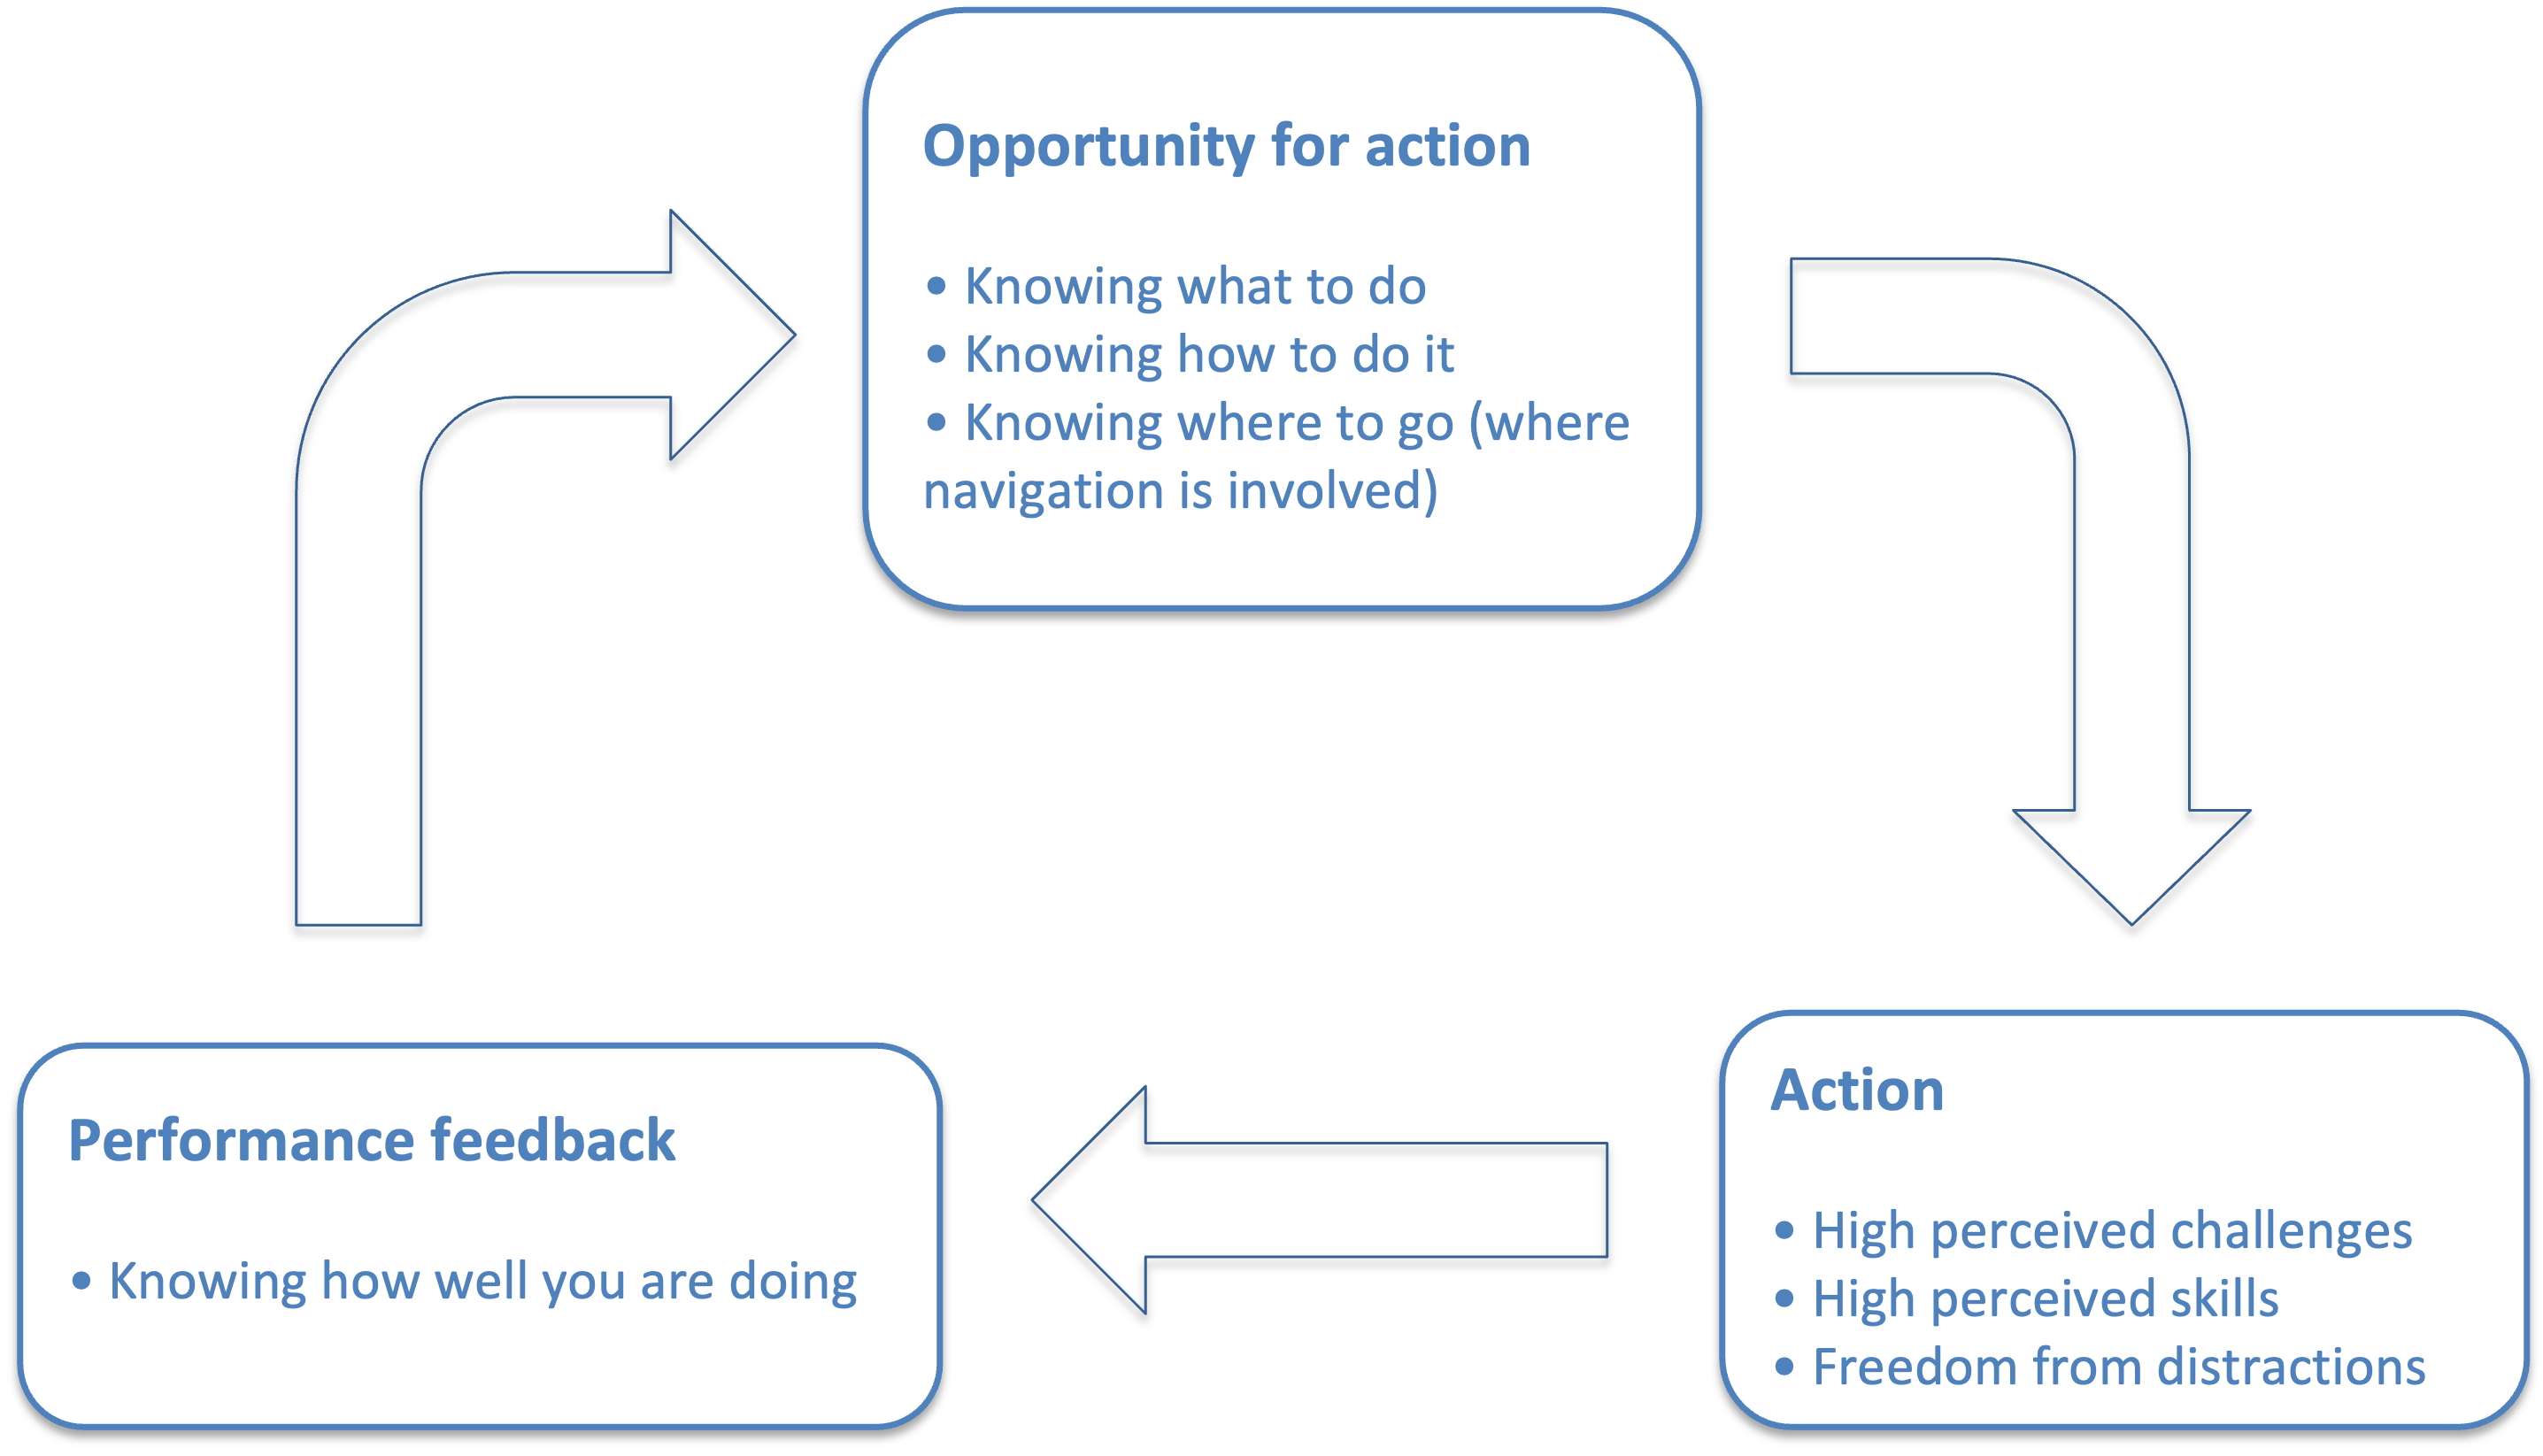
In order to have an opportunity to act, a developer needs to have a clear proximal goal[3]. This is not the overall goal of the activity, but rather a clear goal for the next step in the action sequence, and then the next, and so on, until the final goal is reached. The relationship between clear, attainable proximal goals and flow may be self-evident. If a developer does not know what to do next, they are less likely to enter a flow state. In order to have a clear and attainable proximal goal, a developer needs to:
- Know what to do
- Know how to do it
- Know where to go (where navigation is involved)
After the goal is established, the developer needs to subjectively evaluate if their capabilities are in balance with the work complexity. If that is the case, then there will be a balance between:
- High perceived challenges
- High perceived skills
To maintain the flow state, it's also important to provide the developer with an environment free from distractions. Additionally, we must ensure that the developer receives immediate feedback that allows them to continuously adjust their performance as they tackle these challenges. This kind of feedback communicates how well they are performing and how they can improve their performance.
By measuring how well policies and processes align with the flow conditions, we can establish a software development organization that promotes happiness among developers.
Quantifying happiness
In order to determine whether a developer was in a state of flow, it's essential to assess the balance between their perceived individual capabilities and the complexity of each task they worked on. This assessment demands precise and dependable information regarding both factors.
From a knowledge-centric perspective, we define the developer's perception of the complexity of the task as the "required knowledge." Similarly, we refer to the developer's perception of their individual capabilities as the "prior knowledge". Prior knowledge is known to facilitate the learning of new information. Estimates suggest that between 30% and 60% of the variance in learning outcomes can be explained by prior knowledge[11]. Additionally, prior knowledge of different domains can jointly support the recall of arguments[12].
The difference between the prior knowledge a developer possesses and the required knowledge needed to complete a task is what we term as the knowledge to be discovered, which we measure in bits of information.
Imagine a scale: on one side is the required knowledge and on the other is the prior knowledge. They will be balanced if they are equal, implying that the knowledge to be discovered equals zero bits. However, maintaining a state of flow requires a slight leaning towards challenging tasks, meaning the knowledge to be discovered should be one or two bits.
Therefore, even if we can't quantify the prior knowledge and required knowledge in bits of information, we can indeed express their difference in terms of bits of information.
To quantify this balance, we need to assess how a developer felt while working on a task. This is difficult, if not impossible, to achieve accurately as it involves tapping into the individual's cognitive process.
Alternatively, to ascertain if the developer's capability and the task complexity were balanced, we can measure the knowledge discovered after successful task completion. We can employ Knowledge Discovery Efficiency (KEDE) for this measurement, as explained in details here..
For instance, if the discovered knowledge is 1 bit, KEDE will be 50, and for 2 bits, KEDE will be 33. If KEDE approaches 100, then the discovered knowledge tends towards 0 bits, implying the developer may be experiencing boredom. Conversely, if KEDE approaches 0, the discovered knowledge will tend towards infinity, indicating the developer may be in a state of anxiety. These correlations are visually represented in the diagram below.

KEDE is calculated for each developer individually and signifies the knowledge that they lacked before beginning the task. A low KEDE score implies that the developer did not possess the requisite knowledge to tackle the task, while a high KEDE score suggests that the developer was adequately prepared.
Typically, values less than 50 point towards an imbalance leaning towards anxiety, indicative of overly challenging tasks. Conversely, values over 50 suggest an imbalance towards boredom, where tasks are not sufficiently challenging. An ideal state of Flow is indicated by a KEDE value of 50, representing a perfect balance.
Interestingly, KEDE measurements propose a somewhat counterintuitive relationship between efficiency and developer happiness. The most efficient developers, those who require less discovery of new knowledge, may also be the ones who are most prone to boredom.
To ensure practicality and clarity in our analysis, we won't use balance values within the range of [0,1], but rather, we'll express them as percentages, falling within the interval [0,100]. By doing so, we can effectively gauge the degree of balance achieved. For instance, if the balance function returns 0.4, we would express this as a balance of 40%, indicating that the state of balance achieved is 40% of the maximum possible balance or conversely, we are 60% off from achieving perfect balance. This adjustment allows us to more intuitively comprehend the balance status in relation to developer flow state.
More information about how KEDE measures this balance can be found Here. Real-world data on developer happiness is available here), and on project happiness here.
To practice measuring developer happiness, you can try the Knowledge Discovery Game. This game simulates the knowledge discovery process, enabling you to evaluate the balance between developer abilities and task complexity.
Practical examples of KEDE being used to measure happiness
Consider the time-series diagram below, which illustrates developer's happiness for a selected period across all projects.
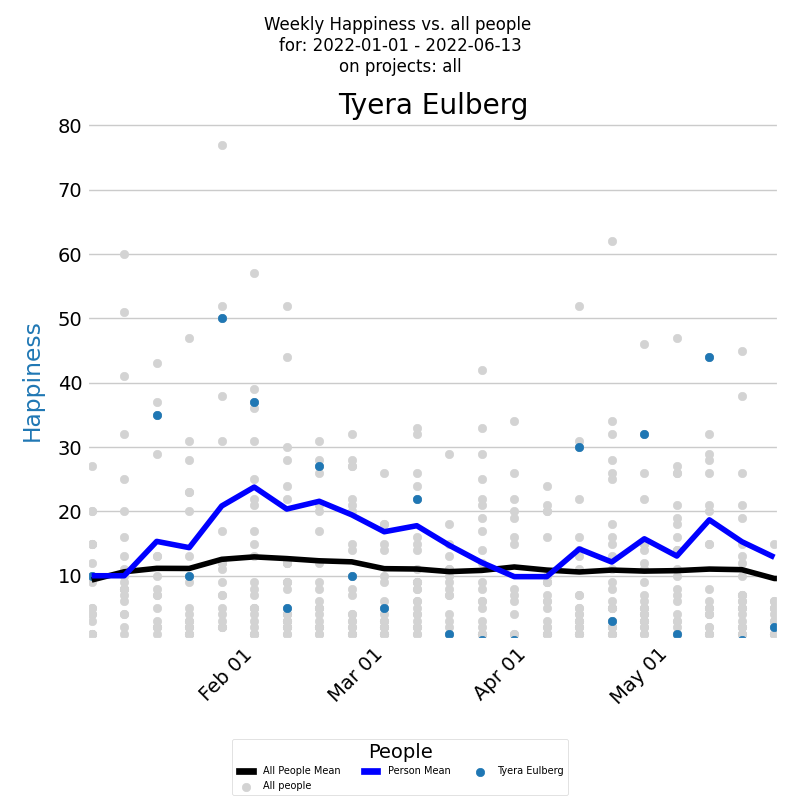
The x-axis of the diagram displays the dates of each week, while the y-axis shows the weekly happiness values. Each week's happiness level is represented by a blue dot on the diagram, giving you a clear visual representation of how the developer's happiness changes over time. Additionally, the dark blue line on the diagram represents the average weekly happiness for the developer, calculated using the Exponentially Weighted Moving Average (EWMA) method. By analyzing this line, you can gain a better understanding of the overall trend of the developer's happiness levels over time. But to gain a deeper understanding of a developer's happiness levels, it's important to compare them with the company averages. Each individual developer's weekly happiness is represented by a light gray dot, while the average weekly happiness calculated using EWMA is represented by a black line.
The time-series diagram reveals that the selected developer's average happiness levels consistently outpace the company's average, Interestingly, their happiness peaks at specific moments, ike a roller-coaster over time. Contrastingly, the company-wide data exposes a concerning pattern: a majority of developers experience their work in a state of anxiety, rather than happiness.
Along with the time series of the happiness it's very useful to see a histogram of weekly averaged happiness values, which displays the frequency distribution of happiness values over a selected period. The histogram below presents the weekly happiness values for a selected period, with the x-axis displaying the Weekly happiness and the y-axis showing the percentage of each particular value.
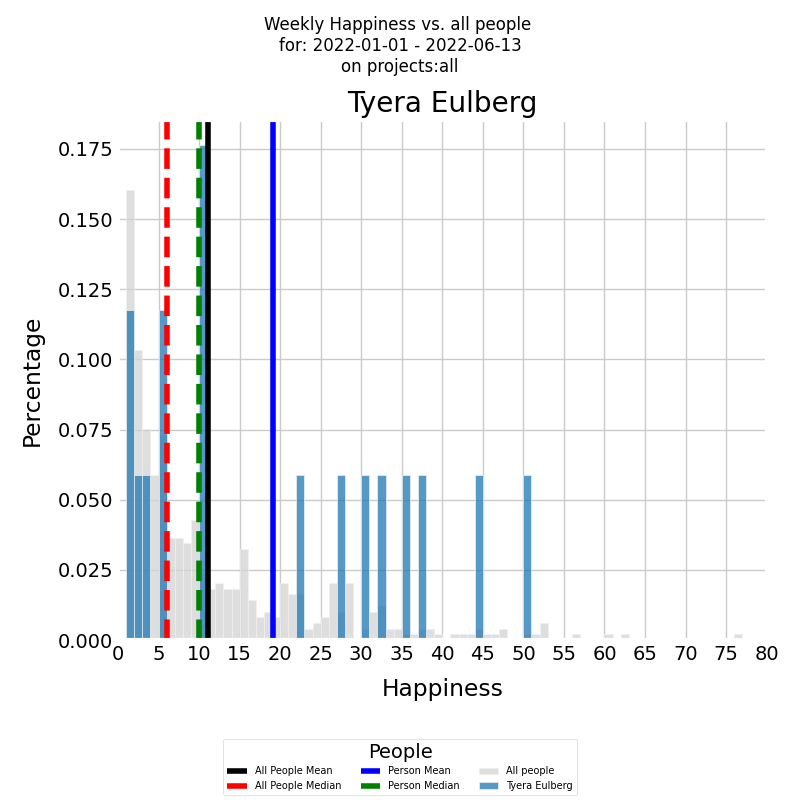
The histogram is presented in color for the developer, with the blue vertical line representing the average weekly happiness level for the selected period and the green vertical dashed line representing the median weekly happiness level. To gain a deeper understanding of the developer's happiness levels, it's important to compare them with the company averages. The same histogram can be generated for all other developers who contributed to all other company projects during the selected time period, with the histogram presented in gray. The black vertical line represents the average weekly happiness level for all other developers, while the red vertical dashed line represents the median weekly happiness level.
The diagram illustrates that the selected developer's average happiness levels are double the company's average. Interestingly, their happiness isn't concentrated at a single point but rather distributed uniformly across the spectrum. The company histogram, on the other hand, reveals a concerning pattern: most developers experience their work in a state of anxiety.
To gain insights into how a developer's mood is influenced by their work environment, we can examine the distribution of their happiness across different projects. The diagram below presents a stacked bar chart that allows you to look at numeric values across two categorical variables. The first category is the developer's weekly happiness, and the second category is the projects that the developer worked on during the selected time period. Each bar on the chart represents the weekly happiness of the selected developer, divided into a number of boxes, each one corresponding to the happiness that the developer felt on a particular project.
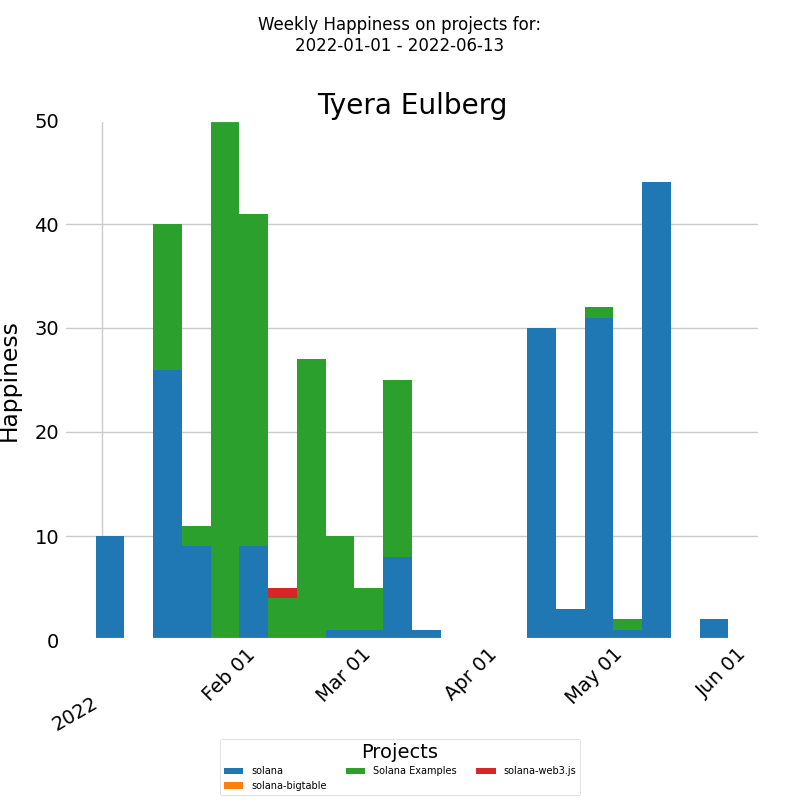
The x-axis of the chart displays the dates of each week, while the y-axis shows the weekly happiness levels. For this particular developer, their mood seems unaffected by the nature of the project, be it represented in green or blue. Thus, a holistic review of the entire company as a system may be necessary to identify patterns or trends impacting their happiness.
To address this, we suggest a two-pronged approach: First, investigate what factors contribute to the higher happiness levels of the selected developer and aim to replicate those conditions for the rest of the team to alleviate their anxiety. Secondly, identify periods when even the usually happy developer experienced anxiety, and work towards creating a more consistent and positive working environment. It's possible that addressing a single issue could alleviate both undesirable effects.
Works Cited
1. Csikszentmihalyi, M. 1990. Flow: the psychology of optimal experience. United States of America: Harper & Row.
2. Csikszentmihalyi, M 1975. Beyond Boredom and Anxiety: The Experience of Play in Work and Games. San Francisco: Jossey-Bass
3. Schaffer, O. 2013. Crafting Fun User Experiences: A Method to Facilitate Flow. Human Factors International Whitepaper. Retrieved from: https://scholar.google.com/scholar?cluster=9760324565241258858
4. Stamp, G. (1991), "WELLBEING AND STRESS AT WORK", Employee Counselling Today, Vol. 3 No. 3, pp. 3-9. https://doi.org/10.1108/13665629110140735
5. Csikszentmihalyi, M. & Csikszentmihalyi, I.S. (Eds) (1988). Optimal experience: Psychological studies of flow in consciousness. New York: Cambridge University.
6. Anderson, D.R., Crous, F. & Schepers, J.M. (1996). Flow and quality of work life in a diverse workforce. Journal of Industrial Psychology, 22 (3)13-20.
7. Lu, L. (1999). Work motivation, job stress and employees’ wellbeing. Journal of Applied Management Studies, 8 (11) 61-74.
8. Loubris, S., Crous, F & Schepers, J.M. (1995). Management by objectives in relation to optimal experience in the workplace. Journal of Industrial Psychology. 21 (2), 12-17.
9. Csikszentmihalyi, M. & Nakamura, J. (2010). Effortless Attention in Everyday Life: A Systematic Phenomenology . In Bruya, B. (Ed.), Effortless Attention. (pp. 179- 190). Cambridge, MA: MIT Press.
10. Keller, J., & Bless, H. 2008. Flow and regulatory compatibility: an experimental approach to the flow model of intrinsic motivation. Personality & Social Psychology Bulletin (34:2), pp. 196-209
11. Dochy, F., Segers, M., and Buehl, M. M. (1999). The relation between assessment practices and outcomes of studies: the case of research on prior knowledge. Rev. Educ. Res. 69, 145–186. doi: 10.3102/00346543069002145
12. Schmidt HK, Rothgangel M, Grube D. Prior knowledge in recalling arguments in bioethical dilemmas. Front Psychol. 2015 Sep 8;6:1292. doi: 10.3389/fpsyg.2015.01292. PMID: 26441702; PMCID: PMC4562264.
13. Keller J., Bless H., Blomann F., Kleinböhl D. Physiological aspects of flow experiences: Skills-demand-compatibility effects on heart rate variability and salivary cortisol. J. Exp. Soc. Psychol. 2011;47:849–852. doi: 10.1016/j.jesp.2011.02.004.
How to cite:
Bakardzhiev D.V. (2022) How to measure developer happiness? https://docs.kedehub.io/kede/kede-on-developer-happiness.html
Getting started


