In 1999 Peter Drucker published “Knowledge Worker Productivity: The Biggest
Challenge” where he claimed that:
“The most important, and indeed the truly unique, contribution of management in the 20th
century was the
fifty-fold increase in the productivity of the manual worker in manufacturing. The most
important
contribution management needs to make in the 21st century is similarly to increase the
productivity of
knowledge work and knowledge workers.”[2]
In order to achieve a fifty-fold increase in the productivity of knowledge
workers we need to
know two things: first, who are the knowledge workers and second, how to measure their
productivity?
According to Peter Drucker knowledge workers are those who possess, utilize and create valuable knowledge[3].
In his definition the knowledge worker is an executive who knows how to allocate knowledge to productive use, just as the capitalist knew how to allocate capital to productive use[4].
In knowledge work the workers' knowledge comprise the means of production.
The knowledge workers do not convert materials from one form to another, but convert knowledge from one form to another[24].
Now we can try to define productivity.
There are plenty of opinions on how to measure the productivity of knowledge workers, but no single approach is accepted as standard[24].
Some people measure the productivity of knowledge workers by the output per unit time.
Others measure knowledge workers by the effort put in producing the output e.g. time spent in value-added activities.
Yet others measure knowledge workers by the financial outcome produced by the output.
Each of those approaches accounts for some important facet of knowledge work.
However all of the approaches can actually be applied to manual work just as well!
That is because they don't account for what is unique to knowledge work only - its essence, which is the acquisition and application of knowledge.
As Drucker noted, productivity is the application of knowledge to work[4].
What is the problem with quantifying efficiency in acquisition and application of knowledge in an organization? In one word - measurement.
Indeed, it is very difficult to measure the efficiency in acquisition and application of knowledge for two reasons.
Firstly, because knowledge is invisible.
It is in people's brains, in books, in manuals, in working procedures, in files on hard disks, in short - everywhere.
When the organization invests in acquiring new talent or in training its current people it is a challenge to measure what they have got for the money.
Secondly, because acquiring knowledge is not enough.
Attention must be paid if the knowledge is actually applied?
If the knowledge is acquired but not fully utilized then the knowledge workers leave potential untapped.
Knowledge and knowledge discovery
"All knowledge is in response to a question.
If there were no question, there would be no scientific knowledge." ~ Gaston Bachelard, The Formation of the
Scientific Mind
In general, “knowledge” and “information” are vague terms. Here we will use the definitions
from the Information theory.
Let us consider a classic example: we have a coin hidden in one of 8 equal-sized boxes, as presented here.
The probability to find the coin in any specific box is 1/8.
In order to find the coin we are allowed to ask questions with "Yes" or "No" answers (binary questions).
If an answer to a binary question allows us to exclude some of the possible locations of the
coin then we say that we acquired some “information”.
If the question allows us to exclude 50% of the possible locations we say that we acquired 1 bit of information.
Knowledge of coin location means we know it with certainty i.e. with a probability of 100%.
The amount of missing information H is zero, if we know that one specific event has occurred i.e.
if we need zero questions to ask.
“Missing information” is defined by the Information Theory introduced by Claude Shannon[1].
“Missing information” is the average number of binary “Yes/No” questions we need to ask
in order to gain
the knowledge of the coin location.
Increase in H means decrease in knowledge.
We can express the amount of missing information H in terms of the distribution of
probabilities.
In this example, the distribution is: {1/8, 1/8, 1/8, 1/8, 1/8, 1/8, 1/8, 1/8} because we
have 8 boxes with
equal sizes.
For calculating H we use Shannon's formula[1].
In a formal mathematical notation, the Shannon entropy H(X) of a discrete random variable X with possible values {x1, x2, ..., xn} and a probability mass function P(X) is:
where n is the number of boxes, P is the probability to find the coin in
each box.
We will use the interpretation of H as the amount of missing information,
as explained in detail here.
The amount of missing information H in a given distribution of
probabilities (p1, p2,...pn)
is an objective quantity.
H is independent of the strategy we choose of asking questions i.e.
to acquire it.
In other words, the same amount of information is there to be obtained regardless
of the way or the number of questions we use to acquire it.
H depends only on the number of boxes and their size.
The bigger the number of boxes, the bigger the average number of questions we need to ask in
order to find the coin.
The choice of strategy allows us to acquire the same amount of information by less or more
than the average number of questions.
The optimal strategy guarantees that we will get all the missing information by the average
number of questions.
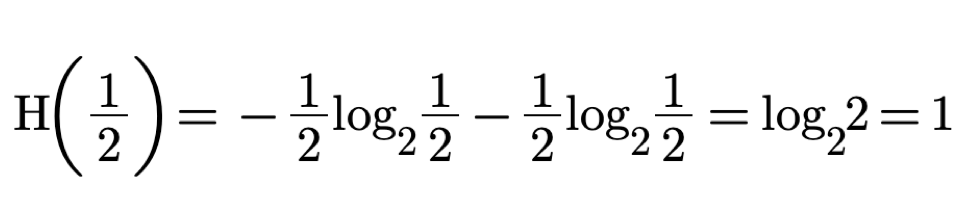
In the case of 2 boxes we will need to ask only one question. The value of the missing
information H in this case is one. as calculated below:
With p equals 1/2 we acquire exactly 1 bit of information.
Knowledge discovery
So far, we have applied the Shannon formula to cases where the object to be found is known in advance.
By asking binary questions of one bit each, we have been able to locate the hidden object.
However, in the reality of knowledge work, the "it" is not always known in advance.
For example, in the popular “20-questions” game., the object is only revealed through a process of questioning.
In the case of a software developer, the "it" to be delivered may be a software program.
In this scenario, the developer must acquire missing information from a variety of sources, including the business's requirements and user manuals on the technology to be used.
Ideally, each question brings back a bit of information, and the developer must maintain a coherent understanding of all the answers received.
Knowledge is discovered through a process of questioning and collaboration among all participants.
John Wheeler coined the phrase "it from bit", which symbolizes the idea that every item in the physical world has knowledge as its immaterial source and explanation[10].
According to this concept, reality arises from the posing of binary "yes/no" questions, as elaborated on here.
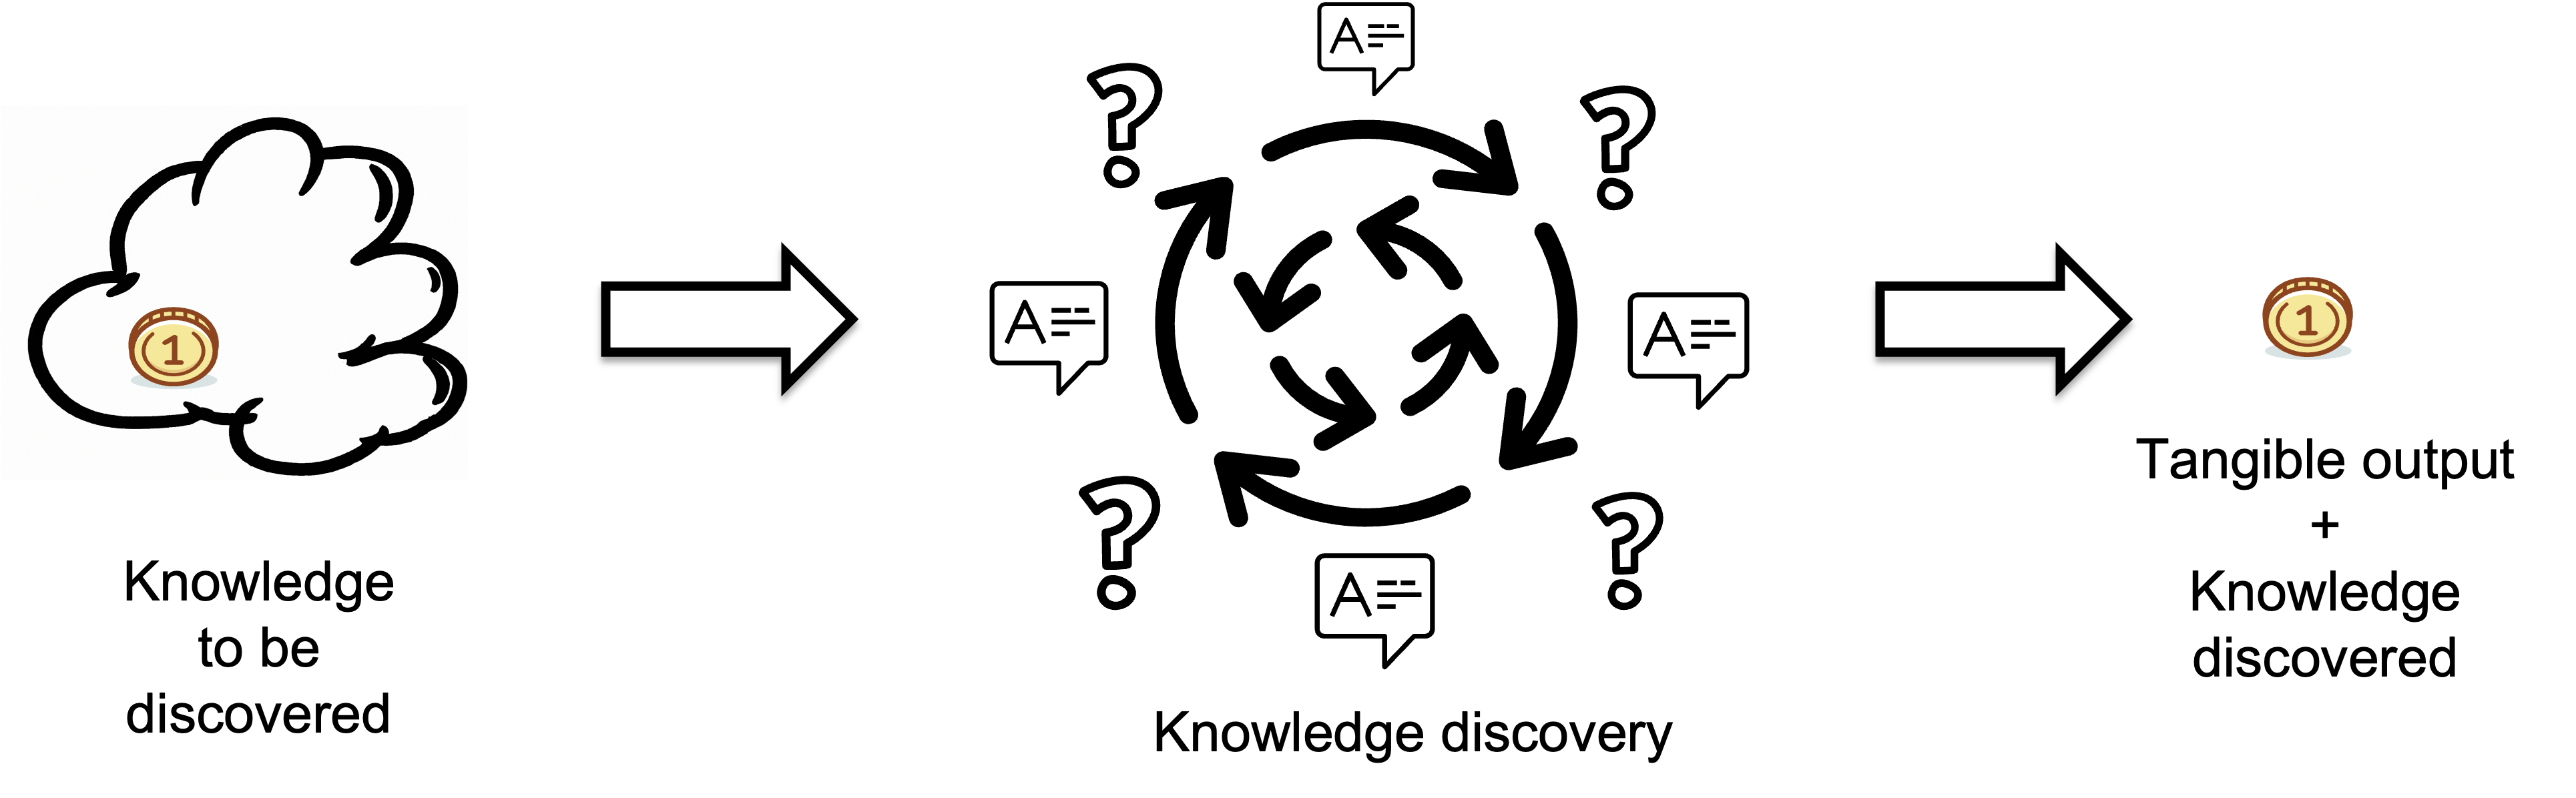
Knowledge discovery takes some knowledge to be discovered as input, or in other words, "how much you need to know."
We consider knowledge discovery as a black box,
and we don't know how it produces tangible output in response to input questions.
This knowledge is always real, as we have seen in both the “20-questions” and “Surprise 20 questions” games.
However, the knowledge that needs to be discovered is not always known in advance.
As we have seen from the concept of "it from bit" it's not always possible to know in advance the prior knowledge or the knowledge required for a task.
What we can do is quantify the knowledge discovered after the task has been completed.
Knowledge discovery process
Work comprises cognitive and manual labor.
Manual labor involves physical effort to produce tangible results, while cognitive labor requires thinking and decision-making to address the essential questions of "what," "how," and "why" a task is performed.[2]:
What needs to be done?
How should it be done?
Why is it being done?
Each of these questions can be broken down into increasingly detailed sub-questions.
This process continues until a clear understanding is reached, enabling the individual to proceed with manual labor.
Importantly, cognitive labor always precedes manual labor because tasks require planning, decision-making, or problem-solving before execution.
For each task, Required Knowledge represents the complexity of the task, i.e. what must be known to complete it,
while Prior Knowledge refers to the skills, experience, and understanding an individual already possesses.
The gap between these two is the Knowledge to Be Discovered.
It represents what the individual thinks they don't know, given what they think they do know.
Any uncertainty or need for additional clarity about a task implies the existence of some form of a knowledge gap - even if it is small or subtle.
Knowledge work is the cognitive effort required to bridge the gap between prior knowledge and required knowledge to complete a task effectively.
Questions are the cognitive tools we use to close knowledge gaps.
Questions arise only when there is Knowledge to Be Discovered.
The existence of any question implies a perceived gap in knowledge, understanding, or certainty.
Whether the gap is large (fundamental knowledge is missing) or small (details need confirmation or alternatives are being explored),
the act of questioning reflects the Knowledge work i.e. the effort to bridge that gap.
Conversely, if an individual believes they know everything necessary about a task, there is no uncertainty, and no questions arise.
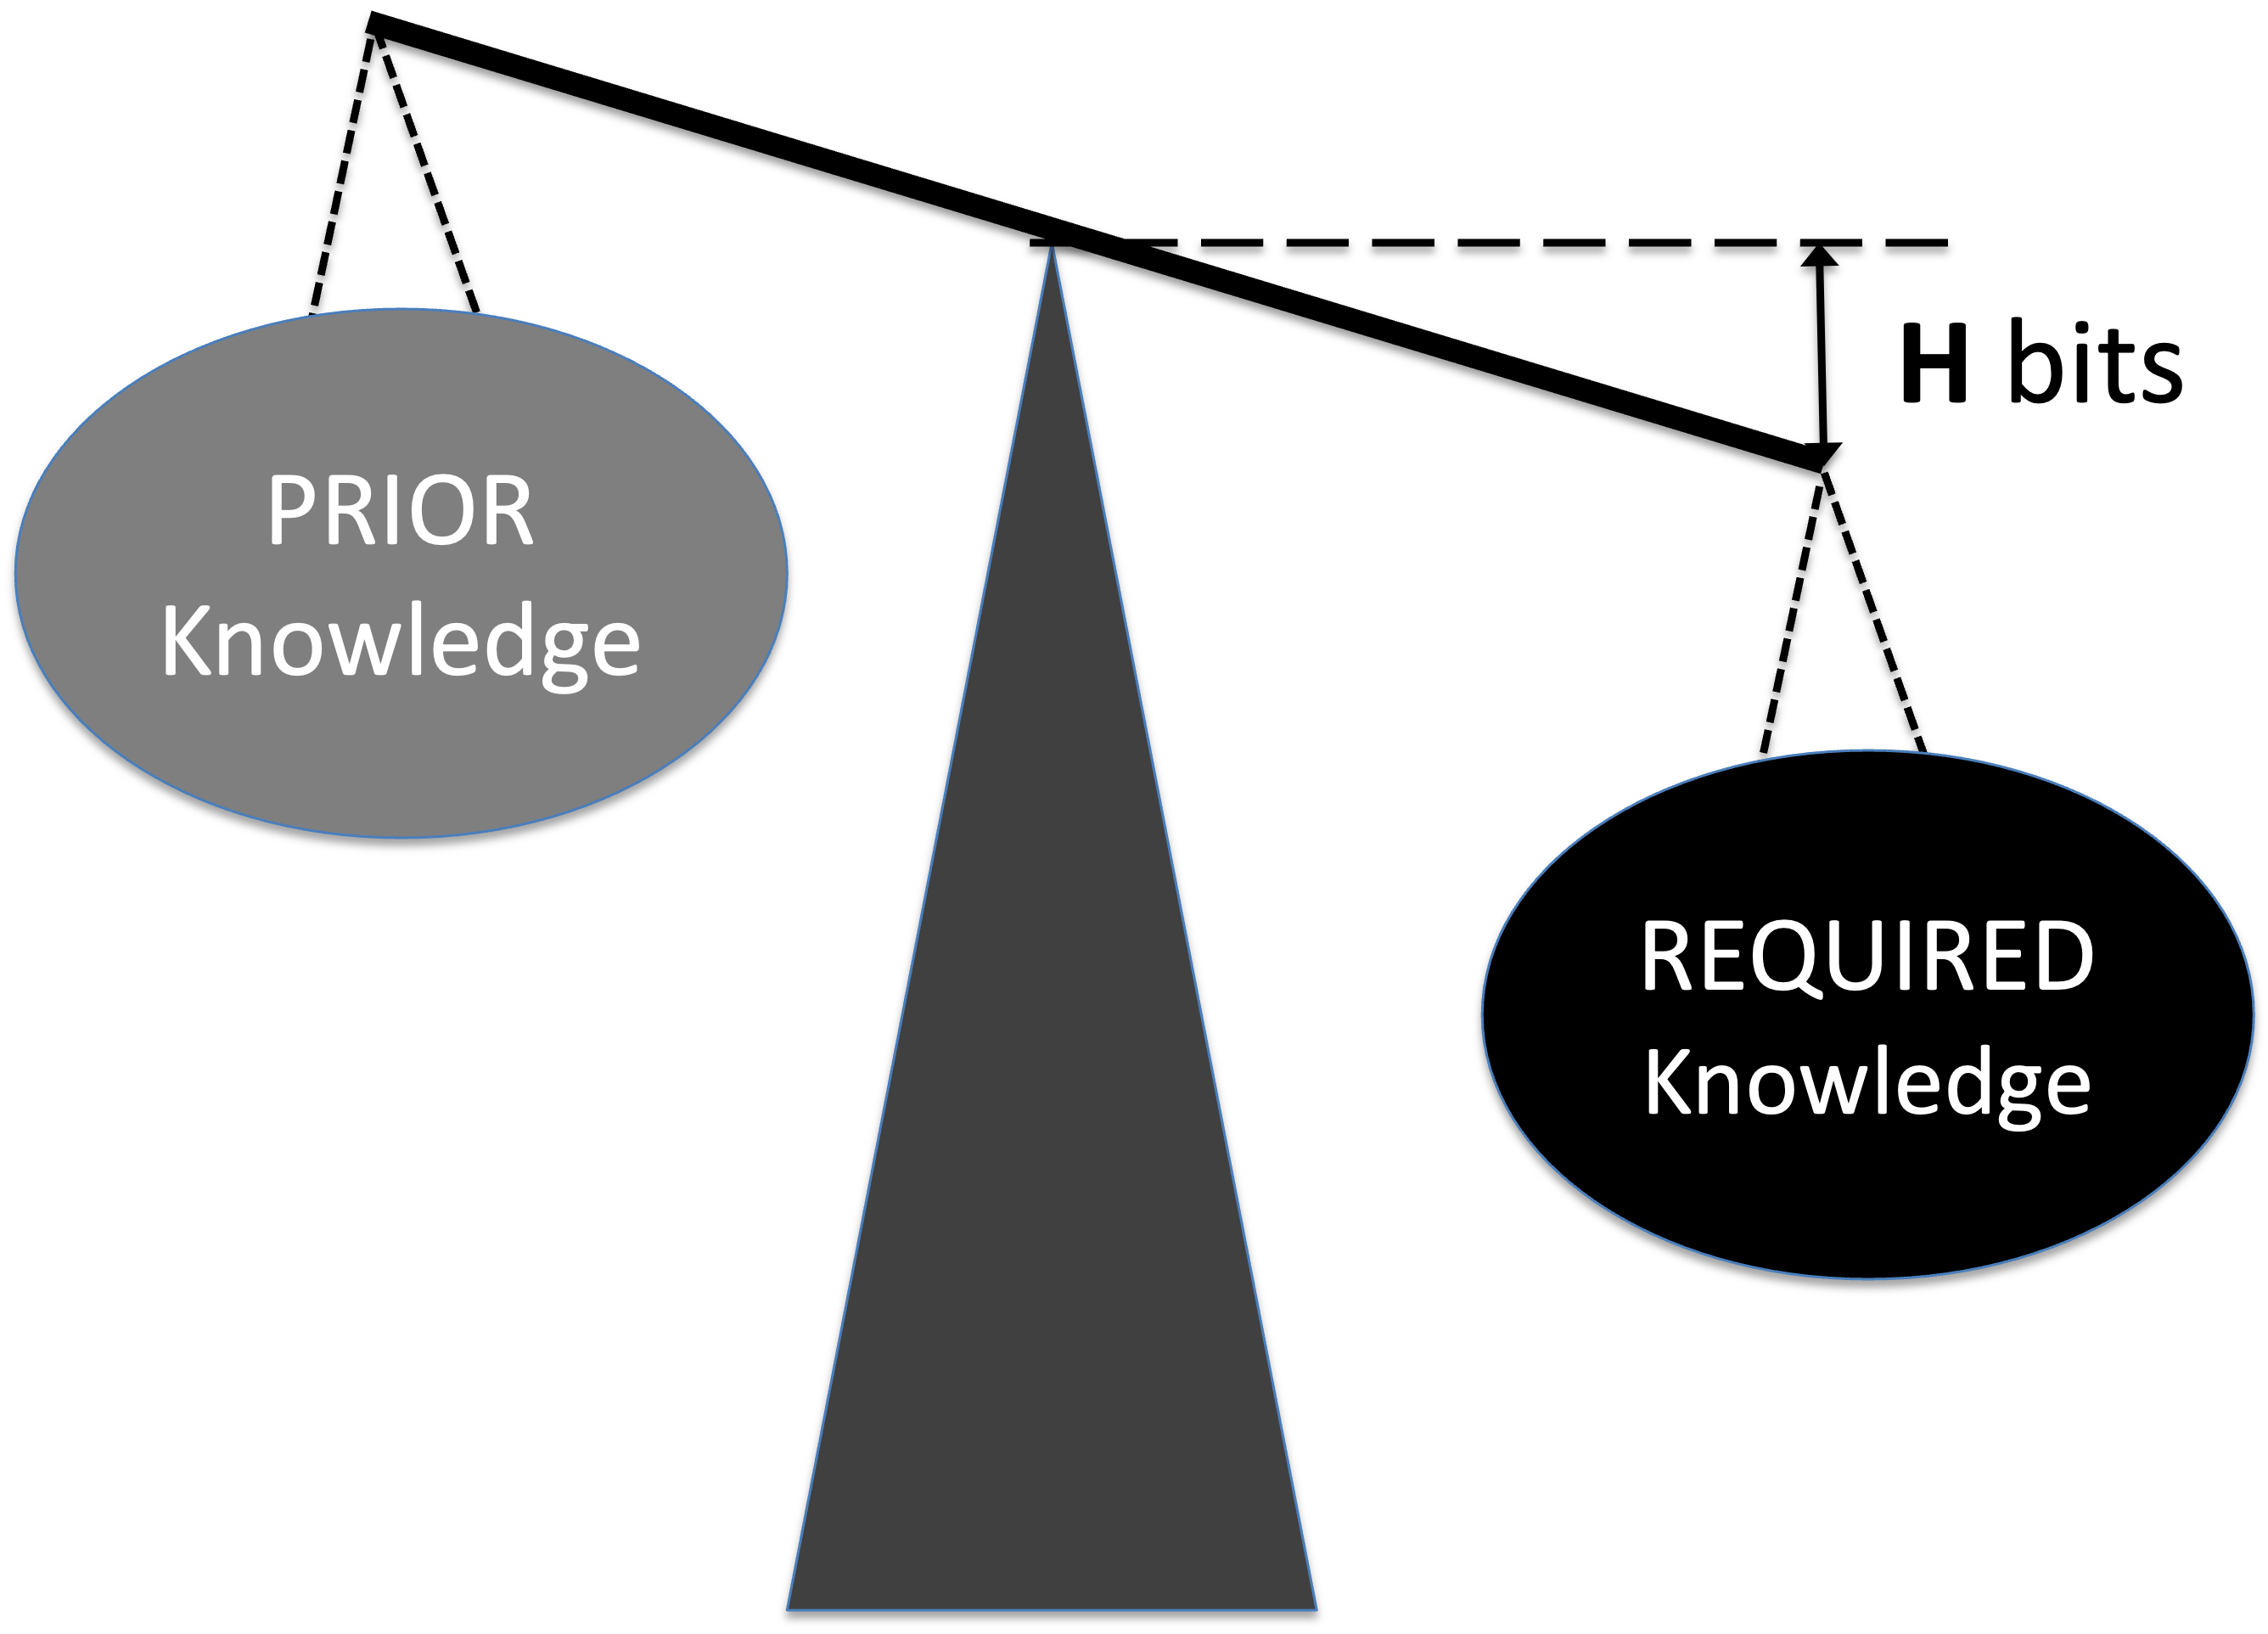
Imagine a scale: on one side is the required knowledge and on the other is the prior knowledge.
They will be balanced if they are equal, implying that the knowledge to be discovered equals zero.
When balanced, no further knowledge is needed; when imbalanced, knowledge acquisition is required.
The gap H between required and prior knowledge is the Knowledge to Be Discovered.
To measure knowledge, we interpret knowledge through the perspective of information theory.
The complexity of a task, as perceived by an individual, is defined as the "required knowledge" or total unconditional missing information H(X),
An individual's perceived capabilities, or "prior knowledge" is defined as the mutual information I(X:Y).
The "knowledge to be discovered"
is the conditional information H(X|Y) - what the individual lacks about the task before starting it.
The knowledge to be discovered H(X|Y) is what an individual thinks they don't know, given what they think they do know.
A Knowledge Discovery Process transforms invisible knowledge into visible, tangible output.
To learn more about it, please refer to this article.
The quality of the output is assumed to meet target standards.
Inputs represent the knowledge individuals lack before starting a task
i.e. the missing information or knowledge that needs to be discovered,
which is measured in bits.
Below is an animated example of calculating Knowledge Discovered when we search for a gold coin hidden in 1 of 64 boxes.
In all six cases, the required knowledge is 6 bits.
This means that, on average, we need to ask six binary questions to find the gold coin.
You can see that the knowledge to be discovered reflects the difference between the required knowledge and the prior knowledge.
The distinction between knowledge to be discovered and knowledge discovered is
that the former is subjective and conditional,
while the latter is objective and real.
Knowledge is a dynamic construct shaped by human inquiry, creativity, and interaction.
It evolves through the systematic refinement of conjectures and the elimination of errors, evolving toward greater understanding.
To measure knowledge, we interpret knowledge through the perspective of information theory.
This means that we interpret knowledge through the perspective of information theory.
In the table below, we have related human terms to concepts from information theory.
The first column of the table lists various subjective elements from both human and information theory perspectives.
The second column of the table contains knowledge discovered,
which is the information that can be observed and verified through objective reality.
We can measure knowledge discovered (or the information gained) by counting the number of questions asked.
Example of a Human Knowledge Discovery Process
Let's use an example to see how we can infer the number of questions in practice.
For that we'll have myself executing the task of typing on a keyboard the word
“Honorificabilitudinitatibus”.
It means “the state of being able to achieve honours” and is mentioned by Costard in Act V,
Scene I of
William Shakespeare's “Love's Labour's Lost”.
With its 27 letters “Honorificabilitudinitatibus” is the longest word in the English
language featuring only
alternating consonants and vowels.
The way I will execute this task is to go to the "play text" or "script"
of “Love's
Labour's Lost”, look up the word and type it down.
The manual part of the task is to type 27 letters.
The knowledge part of the task is to know which are those 27 letters.
In order to track the knowledge discovery process I will put "1" for each time interval when
I have a letter
typed and "0" for each time interval when I don't know what letter to type.
I start by taking a good look at the word “Honorificabilitudinitatibus” in the script of
“Love's Labours
Lost”.
That takes me two time intervals. Then I type the first letters “H”, “o”, and “n”.I continue
typing letter
after letter: “o”, “r”. At this point I cannot recall the next letter What should I do? I
am missing
information so I go and open up the script of “Love's Labours Lost” and I look up the word
again.
Now I know what the next letter to type is but acquiring that information took me one time
interval.
This time I have remembered more letters so I am able to type “i”,”f”,”i”,”c”,”a”,”b”,”i”.
Then again I cannot continue because I have forgotten what were the next letters of the
word, so I have to
look it up again.in the script.
That takes two more time intervals. Now I can continue my typing of “l”,”i”,”t”.
At this point I stop again because I am not sure what were the next letters to type, so I
have to think
about it.
That takes one time interval. I continue my typing with “u”,”d”,”i”.
Then I stop again because I have again forgotten what were the next letters to type, so I
have to look it up
again in the script of “Love's Labours Lost”.
That takes two more time intervals. Now I know what the next letter to type is so I can
continue typing
“n”,”i”.At this point I cannot recall the next letter. so I have to look it up again in the
script
That takes two more time intervals. After I know what the next letter to type is I can
continue typing
“t”,”a”,”t”,”i”,”b”,”u”,”s”.
Eventually I am done!
At the end of the exercise I have the word “Honorificabilitudinitatibus” typed and along with
it a sequence
of zeros and ones.
H
o
n
o
r
i
f
i
c
a
b
i
l
i
t
u
d
i
n
i
t
a
t
i
b
u
s
0
0
1
1
1
1
1
0
1
1
1
1
1
1
1
0
0
1
1
1
0
1
1
1
0
0
1
1
0
0
1
1
1
1
1
1
1
In the table we have separated the manual work of typing from the knowledge work of thinking about what to type.
We made visible both the manual work and the knowledge discovery parts of a Knowledge Discovery process.
The first row of the table shows the knowledge I manually transformed into tangible output
- in this case the longest English word.
The second row of the table shows the way I discovered that knowledge.
There is a "0" for each time interval when I was missing information about what to type next.
There is "1" for each time interval when I had prior knowledge about what to type next.
Each "0" represents a question I needed to ask in order to acquire the missing information about what letter to type next.
Each "1" represents prior knowledge.
We know that there is knowledge applied when we see the tangible output of the process.
We know there was knowledge discovered when we see there was at least one question asked.
In the exercise above we witnessed the discovery and transformation of invisible knowledge into visible
tangible output.
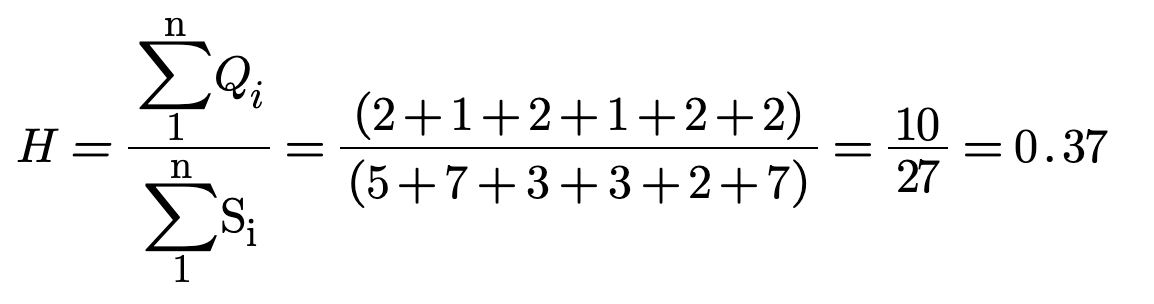
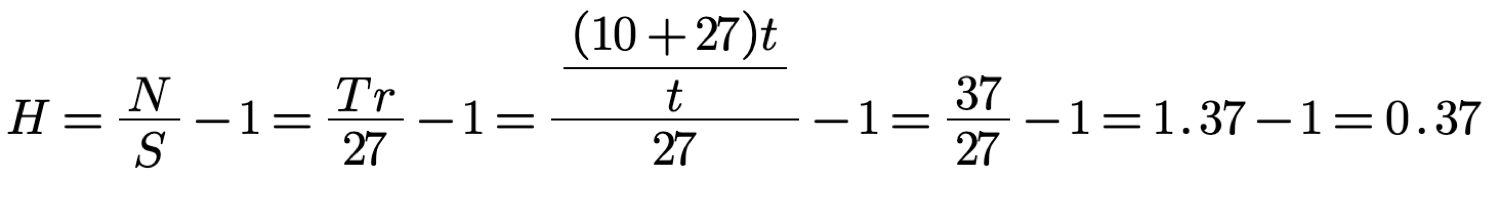
We can also calculate the knowledge discovered by dividing the total number of questions asked by the total number of letters typed.
Here H = 10/27 = 0.37 questions per symbol or 0.37 bits of information.
Software Development as Knowledge Discovery Process
"The completion of a mental activity requires two types of input to the corresponding structure:
an information input specific to that structure, and a non-specific input, which may be variously labeled “effort,” “capacity,” or “attention.”
To explain man's limited ability to carry out multiple activities at the same time,
a capacity theory assumes that the total amount of attention which can be deployed at any time is limited.." ~ Daniel Kahneman [19]
Knowledge is invisible, but as Drucker noted that a very large number of knowledge workers do both knowledge work and manual work[2].
He called those
people “technologists” and stated they may be the single biggest group of knowledge workers.
As examples for technologists Drucker provided surgeons, office clerks and dentists[2].
The first example I
could think of are the IT jobs in general and software developers in particular.
Manual work results in tangible output which is visible.
That makes the manual part of knowledge work visible.
Importantly the tangible output shows that the knowledge was actually applied.
That helps us to define what is a knowledge worker.
The key word here is 'knowledge,' particularly the knowledge workers lacked before starting a task—the knowledge they needed to gather to successfully complete it.
This distinguishes 'manual' workers from 'knowledge' workers. For manual workers, much of the required knowledge is built into the machines they operate and the detailed procedures they follow. Conversely, knowledge workers need to engage in extensive knowledge acquisition as their tasks often demand a higher degree of problem-solving, and innovation.
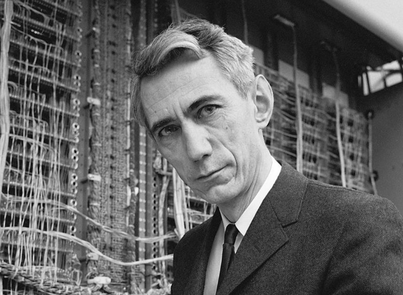
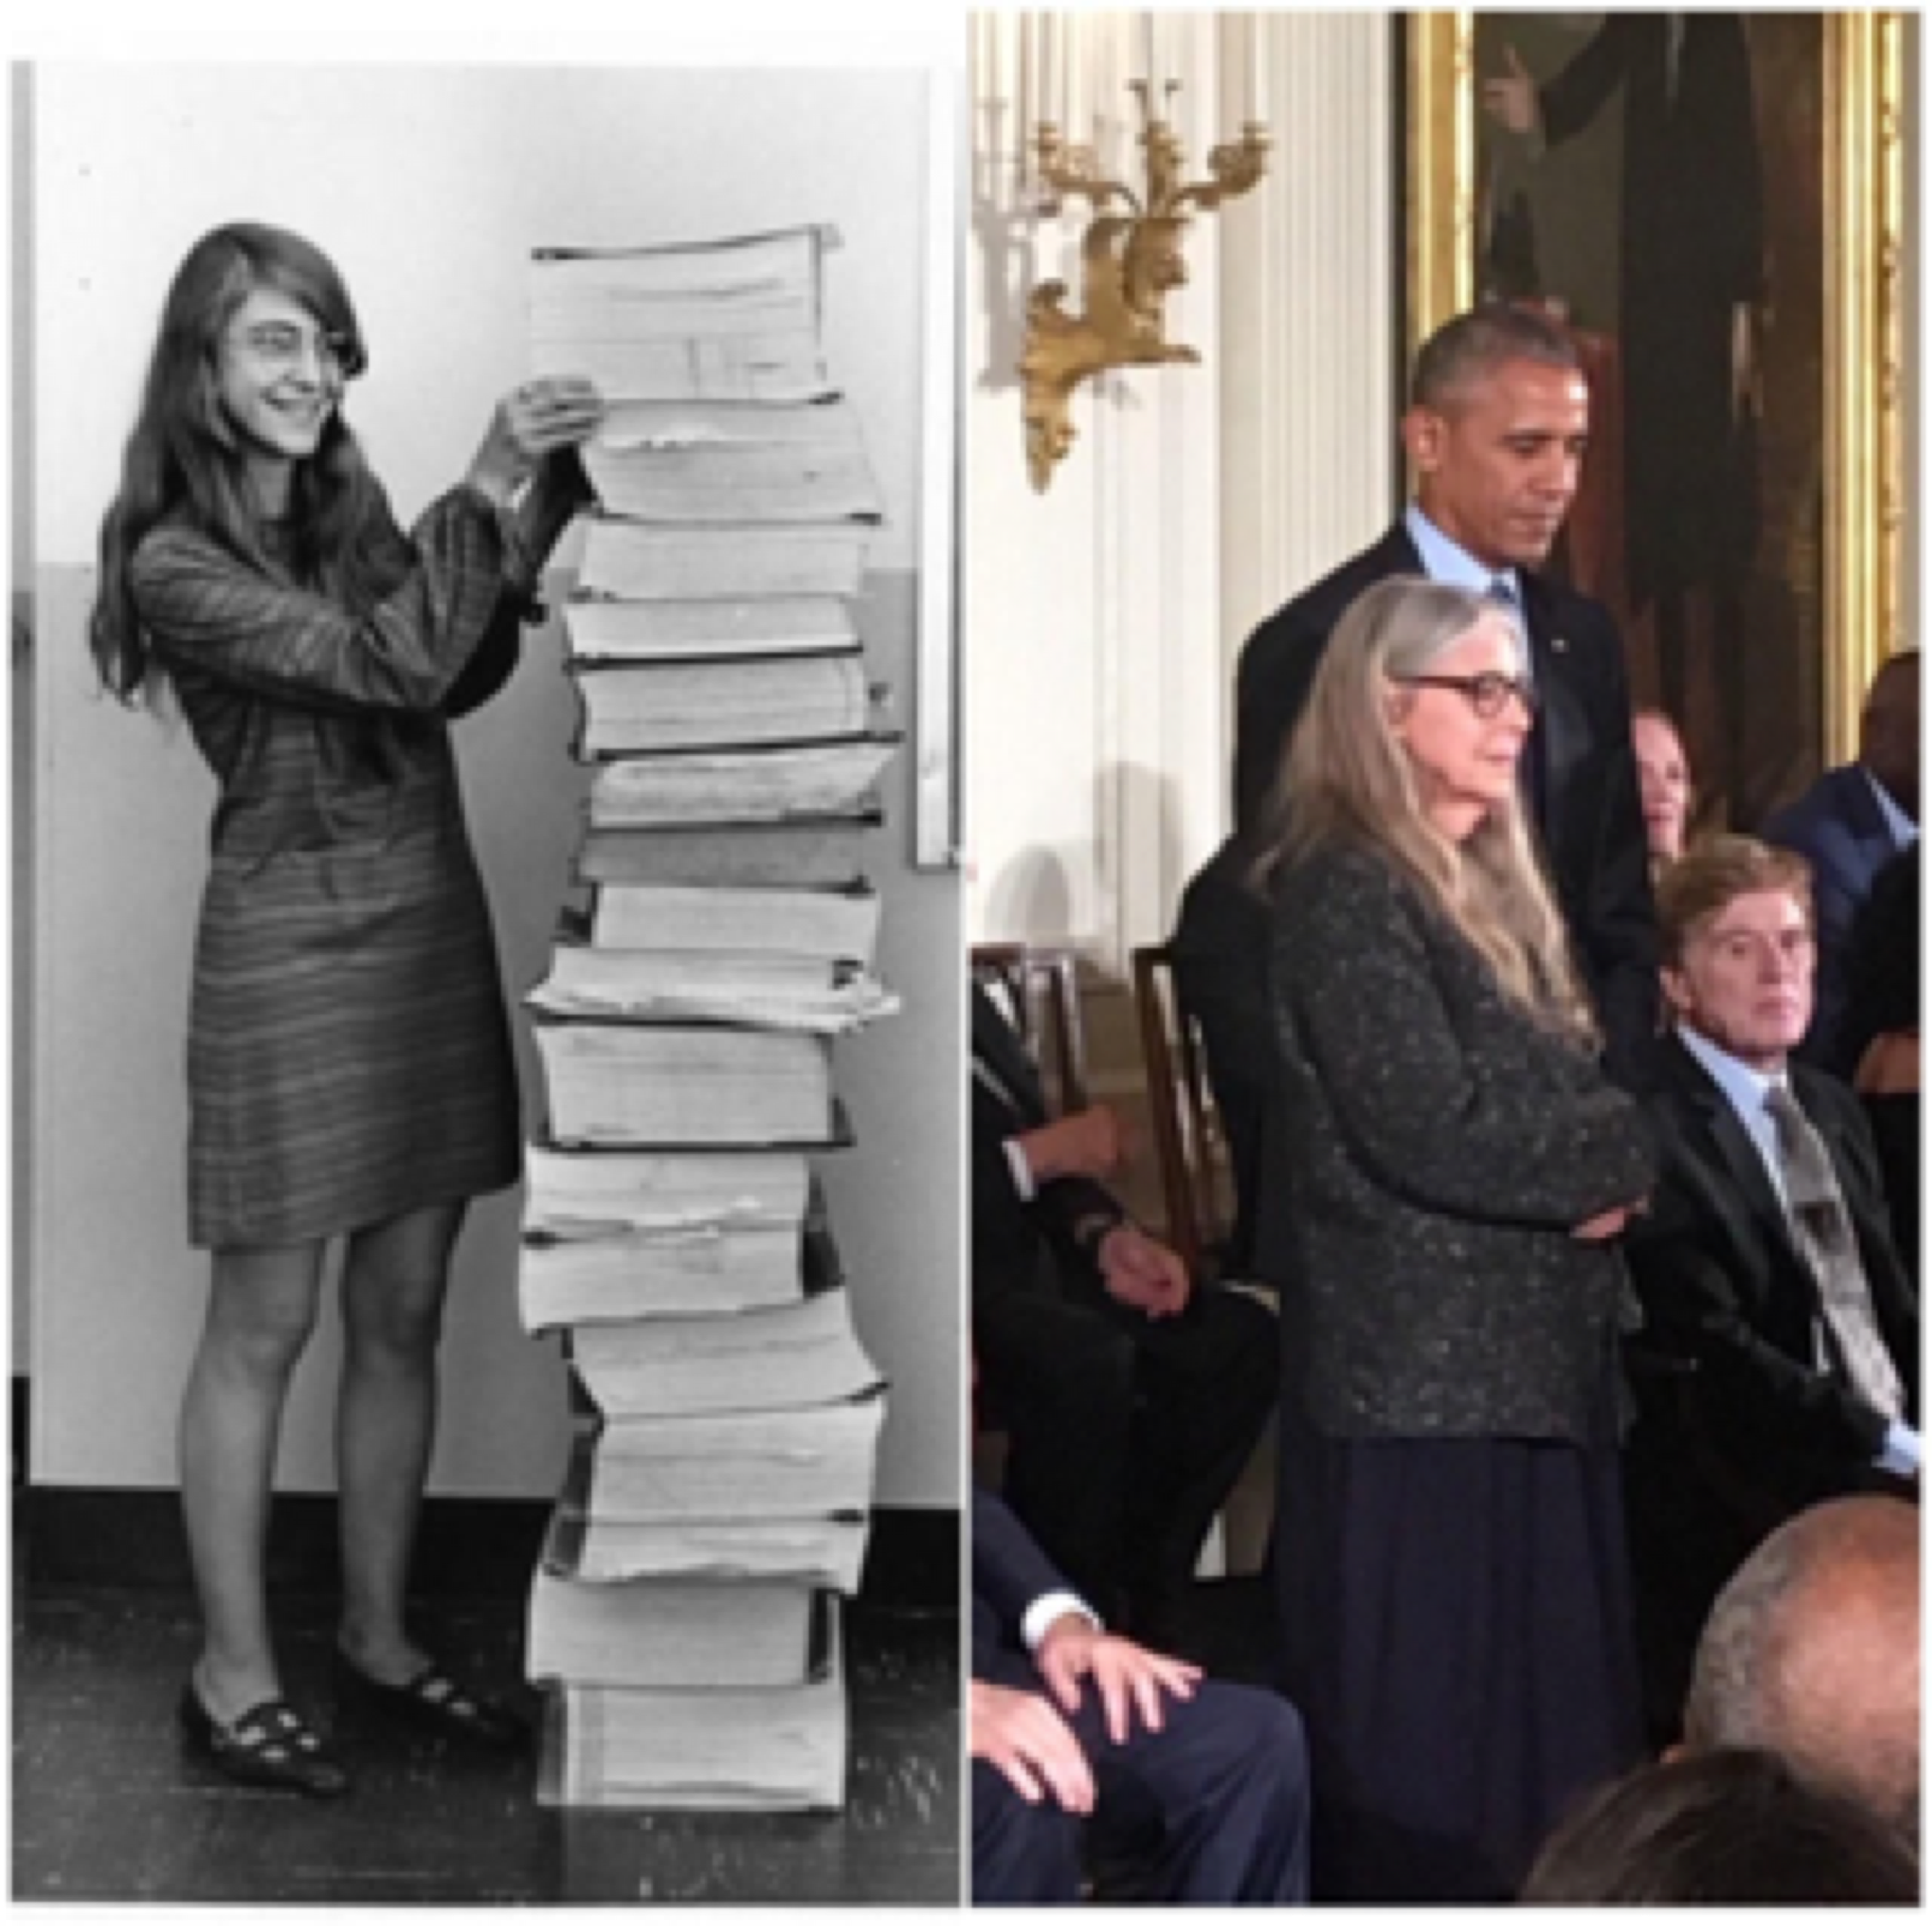
In the picture below to the right we have Margaret Hamilton, whose code saved the Moon landing space mission of Apollo 11 in 1969, being awarded the Presidential Medal of Freedom by President Obama.
On the picture to the left we have Margaret standing next to part of the computer code she and her team developed for the Moon landing.
What we witness is an example of the manual part of the knowledge work.
The software developers had to type all of those pages manually.
All the knowledge went from their brains, through their fingers and ended up as symbols on sheets of paper.
The difficult and time consuming activity in creating Moon landing software was not in typing their
already-available knowledge into source code.
It was in effectively acquiring knowledge they did not already have i.e. getting answers to the questions they already had.
Even more specifically, it was in discovering the knowledge necessary to make the system work that they did not know they were missing.
The symbols are the tangible output of their knowledge work.
The symbols are not the knowledge itself, but the trace of the knowledge left on the paper.
Knowledge workers are those who need to discover knowledge in order to produce tangible output.
We can turn to physics for an analogy.
A quantum (plural: quanta) is the smallest discrete unit of a physical phenomenon.
For example, a quantum of light is a photon, and a quantum of electricity is an electron.
A quantum of the tangible output of software development is a symbol contributed.
The tangible output represents the knowledge discovered through the knowledge discovery process,
encapsulating the new information that has been acquired.
We do not address the question of the quality of the tangible output, assuming that it meets appropriate standards.
There is no requirement for the tangible output to be symbols of source code contributed via a keyboard.
The way we calculate information rate, is based on behavior output.
Our method of looking only at behavioral endpoints (i.e., task-specific tangible or motor outputs) and intentionally overlooks the sequence of actions leading up to them.
Let's take as an example the case when we have bought furniture and need to assemble it.
We need to read the instructions and discover how to use the tools to assemble the parts into a tangible output in the form of a piece of furniture.
Here the quantum of tangible output is a tightened screw.
When people assemble furniture they do knowledge work.
Knowledge workers do knowledge discovery processes.
A knowledge discovery process consists of asking questions in order to gain the missing information H about "What" tangible output to produce and "How" to produce it.
Knowledge Discovery Process is the discovery and transformation of invisible knowledge into visible tangible output.
In the case of knowledge discovery we are not able to calculate the amount of missing information H the
way we did it with the gold coin ,
because there is no way to know
the number of boxes n and the size of each box pi.
In real life knowledge discovery is a constant stream of questions asked and answers received.
The number of boxes, their size and what's hidden in them constantly fluctuates based on the
answers received.
Each question may enlarge or shrink the set of possibilities.
That is why in knowledge work we cannot apply the Shannon's formula and calculate the missing information H.
We need to measure H by counting the number of questions asked by the knowledge worker.
For that we will turn to Psychology where they study mental effort and cognitive load.
Fortunately, there is scientific research that can help!
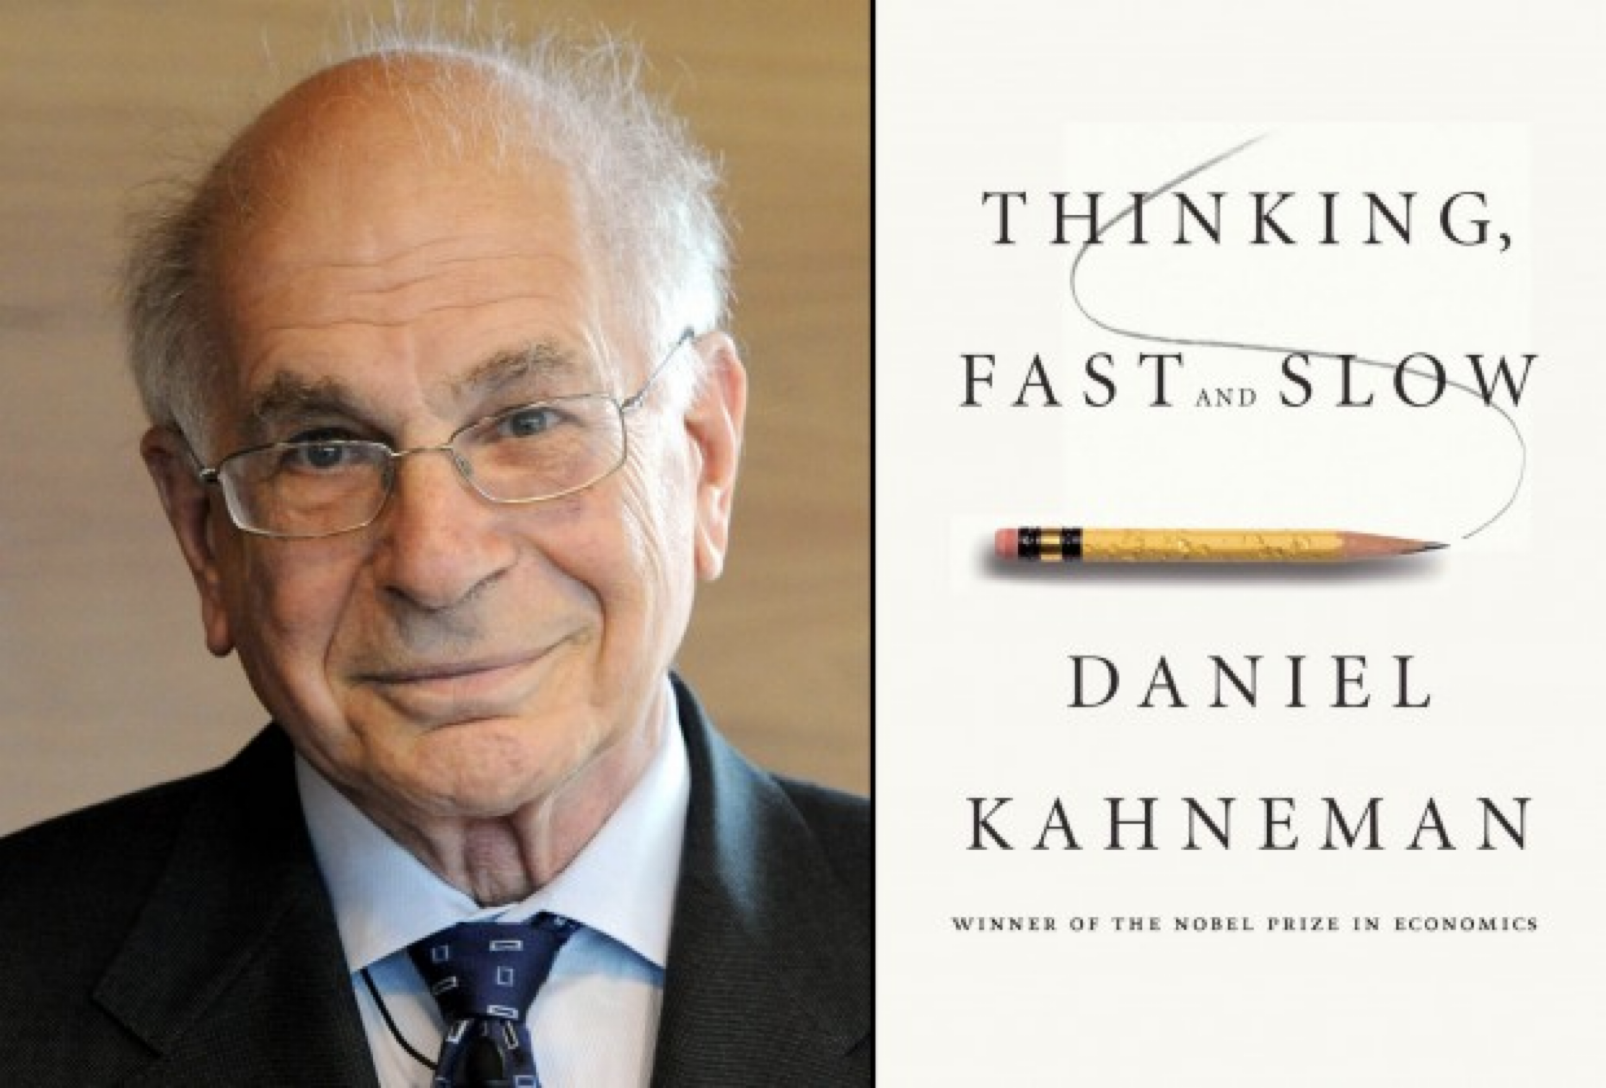
It was done by Daniel Kahneman, who was awarded the 2002 Nobel Memorial Prize in Economic Sciences, for his work on the psychology of judgment and decision-making.
In the 1970s Kahneman discovered that mental effort is a volitional, intentional process, something that organisms apply, and as such,
it corresponds to what organisms are actively doing and not to what is passively happening to them[19].
Different mental activities impose different demands on the limited cognitive capacity.
An easy task demands little mental effort, and a difficult task demands much.
Because the total quantity of mental effort which can be exerted at any time is limited,
concurrent activities which require attention tend to interfere with one another.
Human capacity to perform concurrent perceptual tasks is limited.
Easy tasks can be performed together with little interference, but more difficult tasks cannot.
An even distribution of attention among concurrent activities is possible only at a low level of total mental effort.
When total effort is high, one of the activities typically draws most of the attention, leaving little for the others.
This suggestion implies that attention is divisible at low levels and more nearly unitary at high levels of effort[19].
As humans become skilled in a task, its demand for energy diminishes.
The pattern of activity associated with an action changes as skill increases, with fewer brain regions involved.
Talent has similar effects.
Highly intelligent individuals need less effort to solve the same problems.
The knowledge is stored in memory and accessed without intention and without mental effort[18].
Asking questions is an effortful task and humans cannot type at the same time[19,25].
Since humans can either type or ask a question then we conclude:
If there was a symbol NOT typed then there was a question asked.
That means the question rate equals the symbol rate.
Now we have a means to infer the number of questions asked during a knowledge discovery process.
KEDE definition
Can we define a measure of how efficient a given knowledge discovery process is?
It is reasonable to expect such a measure to have the following properties:
It should be a function of the missing information H
Its maximum value should correspond to H equals zero i.e. there
is no need to ask questions, all knowledge is already discovered.
Its minimum value should correspond to H equals Infinity i.e. we have no knowledge to start with.
It should be continuous in the closed interval of
[0,1].
This makes it very useful to be used as a percentage.
This is because we need to be able to rank knowledge discovery processes by efficiency.
The best ranked knowledge discovery process will have 100% and the worst 0%.
That is practical and people are used to having such a scale.
It should be anchored to a natural constraint and thus support comparisons across settings and applications
It should be calculated per time period e.g. daily, weekly, quarterly, yearly
It should infer H solely from observable quantities of the tangible output we can measure
To capture all of that we introduce a new metric named KEDE.
KEDE is an acronym for KnowledgEDiscovery Efficiency.
It is pronounced [ki:d].
KEDE effectively converts the knowledge to be discovered H(X|Y), which can range from 0 to infinity, into a bounded scale between 0 and 1.
KEDE is inversely proportional on the knowledge discovered
i.e. on the difference between knowledge required by a task and the prior knowledge of a person.
In an extreme case, if the prior knowledge is a single unit, like the answer to a problem,
the answer can be used to bypass cognitive processing of the problem.
The net effect will be to allow the expert to reduce the use of cognitive capacity,
as compared to a novice who does not have prior knowledge of the answer[30].
Prior knowledge is the easiest and the fastest to discover.
The more prior knowledge was applied the more efficient a Knowledge Discovery process is.
Conversely, when a lot of required knowledge is missing then the knowledge discovery is less efficient.
KEDE is a measure of how much of the required knowledge for completing tasks is covered by the prior knowledge.
Below is an animated example of calculating KEDE when we search for a gold coin hidden in 1 of 64 boxes.
In all six cases the required knowledge is 6 bits.
That means, we need to ask six binary questions on average to find the gold coin.
You can see that the knowledge to be discovered depends on the prior knowledge.
KEDE quantifies the knowledge discovered i.e. the
difference between required knowledge and prior knowledge.
KEDE quantifies how efficiently knowledge workers discover and apply knowledge.
In order to increase KEDE of an organization the knowledge workers have to know "what" they are doing and "how" to do the "what".
The more knowledge they apply the greater KEDE is.
If knowledge workers start a project in a business domain they know nothing of, with a technology they know nothing of then KEDE will approach zero.
KEDE is low when the knowledge workers did not possess the knowledge needed or
they possessed the knowledge but were prevented from applying it.
KEDE is high when the knowledge workers do possess the knowledge needed and apply it.
The less knowledge discovered the better.
The less questions the better.
Less questions asked means lower level of perplexity for the humans involved.
KEDE is a general form of a metric for knowledge work.
That means for each specific context we have to define a specific way to calculate KEDE.
For instance, if we do the knowledge work of a surgeon then both the knowledge discovered and the maximum amount of knowledge that could possibly be discovered need to be measured in a specific way.
Due to its general definition KEDE can be used for comparisons between organizations in different contexts.
For instance to compare hospitals with software development companies!
That is possible as long as KEDE calculation is defined properly for each context.
In what follows we will define KEDE calculation for the case of knowledge workers who produce textual content in general and computer source code in particular.
Measuring software development
"...my teaching is a method to experience reality and not reality itself, just as a finger
pointing at the moon is not the moon itself. A thinking person makes use of the finger to
see the moon. A person who only looks at the finger and mistakes it for the moon will never
see the real moon."~ Buddha via Thich Nhat Hanh
Now when we have defined what a Knowledge Discovery Efficiency (KEDE) is we need to be able to measure it in
practice.
Unfortunately, in real settings the questions asked are invisible to us.
They are asked by the knowledge workers either to themselves or to many other people.
There is no way to get inside а human's head and count the questions asked while discovering knowledge.
The process of discovering knowledge is a black box.
We pragmatically adopt the positivist credo that science should be based on observable facts, and decide to infer the number of questions asked solely from the observable quantities we can measure.
In reality the only thing we can measure is the tangible output.
We will simplify the reality that is knowledge work by accepting a few unproven
assumptions or axioms.
That is not the first time humans simplified reality in order to gain practical benefits.
Euclid for instance created his geometry on the foundation of twenty-three definitions,
five unproven assumptions now known as axioms and five further unproven assumptions that he
called common notions.
Some of the definitions, such as “a point is that which has no part” and “a line is a length
without breadth” are gross simplifications and
abstractions not to be found in reality.
Nevertheless, Euclidean geometry has been of great practical value to humankind.
It has been used by the ancient Greeks through modern society to design buildings, predict the
location of moving objects and survey land.
However Euclidean geometry is not always applicable.
The surface of a sphere satisfies all the other Euclidean axioms, but not the parallel
postulate.
On a sphere, the sum of the angles of a triangle is not equal to 180°.
The surface of a sphere is not a Euclidean space, but locally the laws of Euclidean geometry are
good approximations.
Later on Lobachevsky created the "hyperbolic" geometry that rejects the validity of Euclid's
fifth, the “parallel,” axiom.
A modern use of hyperbolic geometry is in Einstein's General theory of Relativity.
From all that historical review we shall acknowledge that founding knowledge discovery on
assumptions follows the way science has been applied for practical gains.
Here are the assumptions our approach is based on:
For the knowledge discovery process there is some true value of missing information H.
The knowledge discovery process happens linearly as a constant stream of questions asked by a knowledge worker.
At n regular time intervals we sample from the knowledge discovery process.
This way we divide the constant stream of questions asked in n equally sized boxes.
A sample can contain either a contributed symbol or nothing at all.
If we sample nothing we assume there was a question asked by the knowledge worker, but no symbol was found.
In other words - we assume that if there is no symbol contributed then there was a question asked.
The samples are independent of one another, hence the order of the symbols and questions is irrelevant.
Each symbol contributed was initially hidden in one of m equally sized boxes.
The m equally sized boxes composed the search space M.
There is no way to find the true value of m.
Each symbol contributed was the result of a search done in the search space M by asking binary questions i.e.
questions which are only answerable by "Yes" or "No".
The knowledge worker always chooses the optimal strategy that
allows for acquiring the missing information of the search space M with the average number of binary questions.
In other words, we assume that
with each question the knowledge worker removes half of the possibilities
i.e. acquires one bit of information.
That means that the number of questions asked per symbol contributed equals the missing
information HM of the search space.
This is consistent with the approximation that the effective entropy of English is approximately 1 bit per character,
meaning each character narrows down the possibilities by a factor of 2
At regular time intervals, a day or a week, we calculate the average number of questions per symbol by dividing the
total number of questions asked by the total number of symbols contributed during the interval.
It is a measure of the average uncertainty or "missing information" about each symbol,
assuming that each question contributes to reducing this uncertainty.
We know that the average number of questions per symbol equals the average missing information acquired by the underlying knowledge discovery process,
because there is a mathematical theorem that supports this interpretation.
The theorem states that the minimum average (expected) number of binary questions (also referred to as yes/no questions)
required to determine an outcome of a random variable X lies between H(X) and H(X) + 1 [5].
This theorem provides a connection between Shannon entropy (H) and the expected number of binary questions needed to acquire missing information.
So, while the specifics of our model and the types of data it deals with may differ from many of the situations where information theory is traditionally applied,
the concept of "missing information" as we've defined and used it does capture the same fundamental idea as entropy in information theory.
Efficiency means the smaller the average number of questions asked per symbol of source code contributed the better.
In other words - the less missing information per symbol of source code contributed the more efficient the
knowledge discovery process is.
More efficient knowledge discovery process doesn't always mean higher productivity!
It's important to note that KEDE
does not directly measure productivity in software development.
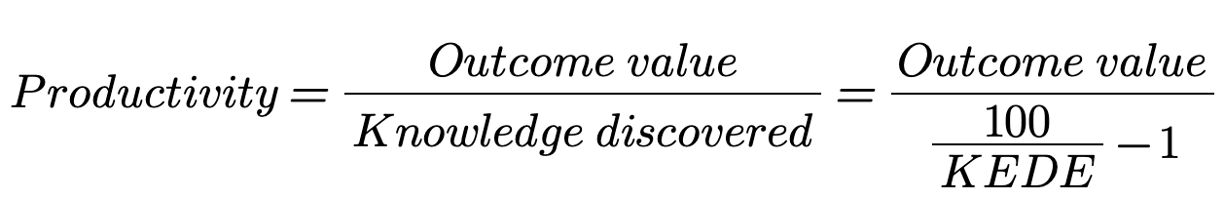
Productivity in software development is determined by the
outcome value produced by the code,
and not simply by the amount of knowledge discovered during its creation.
The ratio of outcome value produced
to knowledge discovered, as captured by the KEDE metric,
is what ultimately determines productivity.
More detailed information on how to measure productivity in software development can be found here
along with a numerical example.
Software development is a process of going from 0% knowledge about an idea to 100% knowledge
of a finished product ready for delivery to a customer.
In its simplest form, the job of software development is to reduce the number of unknowns to zero
by the time the system is delivered.
It is a process of knowledge acquisition and ignorance reduction[32].
Then, we can model the software development process as a knowledge discovery process.
In software development the missing information H arrives through
people -
developers, managers, clients who are part of the process.
Software developers serve as a communication channel that via asking questions encode
information from the
environment into symbols.
There are two major types of questions. First, looking for business knowledge about WHAT
needs to be
delivered.
This information is expected from the people that requested the software to be developed.
Second, looking for technical knowledge needed for the developers to know HOW to develop the
WHAT.
Business knowledge usually is in the form of requirements.
Technical knowledge is the expertise the software developers possess or need to acquire.
Unfortunately we don't have a way to capture the questions software developers ask.
We only have the output of their work in the form of computer code.
Fortunately computer code is composed of symbols and now we will calculate the
average number of
questions asked H using only the number of symbols of source code contributed per
time interval.
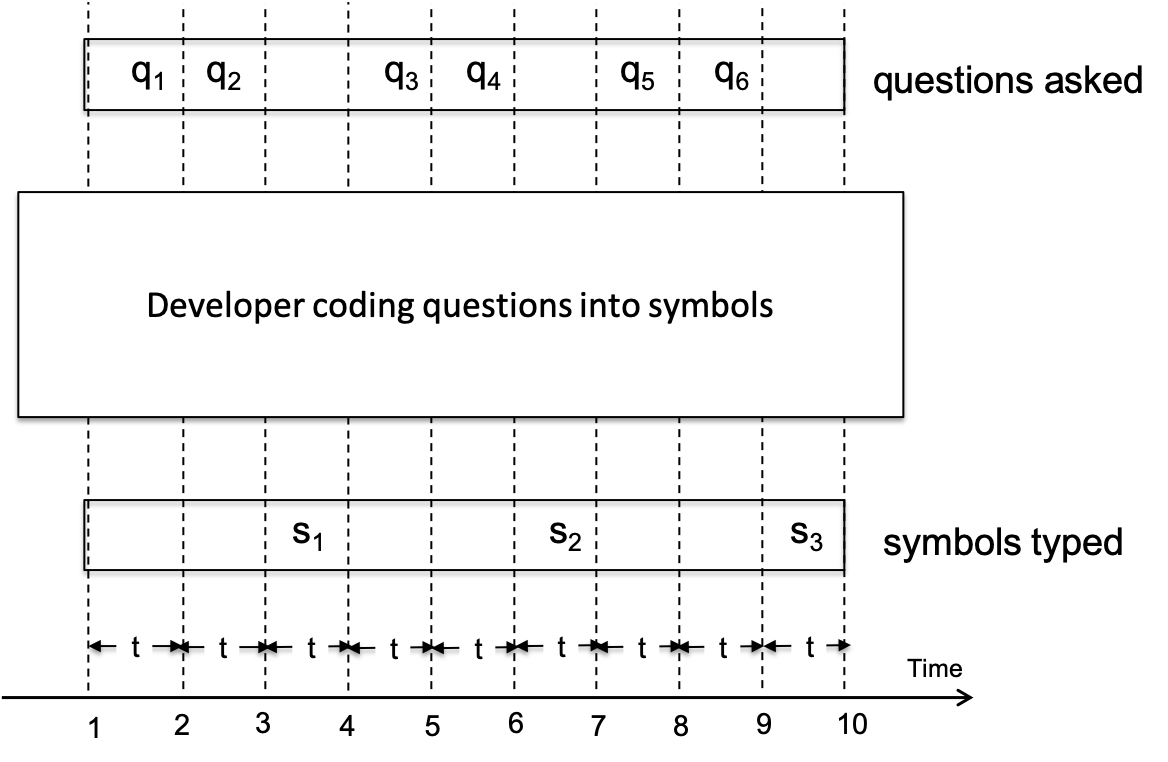
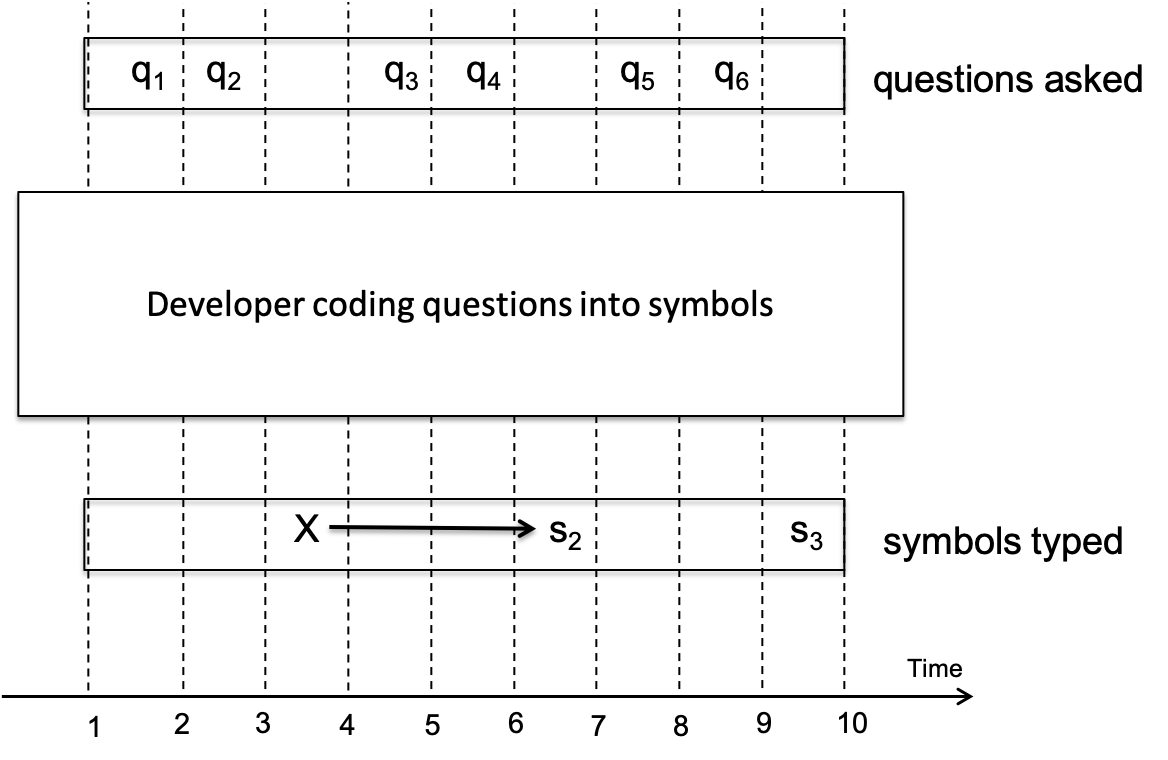
We consider the example presented on Fig. 1: we have a developer asking questions about what symbol to type next.
The developer has typed 3 symbols and has asked 6 questions.
Then, the developer needs on average to ask two questions in order to type one symbol.
Fig.1 Converting information into symbols process.
Here we have a developer asking questions about what symbol to type next.
On the horizontal axis we have the progression of time measured in time intervals
t.
The unit of time for an interval t is the symbol duration time, also known as unit interval (UI) or
the time in
seconds it takes to type one symbol.
The total available time T is divided into n time intervals t.
In our example t equals 9 hence T=nt=9t.
At any given time the developer can either place a question in the questions channel
or type a symbol into the symbols channel.
Each question takes one time interval
t and each symbol also takes one time interval
t.
We have three symbols typed - s1, s2 and s3.
For symbol s1 there were two questions asked q1 and q2.
As per our assumptions that means symbol s1 was the result of a search in a search space M1 composed of m1 equally sized boxes
Hence we have m1=22=4 and H1=2 questions per symbol.
For symbol s2 there were two questions asked q3 and q4.
That means symbol s2 was the result of a search in a search space M2 composed of m2 equally sized boxes
Hence we have m2=22=4 and H2=2 questions per symbol.
For symbol s3 there were questions asked q5 and q6.
That means symbol s3 was the result of a search in a search space M3 composed of m3 equally sized boxes
Hence we have m3=22=4 and H3=2 questions per symbol.
Since we know that the average number of questions per symbol equals the average missing information acquired by the underlying knowledge discovery process, then
the information H acquired is the average of the missing information for each of the search spaces M1, M2 and M3.
H is also the average length of the full message “q1q2q3q4q5q6”.
In this case we have three messages “q1q2”,”q3q4” and “q5q6” and their average length is 2.
In order to define KEDE, we generalize the concept from Fig.1 as follows.
Both channels (questions channel and symbols channel) form a time series {x} = {x1 , . . . , xn } of length n.
We divide the time series {x} into S consecutive and non-overlapping subseries wi,
where S is the number of symbols in the time series {x}
and i is the subseries index ranging from 1 to S.
Each subseries wi consists of one symbol si and zero or more questions {qi} = {q1 , . . . , qj },
where j is in the interval [0,n/S].
Note, that each subseries wi may have a different length.
We count the number of questions qi in each subseries wi.
Note that each subseries wi contains only one symbol si.
As per our assumptions, that means si was the result of a search in a search space Mi composed of mi equally sized boxes.
Next, we calculate the missing information Hi for each subseries wi as equal to the number of questions qi.
After calculating the missing information Hi for each subseries, we construct a missing information sequence {Hi} of length S.
Finally, the missing information H of the time series {x} is defined as the average of the missing information sequence {Hi} in the form
(1)
We define the total number of questions asked Q for time series {x} as the sum of the missing information sequence {Hi} in the form
(2)
Hence the average missing information H equals the average number of questions asked to type one
symbol.
(3)
That is the same as the Information Rate formula, where Q is the Information Rate and S is the Symbols Rate.
We'd like to calculate H but we don't know Q - we know only S.
However in our model we assume that the minimum symbol duration is one unit of time and is
equal to the time it takes to ask one question.
If that's the case, then in our time-series model, each human action (whether it's a question 'q' or a symbol 's') could be considered as occupying one unit of time t.
Hence the sum of S and Q as measured in time
units equals the length n of the time series {x}:
To apply the formula in practice we need to select a value for the length n of the time series {x}.
The total available time T is implicitly contained in both Q and S.
We add the total available time T explicitly (more details here).
We define r as the symbol rate (whether it's a question 'q' or a symbol 's')
of the symbols channel S .
r is measured in symbols per second and
can be calculated using the symbol duration time
t:
Then:
Now we have the length n of the time series {x} defined in terms of the total available time T and symbol rate r.
We drop usage of n and instead from now on will be using N as maximum symbol rate.
We generalize for the sum of questions Q, symbols S and the maximum symbol rate N.
(4)
When we insert that in the formula for H we get:
Then, we have a formula that allows us to calculate the average missing information
H for a time series {x} if we know the
maximum symbol rate N, the total available time T
and the actual symbol rate
S.
(5)
If there is no missing information to be acquired, i.e. there is no need to ask questions at all,
then S equals N and H is zero.
We define an instance of the metric KEDE - the general metric that we introduced earlier,
for the case of knowledge workers that produce tangible output in the form of textual content to be:
(6)
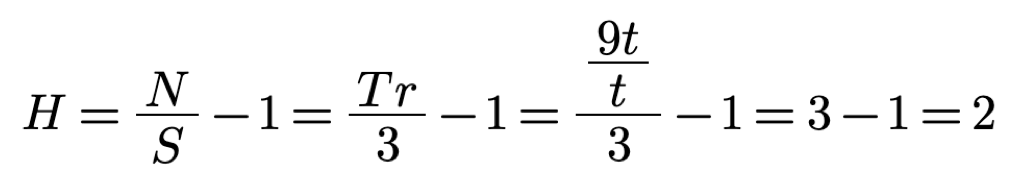
Using the formula we can check if we'll get the same result as in the example presented on Fig.1.
There the maximum symbol rate N is 9 symbols per 9 time
units or 1
symbol per time unit and S is 3 symbols.
Let's also apply the formula to the knowledge discovery process of typing the word “Honorificabilitudinitatibus” from here:
We see that it took two questions for the first five letters, one question for the next seven
letters, two
questions for the next three letters, one question for the next three letters, two questions
for the next
two letters and two questions for the last seven letters.
That is presented in the table below.
Questions (Qi)
Letters (Si)
Missing information (Hi)
Maximum symbol rate (Ni)
2
5
2/5
2+5
1
7
1/7
1+7
2
3
2/3
2+3
1
3
1/3
1+3
2
2
2/2
2+2
2
7
2/7
2+7
Sum(Qi) = 10
Sum(Si) = 27
Sum(Ni) = 10+27
The last row has the total number of questions asked and total number of answers received i.e.
letters typed.
Since the average number of questions per symbol is the
information acquired H, then H is 0.37 bits of information.
where n is the number of subsets,
Si are the number of symbols in each subset, and
Qi are the number of questions in each subset.
We have six subsets.
Each subsets has its own missing information Hi.
We can't just sum the missing information of the six subsets.
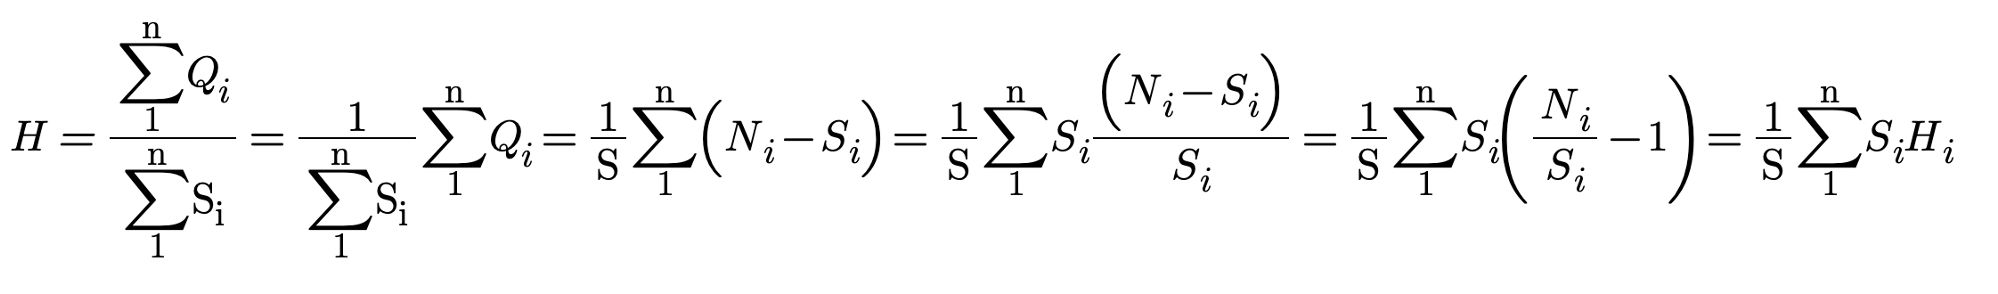
The weighted sum of missing information is computed instead i.e. weighted by the size of the subsets:
where n is the number of subsets,
Si are the number of symbols in each subset,
Qi are the number of questions in each subset,
Hi is the missing information in each subset, and
Ni is the maximum symbol rate for each subset.
If we use the Hi values from the table we get 0.37 bits of information:
The same can be calculated using the formula (5):
Anchoring KEDE to natural constraints
In order to use the KEDE formula (6) in practice we need to know both S
and
N.
We can count the actual number of symbols of source code contributed straight from the source code files.
For N we want to use some naturally constrained value.
N is the maximum number of symbols that could be contributed for a time interval by a single human being.
In the below formula for N we want to use some naturally constrained value:
To achieve this, the following estimation is performed.
We pick T = 8 hours of work because that is the
standard length of a
work day for a software developer.
To calculate the value of r we need to pick the symbol duration t.
The value of the symbol duration time t is determined by two natural constraints:
the maximum typing speed of human beings
the capacity of the cognitive control of the human brain
Typing speed has been subject to considerable research. One of the metrics used for analyzing typing speed is inter-key
interval (IKI), which is the difference in timestamps between two keypress events.
We see that IKI is defined equal to the symbol duration time t.
Hence we can use the research of IKI to find the symbol duration time t.
It was found that the average IKI is 0.238s [26].
There are many factors that affect IKI [6].
It was also found that proficient typing is dependent on the ability to view characters in advance of the one currently being
typed. The median IKI was 0.101s for typing with unlimited preview and for typing with 8 characters visible to the right
of the to-be-typed character but was 0.446s with only 1 character visible prior to each keystroke [7].
Another well-documented finding is that familiar, meaningful material is typed faster than unfamiliar, nonsense material[8].
Another finding that may account for some of the IKI variability is what may be called the “word initiation effect”. If
words are stored in memory as integral units, one may expect the latency of the first keystroke in the word to reflect
the time required to retrieve the word from memory[9].
Cognitive control, also known as executive function, is a higher-level cognitive process
that involves the ability to control and manage other cognitive processes
that permit selection and prioritization of information processing
in different cognitive domains to reach the capacity-limited conscious mind.
Cognitive control coordinates thoughts and actions under uncertainty.
It's like the "conductor" of the cognitive processes, orchestrating and managing how they work together.
Information theory has been applied to cognitive control by studying the capacity of cognitive control
in terms of the amount of information that can be processed or manipulated at any given time.
Researchers found that the capacity of cognitive control is approximately 3 to 4 bits per second[29][36],
That means cognitive control as a higher-level function has a remarkably low capacity.
Based on the above research we get:
Maximum typing speed of human beings to be r=1/t=1/0,238=4.2 symbols per second
Capacity of the cognitive control of the human brain to be approximately 3 to 4 bits per second.
Since we assume one question equals one bit of information we get 3 to 4 questions per second.
Asking questions is an effortful task and humans cannot type at the same time.
If there was a symbol NOT typed then there was a question asked.
That means the question rate equals the symbol rate, as explained here.
Since the question rate needs to equal the symbol rate we consider that 4.2 symbols per second is a rate higher than 3 to 4 bits per second.
We need to get a symbol rate between 3 and 4 symbols per second.
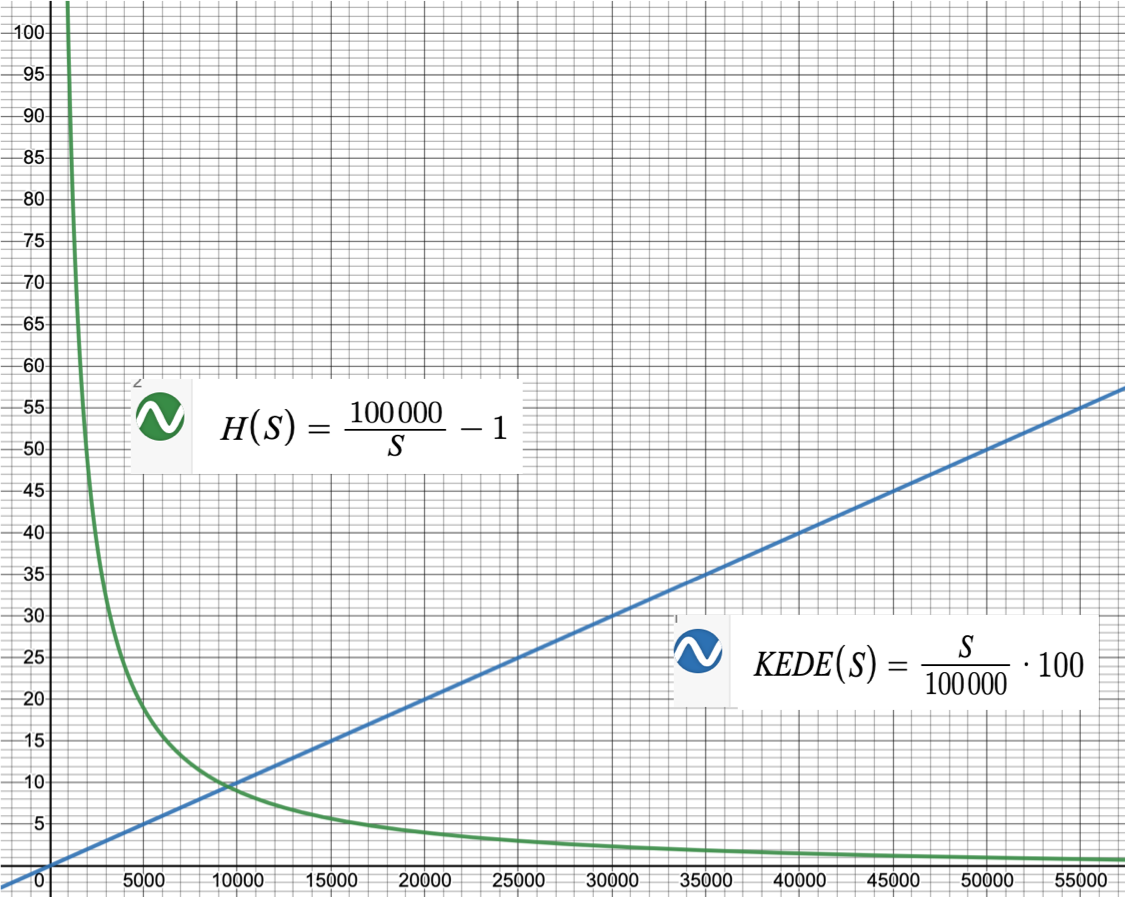
In order to get a round value of maximum symbol rate N of 100 000 symbols per 8 hours of work we
pick symbol duration time t to be 0.288 seconds.
That is a bit larger than what the IKI research found but makes sense when we think of 8 hours of typing.
Having t of 0.288 seconds makes a symbol rate r of 3.47 symbols per second.
That is between 3 and 4 and matches the capacity of the cognitive control of the human brain.
We define CPH as the maximum rate of characters that could be contributed per hour.
Since r is 3.47 symbols per second we get CPH of 12 500 symbols per hour.
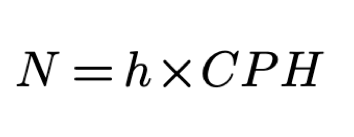
We substitute T = h and r=CPH and the formula for N becomes:
where h is the number of working hours in a day and
CPH is the maximum number of characters that could be contributed per hour.
We define h to be eight hours and get N to be 100 000 symbols per eight
hours of work.
Total working time consist of four components:
Time spent typing (coding)
Time spent figuring out WHAT to develop
Time spent figuring out HOW to code the WHAT
Time doing something else (NW)
Let us assume an ideal system where the time spent doing something else TNW is zero.
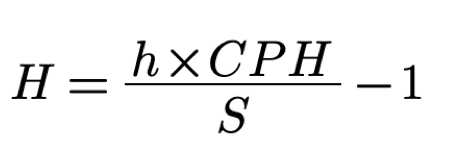
Using the new formula for N the formula for H
becomes
Note, that since N is calculated per hour so S also needs to be counted in an hour.
We see that the more symbols of source code contributed during a time interval the less missing information was there
to be acquired.
We want to compare the performance of different software development processes in terms of the efficiency of their knowledge discovery processes.
Hence we rearrange the formula to emphasize that.
(7)
The right hand part is the KEDE we defined earlier.
Thus, we define an instance of the metric KEDE - the general metric that we introduced earlier.
This version of KEDE is for the case of knowledge workers that produce tangible output in the form of textual content:
(8)
KEDE from (8) contains only quantities we can measure in practice.
KEDE also satisfies all properties we defined earlier.
it has a maximum value of 1 and minimum value of 0; it equals 0 when H is infinite;
it equals 1 when H is zero; it is anchored on a natural constraint—the maximum typing speed of a human being.
If we convert the KEDE formula into percentages then it becomes:
(9)
We can use KEDE to compare the knowledge discovery efficiency of software development organizations.
KEDE has the following properties:
Minimum value of 0 and maximum value of 100.
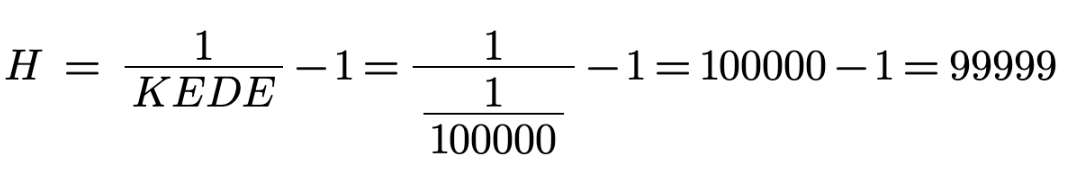
KEDE approaches 0 when the missing information is infinite.
That is the case of humans creating new knowledge.
Examples are intellectuals such as Albert Einstein and startups developing new technologies such as Paypal.
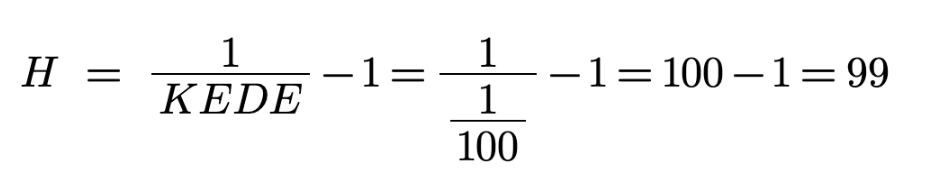
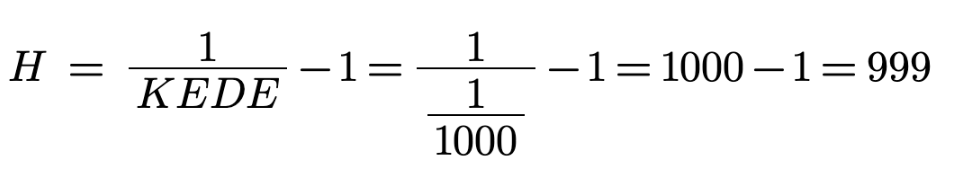
KEDE approaches 100 when the missing information is zero.
That is the case of an omniscient being...like God!
KEDE will be higher if knowledge workers don't spend time discovering new knowledge, but just applying prior knowledge.
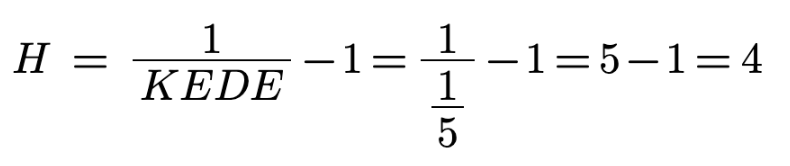
We would expect KEDE of 20 for an expert full-time software developer,
who mostly applies prior knowledge, but also creates new knowledge when needed.
Software developers apply their knowledge to deliver desired outcomes.
KEDE quantifies the knowledge that they didn't have prior to starting a task, since it is this lack of knowledge
that significantly impacts the time and effort required in software development.
If software developers don't have the knowledge needed they have to discover it.
The knowledge they have to discover is the total of what they don't know they don't know and
what they know they don't know.
Prior knowledge is the easiest and the fastest to discover - it is there, one just applies it.
In other words, when prior knowledge is applied then there is the most efficient knowledge discovery.
Conversely, when a lot of knowledge is missing then the knowledge discovery is less efficient.
Now we can see why we have the Buddha's quote in the beginning of this section.
In our case the finger is the number of symbols of source code contributed and the moon is the number of questions
asked during a time period.
We are not interested in the symbols and the meaning they carry.
We are interested in the number of questions developers ask themselves and others to discover
the missing information.
If there was a way to get inside a human's head and count the questions asked we would have done that.
Unfortunately there is no such way.
Hence we have to use the number of symbols of source code contributed to infer the number of questions asked.
Waste
"The general root of superstition : namely, that men observe when things hit, and not when
they miss;
and commit to memory the one, and forget and pass over the other." ~ Francis Bacon
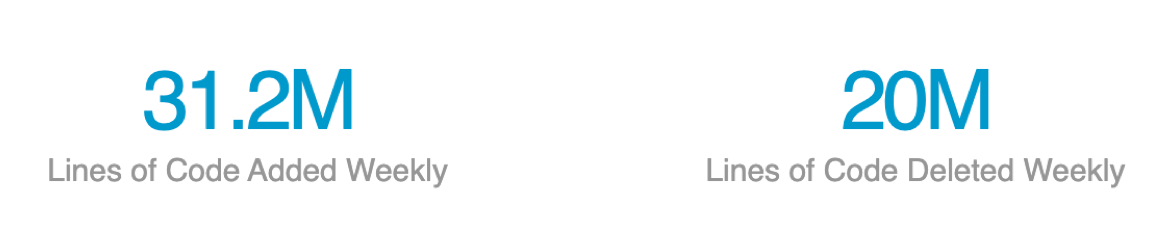
If we open the Linux Foundation projects web page we will see they proudly
show 31.2M lines
of code added weekly and 20M lines of code deleted weekly.
How should we evaluate that?
Clearly adding something is good. Deleting may be good, but may be bad - depending on what
was deleted.
We need a way to quantitatively evaluate if deleting code is good or bad.
For that we introduce the new metric named Waste (W).
We consider an example presented in Fig.2.
We have a developer asking questions about what symbol to type next.
On the horizontal axis we have the progression of time.
At any given moment the developer can put something either in the questions channel or into
symbols channel.
Fig.2. Waste. The developer types a wrong symbol X.
This error in transmission of questions into symbols increases the missing information H.
In our case we have three symbols for 9 units of time.
The symbol X is wrong and represents an error in the transmission
of questions
into symbols.
The arrow represents the fact that the error was detected and after that
X was
deleted and then replaced by the proper symbol s2.
Symbol X converted into question X.
Since the questions channel produces errors the symbol rate of the symbols channel is reduced by
those errors.
This is visible in our example where there are three symbols in total
(X,s2,s3).
Since X is an error S is calculated using only the correct symbols
(s2,s3).
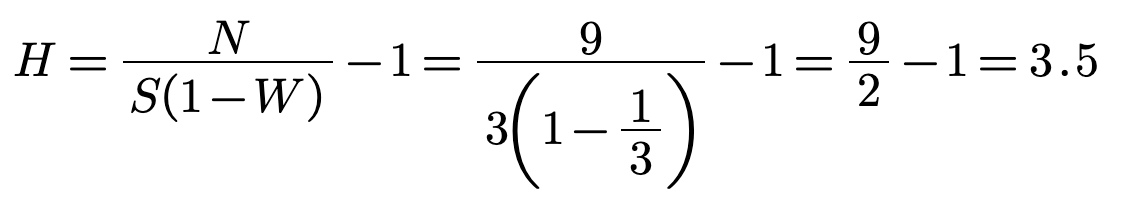
Having S=3, Q=6 and D=1 we calculate the missing information H:
Which means the developer needs to ask three and a half questions on average in order to type one
symbol.
That is visible on the figure as well.
H is also the average length of the messages w.
In this case we have two messages w1 =“q1q2Xq3q4” and
w2=“q5q6”, where "X" is now a question.
Their average length H is (5+2)/2=3.5.
If X was not an error then we would have H=2 and three messages
“q1q2","q3q4” and
“q5q6”, then their average length H would have been 2.
Hence the false symbol X increases H with 75%.
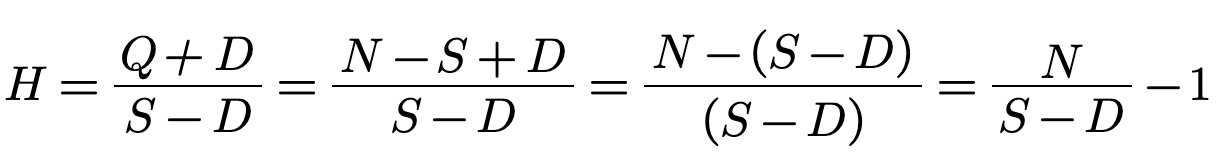
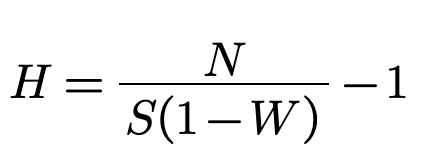
With some algebra we express H with S, D and N only.
where N is the maximum symbol rate for a time interval T,
D is the number of symbols deleted during the same time interval,
and S is the number of added symbols for the same time interval.
Let's examine how errors effectively reduce the maximum information that a channel can
communicate.
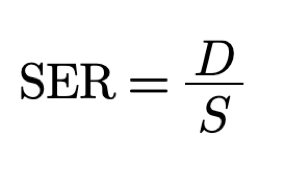
Symbol Error Rate (SER) is the probability of receiving a symbol in error for a given time
interval.
Accordingly, the probability of receiving a symbol with no error is (1-SER).
Here is the formula for SER where D stands for the rate of symbols in error and S is the
symbol rate of the total
number of transmitted symbols.
SER is the name used in information theory.
We need a name that would better represent the same quantity in the context of knowledge
work.
What actually happens is that with erroneous questions we waste knowledge discovery
capacity.
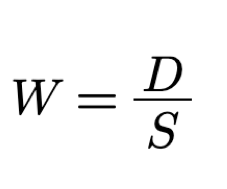
Hence we will call this quantity Waste (W).
where D stands for the number of symbols deleted during a time interval T,
and S is the number of added symbols for the same time interval.
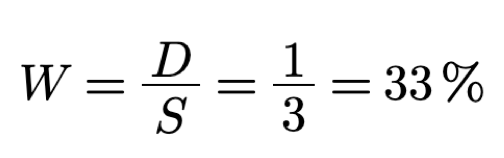
In the example we have 1 error symbol X out of a total of 3 symbols, hence
W is
33%.
Now we can amend the formula for calculating H and account for the probability of receiving a
symbol without error.
Waste (W) measures the things that should not have been done but nevertheless were.
Its presence simply reflects the fact that human beings are not omniscient i.e. we don’t have universal, unlimited and complete knowledge.
We often realise it was a wrong question only after we get the answer. Waste sometimes is needed for humans to learn what not to build and/or how not to build it.
However, we would like to learn as cheaply as possible. That would mean minimizing the waste. Hence, measuring waste is essential for us to get better at learning.
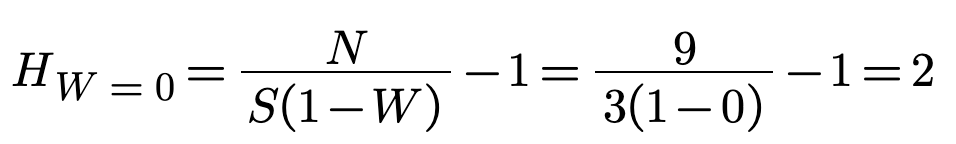
If we have no error symbols then W is 0 and we've wasted no questions.
This case HW=0 is also called actual missing information of the system H(X),
which in our case equals the mutual information, as explained here.
In the context of information theory, if X and Y are both binary variables
and the mutual information I(X;Y) equals the missing information H(X),
it means that knowing Y removes all uncertainty about X. In other words, the conditional missing information H(X|Y) is zero.
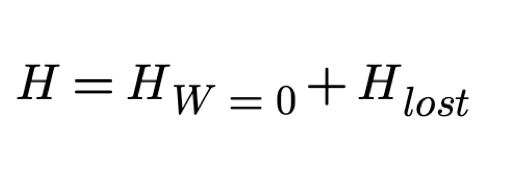
The perceived missing information (H) can be considered as the sum of the information conveyed HW=0 (mutual information,
or the information that was intended to be transmitted) and the information lost due to errors
(which could be thought of as noise or interference)
Information lost is what Claude Shannon called the conditional missing information H(X|Y) or "equivocation"[1].
If we consider our example scenario where X is the correct symbol and Y is the answers to my questions,
perceived missing information is the sum of the actual missing information of a system H(X)
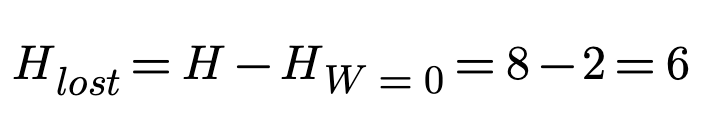
and the additional missing information perceived due to incorrect or misleading information Hlost.
It represents the total amount of uncertainty perceived about a system, taking into account both the actual uncertainty
and the additional uncertainty introduced by incorrect or misleading information.
Hlost represents the amount of information that was thought to be gained but was actually not due to incorrect answers.
Mathematically, you could express this as:
In our context:
So, in this context, we could express this as:
Now we can calculate the amount of information lost due to errors for the case where W = 33%.
If we have no error symbols out of 3 then W = 0 and we've wasted no questions.
It took one erroneous symbol X so W = 1/3.
Then we calculate the lost information due to waste:
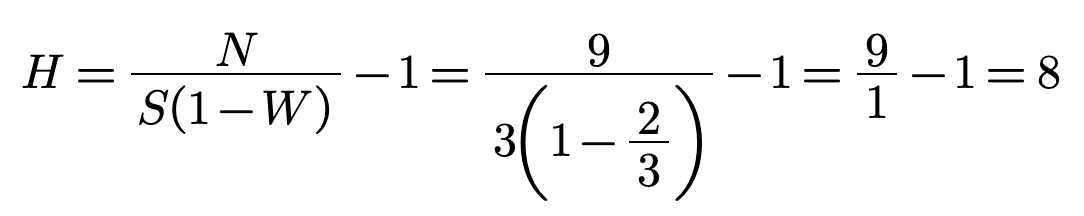
As another example, let's have 2 error symbols out of 3. Then W = 2/3 = 67%.
Which shows that we've wasted 6 bits:
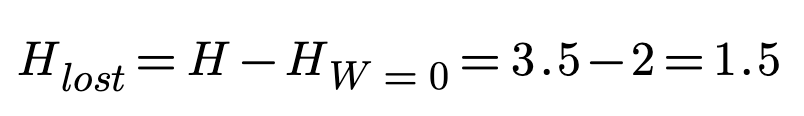
We simplify the expression for Hlost as:
(10)
This equation represents the difference in knowledge when there is no waste (W=0)
versus when there is some amount of waste (W>0).
As W increases, the amount of lost knowledge Hlost also increases.
Since KEDE is a function of H we get:
(11)
Substituting N the KEDE formula becomes:
(12)
where S is the actual symbols of source code contributed per hour,
h is the number of working hours in a day,
CPH is the maximum number of symbols of source code that could be contributed per hour,
and W stands for the waste probability.
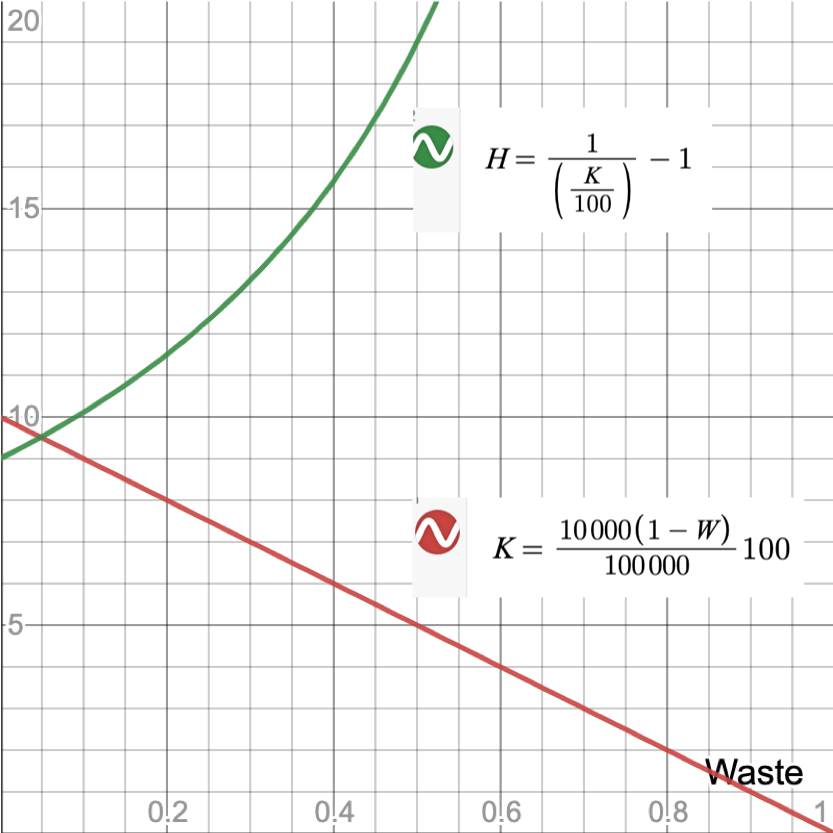
Below is presented how W affects KEDE and H:
where for illustration KEDE equals 10.
We see that when W is bigger than 0.6 then H grows non-linearly beyond 20.
Lost time
Quite often knowledge workers complain about much smaller things that limit their productivity.
For instance, many people complain that meetings usually waste people's time.
The claim is that if there are fewer meetings or at least shorter ones, their "lost time" will
be saved and used for more productive work.
Why do we call the "lost time" hidden?
That is because when calculating KEDE we assume that all the time knowledge workers spent
consisted of asking questions and typing symbols.
That means there is no Non-working time during a work day.
Hence if there is Non-working time greater than zero then it was not taken into account or
hidden from the formula.
The factor we add to the KEDE formula should change the result in case we find the hidden "lost
hours".
The intuition here is that the calculated KEDE should increase in case we manage to eliminate or
decrease the hidden Non-working "lost time".
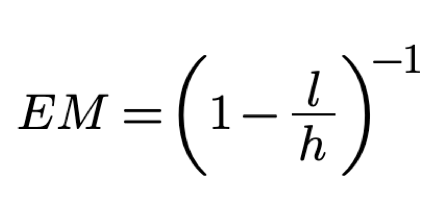
We call the factor - Efficiency Multiplier (EM) and calculate it using the formula:
where h are the 8 working hours, l are the
hours lost in unproductive activities.
Efficiency Multiplier allows for estimating how much knowledge discovery efficiency should
increase
if we cut some of the hidden time that is lost in Non-productive activities.
Below is visualized the relationship between "lost time" and Efficiency Multiplier (EM).
It is a non-linear relationship.
When there are no hours lost the EM=1 and KEDE stays the same as previously calculated.
If the lost time is up to four hours then Efficiency Multiplier and KEDE would increase in
approximately a linear way.
That means each minute saved would increase KEDE proportionately.
If the lost time is more than six hours then the increase in KEDE would explode - one minute
saved would increase KEDE disproportionately.
That would mean the real KEDE was very high but hidden inside a work day.
We can now quantify the effect of saved time by adding to the KEDE formula the Efficiency Multiplier to account for
the hidden "lost time".
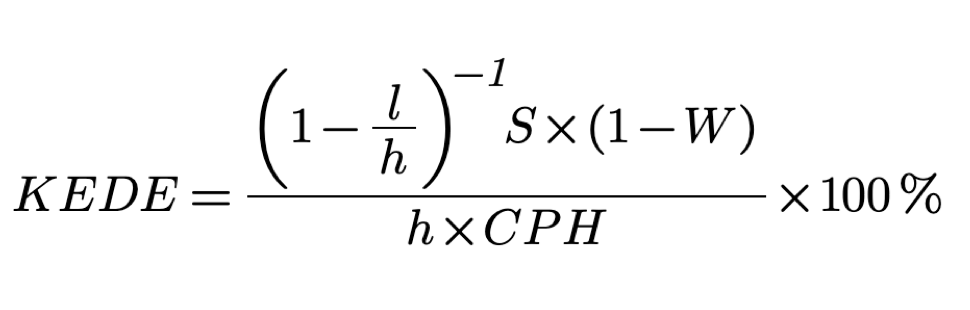
KEDE formula
Where:
S is the number of added symbols in a day;
h is the number of working hours in a day;
CPH is the maximum number of characters that could be contributed per hour;
l are the hours wasted on non-productive activities;
W stands for the waste probability.
The above formula means that individual KEDE is:
Inversely proportional to the difference between the level of knowledge the individual has and the level of knowledge required to do a job;
Inversely proportional to the amount of waste the individual removes while doing the job;
Inversely proportional to the amount of time wasted on non-productive activities;
Conclusion
In the past doctors' determination of whether fever was present was qualitative.
Physicians regularly touched the foreheads of their patients and gauged what kind and how bad the fever was.
Not only the degree of heat was important but also its kind - healthy body heat and febrile heat.
The latter was also characterized by qualitative aspects and could, for example, be “sharp” or “biting”.
Scientists, however, wanted to discover reproducible laws in medicine, and the verbal descriptions were not working.
Words are idiosyncratic; they vary from doctor to doctor and even for the same doctor from
day to day.
Numbers never waver.
While today we trust numbers and measurements regarding medical issues, in ancient times it was not thought that phenomena like health could be recorded by numbers, let alone be measured.
Then Sanctorio Sanctorius, a member of Galileo Galilei's circle of friends, developed the first fever thermometers to determine his patients' body heat.
This was a paradigm shift.
The present day attitude toward measuring knowledge work very much resembles how temperature was understood 400 years ago.
It is time to get rid of qualitative description of knowledge work and start describing it in numbers.
It is time to stop measuring knowledge work by the tangible output i.e. working software with the requested functionality.
It is time to stop measuring knowledge work by the effort put in producing the tangible output.
It is time to start measuring the knowledge work by its essence which is the knowledge discovery itself.
The new paradigm is represented by the knowledge discovery efficiency KEDE.
KEDE can help us quantitatively understand what is going on inside the black box that is an organization developing software.
Let's make it crystal clear - knowledge discovery efficiency is a paradigm shift, a radically different approach.
KEDE could shape the future trajectory of the software development industry for generations to come.
Additional quantities based on the KEDE model
Calculating Knowledge Discovered
Knowledge discovered is the cumulative sum of missing information (or questions, in our model) over a specific time period. It signifies the total amount of information contained in a set of messages, which is derived from the sum of the information in each individual message.
In our model, knowledge discovered sums the number of questions associated with each symbol in the time series, effectively quantifying the total amount of missing information or uncertainty across the entire series.
In (2), we defined the total number of questions asked Q for the time series {x} as the sum of the missing information sequence {Hi}. Now, we aim to calculate it using only quantities that we can measure in practice. Utilizing equations (4) and (11), we can do so as follows:
Here, N represents the maximum symbol rate for a time interval T, D denotes the number of symbols deleted during the same time interval, and KEDE is the Knowledge Discovery Efficiency for the same time interval.
This calculation is based on the assumption that the messages are independent and identically distributed,
meaning each message has the same probability and the receipt of one message doesn't affect the probabilities of the others.
This independence allows us to simply add the information content of each message to determine the total information.
If the messages weren't independent, we would need to consider the joint probabilities of the messages to calculate the total information.
In standard information theory, there isn't a direct equivalent for 'knowledge discovered'.
However, it can be loosely associated with the sum of the information content of all the messages.
It can be viewed as a raw count of the total number of bits, not taking into account any probabilities or statistical dependencies
that might exist among different bits.
This perspective stems from the basic concept of a bit as a measure of information,
and the fact that the total amount of information in a set of messages is the sum of the information in each individual message.
For instance, if we have three messages and each message carries 2 bits of information,
then the three messages will collectively carry a total of 2 * 3 = 6 bits of information.
However, it's crucial to underline that the concept of 'knowledge discovered', as defined in our model,
doesn't perfectly map onto any single concept in standard information theory.
It's a distinct measure, specific to our model and the KEDE framework.
Measuring the balance between individual capabilities and work complexity
KEDE is a ratio between the knowledge discovered and the maximum knowledge that could be discovered for a time period,
as explained in details here:
where Q is the total number of questions asked in a time interval,
S is the total number of answers acquired for the same time interval.
KEDE is continuous in the closed interval of (0,1].
KEDE is inversely proportional on the questions asked
i.e. on the difference between knowledge required by a task and the prior knowledge of a person,
and proportional to the answers acquired
We have only two possible outcomes, Answer and Question,
with probabilities KEDE and (1-KEDE), respectively.
For calculating the balance between questions and answers we use Shannon's formula[1]
In this context, p1 = KEDE and p2 = (1-KEDE)
and the Balance function of one variable is:
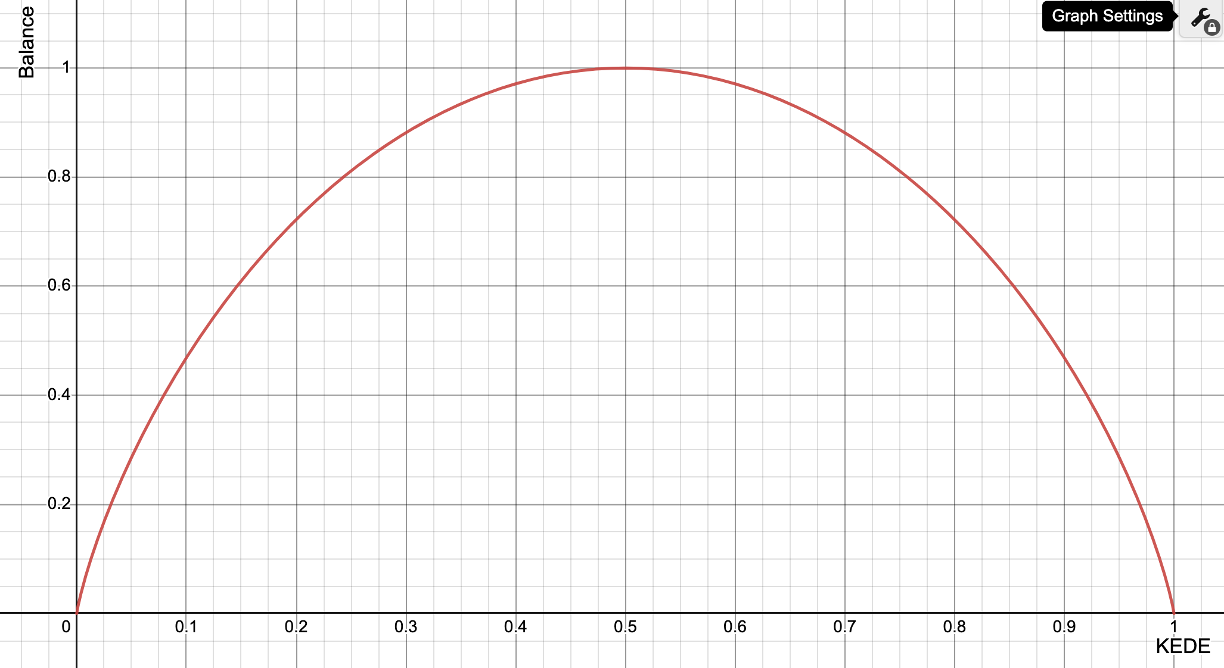
Figure below shows the function Balance(KEDE).
Balance as a function of KEDE
This function exhibits positive values throughout, presents a concave or downward curve, and peaks at 1 when KEDE equals 1/2.
Importantly, the function returns zero at both KEDE = 0 and KEDE = 1, denoting maximum imbalance.
This property is consistent with what we intuitively expect from a quantity
that measures the balance between questions and answers.
If KEDE = 1, then we know for certain that now questions were asked.
If KEDE = 0, then we know for certain that no answers were acquired.
In both cases, there was no balance between questions and answers.
When KEDE is equal to 0, the developer may be in a state of anxiety, as the challenges are too great.
On the other hand, when KEDE is equal to 1, the developer may be in a state of boredom, as the challenges are too low.
The optimal state is when KEDE is equal to 1/2, as this indicates a balance between questions and answers.
For this case we get:
The numerical value of balance in this case is one.
This state of KEDE = 1/2 is referred to as flow,
and it is characterized by a balance between the challenges of software development and the individual's capabilities.
Flow, as defined by Csikszentmihalyi, occurs at the boundary between boredom and anxiety, and is an optimal experience[33][34].
Flow is by definition an optimal experience,and is described as occurring rarely in regular life[34]
Many psychological constructs, such as happiness, anxiety, and self-efficacy,
represent continuous (i.e., spectrum and dimensional) constructs.
Despite the fact that Csikszentmihalyi and his colleagues have conceptualized and operationalized flow as a discrete construct,
a significant majority of studies have operationalized it as a continuous construct,
which can be applied to the full range of participants' experience across the spectrum of conscious experience[35].
That makes sense looking at the diagram of balance as a function of KEDE.
It is clear that for any value of 0 < KEDE < 1/2,
we have less balance than in the case KEDE = 1/2.
For the case of KEDE=0.1 we get:
This is the case of individual experience tending to anxiety, as its limiting case from the left.
It is also clear that for any value of 1/2 < KEDE < 1,
we again have less balance than in the case KEDE = 1/2.
For the case of KEDE=0.9 we get:
This is the case of individual experience tending to boredom, as its limiting case from the right.
In general, values of KEDE less than 1/2 indicate a lack of balance and a tendency towards anxiety,
while values greater than 1/2 indicate a lack of balance and a tendency towards boredom.
In both cases, the level of balance is less than in the case of KEDE=1/2.
Comparing lost information between developers
We can use Hlost as a metric to compare two different software developers.
Hlost, as we've defined it here,
represents the amount of information that was thought to be gained but was actually not due to incorrect answers.
A lower Hlost would indicate a more efficient or accurate software development process,
because it means less information was lost due to incorrect answers.
Here's how we might use it:
Calculate Hlost for each process For each process, calculate Hlost
using equation (10) based on the number of incorrect answers and the apparent reduction in missing information
that was initially thought to have been achieved with each incorrect answer.
Calculate Information Loss Rate (L)
Divide Hlost by the total perceived missing information for each process.
By normalizing by Hperceived,
we're essentially measuring the proportion of the total perceived missing information
that was due to incorrect or misleading information.
A lower value would indicate a more efficient process,
because it means a smaller proportion of the perceived missing information was due to incorrect or misleading information.
The formula would be:
(13)
This normalized metric allow us to compare the efficiency of different processes
even if they involve different numbers of questions or different initial entropies.
The initial missing information (Hinitial) for each process would typically be H(X),
which is the actual (objective) missing information of the system
representing the average minimum number of binary questions needed to reduce uncertainty to zero.
Let's consider the our example where we have two different levels of Waste: W=33% and W=67%.
Firts we calculate the Information Loss Rate (L) for the case where W = 33%.
This means that, on average, a loss of about 0.43 bits of information per question asked due to incorrect answers.
Next we calculate the Information Loss Rate (L) for the case where W = 67%.
This means that, on average, a loss of about 0.75 bits of information per question asked due to incorrect answers.
Appendix
KEDE and Ashby's Law of Requisite Variety
Ashby's Law of Requisite Variety
Ashby's Law of Requisite Variety states:
"Only variety can absorb variety."
In other words, a controlling system must have at least as many states (variety) as the system it aims to control. The principle highlights that, in order to effectively regulate or manage any system, your controlling system (or regulator) needs to match or exceed the complexity of the environment it interacts with.
Core Concepts:
Variety: The number of possible states within a system. Greater variety means greater complexity.
Regulation: The act of reducing uncertainty or complexity in a system.
Variety Amplification Increasing the regulator’s internal complexity, enhancing its ability to handle diverse situations.
Variety Attenuation Reducing the complexity or uncertainty of the regulated system to make it easier to control.
Expressed numerically, to achieve perfect regulation:
This law provides clear direction on how to manage complexity effectively - either increase internal capacity (variety amplification) or reduce external complexity (variety attenuation).
Ashby’s Law from an Information-Theoretic Perspective
In Information Theory, variety corresponds to entropy (H), measured in bits. Entropy quantifies uncertainty or complexity:
Now, Ashby’s law can thus be reformulated clearly:
The information-processing capacity (entropy) of a control system must be at least as large as the information (entropy) in the system it regulates.
Mathematically:
If this inequality doesn't hold, the regulator is incapable of responding effectively to every potential state or scenario the regulated system might assume. Simply put, a regulator needs enough information-processing capability to match the complexity (entropy) it faces.
Conditional Entropy and Mutual Information
In information theory, Ashby’s Law can be precisely expressed in terms of conditional entropy. Consider two key systems:
D: The system to be regulated (the controlled system).
R: The regulator (the controlling system).
Conditional entropy H(D∣R) measures the uncertainty that remains in the system after considering the regulator.
High H(D∣R) indicates poor regulation (significant uncertainty remains)
Low H(D∣R) implies effective regulation, ideally close to zero.
Ashby's Law can be succinctly expressed as:
Thus, in explicit form, Ashby’s Law becomes:
To effectively regulate a system, the regulator's variety must be sufficient to minimize the conditional entropy of the system being regulated:
Mutual information measures how much uncertainty is removed by the regulator:
A high mutual information indicates effective regulation, as the regulator substantially reduces uncertainty in the regulated system.
Practical Example: Finding a Hidden Gold Coin
Consider 64 equally sized boxes, one containing a hidden gold coin.
Without additional information, the uncertainty H(D) of the coin’s location is:
If we have prior knowledge that eliminates 32 boxes (meaning the coin is definitely not in these 32 boxes), the uncertainty is reduced from 6 bits to 5 bits:
The regulator (the knowledge that the coin isn't in those boxes) reduces uncertainty by:
Thus, the regulator reduces uncertainty by exactly 1 bit, effectively halving the possibilities.
Alternatively, we can compute mutual information using in terms of variety ratios (without explicitly using entropy first).:
Variety (as Ashby defined it originally) means simply the number of distinguishable states.
If a system can take 64 possible states, its variety is 64.
If a regulator can respond with 32 possible responses, its variety is 32.
Connecting KEDE to Ashby's Law
Ashby's Law in Information Theory states that an effective regulator minimizes H(D∣R).
H(D∣R) is measured in bits of information and can take values between 0 and infinity.
That is difficult to use for comparing efficiency in different contexts.
Using KEDE we convert the bits of information of H(D∣R) into an efficiency index:
KEDE effectively converts H(D∣R) into a bounded scale between 0 and 1. the higher the KEDE the better the regulator.
KEDE close to 1 means highly efficient or effective knowledge regulation.
KEDE close to 0 indicates poor regulation.
It's most sensitive around smaller values of H(D∣R), making it very suitable for distinguishing good regulators from excellent regulators.
Thus, the KEDE metric is:
Aligned with Ashby’s law: Lower conditional entropy H(D∣R) leads directly to higher KEDE, indicating better regulation.
Practical: Provides a single intuitive score that makes it easy to compare regulators in practice.
Well-behaved and bounded: No problematic behavior at extremes (easily interpretable).
KEDE directly reflects remaining uncertainty, making it ideal for practical regulation assessment.
The Information Content of Written English is 1 bit per character
The relationship between written English and information theory reveals an intriguing insight: writing 100 English characters conveys roughly the same number of possibilities as 100 bits of information.
This connection arises from the entropy of English, a measure of the average information in bits per character[37].
Although English includes around 50-100 distinct symbols (letters, punctuation, and spaces), the actual information carried by each character is lower due to redundancy and predictable patterns.
According to Claude Shannon[1], the effective entropy of English is approximately 1 bit per character, meaning each character narrows down the possibilities by a factor of 2.
As a result, 100 English characters offer 2100 distinguishable combinations, paralleling the possibilities provided by 100 bits in digital systems.
This relationship is an approximation based on empirical studies of English text and reflects the high redundancy in language (e.g., "th" is far more common than "zx"), and not all character combinations are valid sentences.
The remarkable equivalence of 1 bit per character underscores how language balances efficiency and redundancy, enabling humans to communicate effectively even with partial information.
Why KEDE and not H?
Let's see how KEDE and H change based on the same symbols typed S:
For instance when we have KEDE=0.2 which means 20 000 symbols
typed per work day then
H is:
When we have KEDE=0.01 which means 1000 symbols typed per work
day then
H
is:
When KEDE is 0.00001 which means 100 symbols typed per work day
then
H is:
When KEDE is 0.00001 which means 1 symbol typed per work day
then
H is:
It is better to use KEDE instead of
H for
quantifying efficiency of software knowledge discovery because H is a mathematical quantity that has many usages across sciences.
KEDE on the other hand as constrained by the maximum typing speed
of a human being.
That makes it specific for knowledge discovery processes that have typed symbols as
output.
Information Rate
The Information Rate, also known as Entropy Rate, is a measure of the average missing information or uncertainty per unit of time.
It is represented by R and is calculated using the rate at which messages are generated and the average missing information of a message.
Given that each message in our model contains only one symbol, we can simplify the formula as follows:
In this equation, the key concepts involved are:
R
is the Information Rate (or Source rate), which is the rate at which information is generated by the source,
typically measured in the number of bits of information per second.
In this context, a bit is not just a binary digit (0 or 1); it's a measure of information content.
It's based on the choice between two equally likely alternatives (like the flip of a fair coin).
So, when we say "bits per second," we're talking about how much information is being conveyed, not just the number of binary digits.
For example, an information rate of 10 Mbps (megabits per second) means that 10 million bits of information are transmitted each second.
r
is the Symbol Rate (or Baud Rate), which is the rate at which symbols are transmitted over a channel, typically measured in symbols per second (baud).
A symbol in this context is a distinct state or condition of the communication channel that can represent a certain amount of information.
H
is the Information per Symbol, which is the amount of information that can be represented by a single symbol.
It is typically measured in the number of bits of information per symbol.
The information per symbol is calculated by taking the log2(N),
where N is the number of distinct symbols or states the channel can represent.
For example, in a binary system, each symbol represents 1 bit of information, but in more complex systems, a symbol can represent more bits.
Information Rate is calculated as follows:
In Information Theory, while there isn't a specific theorem named for
the direct relationship between symbol rate, information per symbol, and information rate,
the concepts are fundamentally tied to the principles laid out by Claude Shannon, particularly in his seminal work, "A Mathematical Theory of Communication"[1].
The relationship between these quantities is a foundational aspect of information theory and digital communication.
To calculate the Information Rate in our model, we first define what constitutes a "unit of time".
In our model, each symbol (either a question 'q' or a symbol 's') occupies one unit of time t.
The total time T is nt units.
We divide the time series into S consecutive and non-overlapping subseries wi,
each containing one symbol and zero or more questions.
The rate r at which messages are generated is calculated as follows:
Here, t is the duration of each symbol, n is the number of time units, S is the number of messages (symbols), and T is the total time period (total number of time units in the time series).
The average missing information H of a message is given by formula (1). Using this and formula (2),
the Information Rate can be calculated as:
Here, the Knowledge discovered Q is the sum of the missing information of all messages in the time series. The terms t, n, S, and T have the same definitions as previously mentioned.
If we know the Information Rate (R) and the Symbol Rate (r), we can calculate the Information per Symbol (H), which is often related to the concept of entropy or average information in a symbol.
For example, if the Information Rate is 6 bits per second and the Symbol Rate is 3 symbols per second, then:
This means each symbol carries 2 bits of information.
This calculation assumes that the time series is stationary and ergodic, meaning the statistical properties of the time series do not change over time.
Example Information Rate calculation
Let's say the human can accept information from the external world at the rate of 10 bits per second.
Thye write down symbols at the rate of 5 symbols per scond.
What would be the Information rate (R), Symbol Rate (r), and Information per symbol (H)?
Based on the information provided, we can define the following parameters:
Human Information Acceptance Rate:
This is the rate at which a human can accept information from the external world. You've stated this is 10 bits per second.
This can be considered as the Information Rate (R) in this context.
Symbol Writing Rate:
This is the rate at which the human writes down symbols, given as 5 symbols per second. This is the Symbol Rate (or Baud Rate, r).
Now, let's define and calculate each term:
Information Rate (R):
This is already given as 10 bits per second. It's the rate at which the human can process information.
Symbol Rate (r):
This is also given as 5 symbols per second. It's the rate at which symbols are written down.
Information per symbol (H):
We can calculate the average amount of information per symbol, often referred to as "bits per symbol," using the information rate and the symbol rate. This calculation assumes that the information is evenly distributed across the symbols.
Information Rate calculation for the longest English word
Let's calculate Information Rate (R), Symbol Rate (r) and Information per symbol (H)
for the knowledge discovery process of the word “Honorificabilitudinitatibus” from here.
Let's first understand the data and assumptions provided:
The word "Honorificabilitudinitatibus" has been typed, and the typing process is represented by a sequence of 0s and 1s,
where "0" represents a time interval of uncertainty about what letter to type next,
and "1" represents a time interval with knowledge of the next letter to type.
The total time to generate the sequence is assumed to be 1 second.
Each "0" (uncertainty) is equivalent to searching among a number of equally sized boxes for the letter to type,
representing 1 bit of information gained when the letter is identified.
Each '1' represents 0 bits of information gained.
Now, let's calculate:
Total Symbols: Count the total number of symbols ("1"s) in the sequence.
By counting, we find there are 27 symbols in total.
Symbol Rate (r): Given the total time is 1 second,
the symbol rate is the total number of symbols divided by time (in seconds)or 27.0 symbols per second.
Information Bits:
we consider the information content of both '0's and '1's. Since '0's represent 1 bit and '1's represent 0 bits,
and there are 10 instances of "0" and 27 instances of "1" in the sequence,
we get (10x1 bits +27x0 bits) = 10 bits of information were needed throughout the typing process.
Information Rate (R): The total information bits divided by total time (in seconds).
The information rate is 10 bits per second, given the total time to type the sequence is 1 second.
Information per Symbol (H): The total information bits divided by the total number of symbols,
which is H=10/27=0.37 bits of information for each symbol in the sequence.
This analysis provides a quantitative view of the typing process for the word "Honorificabilitudinitatibus,"
framing it within the context of information theory concepts like information rate and symbol rate.
Bit Rate and Information Rate
There is a distinction between these two ideas. The bit rate is the advertised bit rate of a communications channel.
When we measure the rate of data transmission or processing, we use "bits per second."
This unit inherently refers to the transmission of binary digits per second.
For example, a data rate of 1 Mbps (megabit per second) means that 1 million binary digits (bits) are transmitted each second.
In the case of an ISDN B channel in Europe it is 64 000 bits per second.
Information rate is the rate at which information is passed over the channel.
The information rate can never be higher than the bit rate, but it might be lower.
An ISDN telephone transmits and receives 64 000 bits per second, even when there is total silence.
Total Information
In information theory, the total information of a sequence of symbols is derived from the fundamental concept of entropy, as defined by Claude Shannon. It represents the total quantity of information or the number of bits required to uniquely encode a sequence of symbols.
For a source that emits symbols from an alphabet of size (that is, there are possible symbols it can emit), each with equal probability, the entropy per symbol (average information content per symbol) is .
If the source emits
symbols,
the total entropy or total information content of that sequence of symbols is
.
This represents the number of bits required to uniquely encode and store the sequence of symbols, assuming an optimal encoding.
This is a direct application of the definition of Shannon entropy for a discrete uniform distribution.
For a uniform distribution, P(xi) = 1/N for all i, so this simplifies to H(X) = log2(N).
So the total entropy of a sequence of L independent samples from X is
L * H(X) = .,
which is the total information content of that sequence of symbols.
Modeling Information Rate Based On Behavior Output
Here we highlight the challenges and nuances in accurately estimating information rates, especially when dealing with tasks that involve either finely segmented real-time actions or complex step-by-step sequences
The way we calculate information rate, is based on behavior output
Our method of looking only at behavioral endpoints (i.e., task-specific tangible or motor outputs) and intentionally overlooks the sequence of actions leading up to them.
Why don't we incorporate intermediate states into the model?
Suppose we were able to bin actions so finely into smaller time segments, so that the bins are so short and visual feedback no longer influences output.
When actions are divided into very small time bins (e.g., milliseconds), the range of possible tangible or motor outputs within each bin shrinks dramatically.
For instance, in trail running, your foot's position in a few milliseconds is highly constrained compared to its position over a few seconds.
This reduced range leads to lower entropy (less uncertainty) in each bin, compensating for the smaller time interval.
The total information rate (entropy per bin divided by the bin duration) scales accordingly, ensuring the estimate remains proportional to the task's inherent complexity.
Similarly, when planning a step-by-step sequence each move results in a limited number of possible changes.
For instance, in tasks like solving a Rubik's cube, each move produces a limited set of possible new configurations, reflecting the constraints of the task's mechanics.
The total information required to solve the cube is less than the total entropy of all possible permutations because the solver follows a highly structured and optimized path.
Planning the solution involves collapsing many possible paths into one optimal sequence, reducing the apparent information content of the task when considered as a whole.
Why the Output-Based Approach Works
Assessing task-specific tangible or motor outputs over the entire time span provides a reasonable approximation of the information rate for the following reasons:
Efficient Representation: It captures the net information required to achieve the task, accounting for the constraints and optimization inherent in human performance.
Practicality: Measuring every intermediate state, micro-action, and feedback loop is often infeasible, especially in dynamic and complex tasks.
A focus on tangible or motor outputs balances accuracy with feasibility.
Scaling Properties: The scaling effects of finer binning are self-correcting because smaller bins correspond to smaller information changes.
The Hydraulic System Analogy
Measuring the information rate is like measuring the flow of water through a hydraulic system.
Even though the internal mechanics of the system i.e. pipes, pumps, and valves, may be complex,
the flow rate itself can be measured directly at the output, without needing to know every detail of what's happening inside.
Similarly, the brain;s internal processes - its billions of neurons and intricate neural networks,
are not modeled when calculating the information rate.
Instead, the focus is on the observable outputs: the decisions made, the symbols typed, or the actions taken.
Just as you measure water flow by observing its movement through an outlet, human information throughput is measured by observing the reduction in uncertainty between input and output.
This analogy underscores the simplicity and robustness of the model.
It doesn't require a detailed understanding of the brain's inner workings to calculate the information rate and Knowledge Discovery Efficiency (KEDE).
However, just as an unusually low water flow might prompt engineers to investigate the hydraulics,
the realization that human behavior operates at a constant rate invites deeper questions about exploring what this limit means for how we live and work.
Different Information and Symbol Rates
The sum of S and Q as measured in time
units equals the length n of the time series {x}:
To apply the formula in practice we need to select a value for the length n of the time series {x}.
We define r as the symbol rate of the symbols channel S .
r is measured in symbols per time unit t.
We also define R as the information rate of the questions channel Q measured in bits per time unit t.
Both rates can be calculated using the symbol duration time
t:
The total available time T spent asking Q questions and typing S symbols is implicitly contained in both Q and S.
It can be expressed explicitly as:
We can factor out a common term to express the total time T as a product of the total number of human actions and an effective rate per time unit t.
Define the weighted harmonic mean rate Reff as:
Then:
We generalize for the sum of questions Q, symbols S and the maximum symbol rate N.
(14)
However in our model we assume that the minimum symbol duration is one unit of time and is
equal to the time it takes to ask one question.
If that's the case, then in our time-series model, each human action (whether it's a question 'q' or a symbol 's') could be considered as occupying one unit of time t.
When the Information Rate R and Symbol Rate r are equal, say both are denoted as r, the formula for the weighted harmonic mean rate Reff simplifies significantly.
Factor out 1/r in the denominator:
Since the numerator and denominator contain the same term, they cancel out:
This means that if the rates for asking questions and typing symbols are identical, the combined rate of processing both actions is unchanged, and the total time simply follows:
Now we have the length n of the time series {x} defined in terms of the total available time T and symbol rate r.
We drop usage of n and instead from now on will be using N as maximum symbol rate.
1. Shannon, C. E. (1948). A Mathematical Theory of Communication. Bell System Technical
Journal.
1948;27(3):379-423. doi:10.1002/j.1538-7305.1948.tb01338.x
2. Drucker , Peter F, “Knowledge-Worker Productivity: The Biggest
Challenge,California
Management Review, vol. 41, no. 2, pp. 79–94, Jan. 1999, doi: 10.2307/41165987.x
3. Drucker , Peter F. (1959). The Landmarks of Tomorrow New York: Harper and Row, p.93.
4. Drucker , Peter F. (1993), Post-capitalist Society, Butterworth Heinemann, Oxford.
5, Cover, T. M. and Thomas, J. A. (1991), Elements of Information Theory, John
Wiley and Sons, New York. page.95 in 5.7 SOME COMMENTS ON HUFFMAN CODES
6. Ostry, D. J. (1983). Determinants of interkey times in typing. In W. E. Cooper (Ed.), Cognitive
aspects of skilled typewriting (pp. 225-246). New York: Springer-Verlag
7. Shaffer, L, H. (1976). Intention and performance. Psychological Review, 83, 375-393.
8. Shaffer, L. H. (1973). Latency mechanisms in transcription. In S. Kornblum (Ed.), Attention and performance IV (pp.
435-446). New York: Academic Press.
9. Ostry, D. J. (1980). Execution-time movement control. In G. E.
Stelmach & J. Requin (Eds.), Tutorials in motor behavior (pp. 457-468). Amsterdam: North-Holland.
10. Wheeler, J. A. (1990). Information, physics, quantum: The search for links. In W. H. Zurek (Ed.),
Complexity, entropy, and the physics of information (Vol. 8, pp. 3–28). Taylor & Francis.
11. Oral history interview with John Archibald Wheeler, 1967 April 5.
by Wheeler, John Archibald, 1911-2008
[Online]. Available: Transcript
16. Kaplan DM (2012) How to demarcate the boundaries of cognition. Biol Philos 27(4):545–570
17. Deming, W. Edwards. 2018. Out of the Crisis. The MIT Press. Cambridge, Mass
18. Kahneman, D. (2011). Thinking, fast and slow. Farrar, Straus and Giroux.
19. Kahneman D. (1973). Attention and Effort. Englewood Cliffs, NJ: Prentice-Hall
20. Senge, P.M. 1990: The Fifth Discipline , Random House, 1990
21. Keeley, Brian, 2007, “Human Capital, How What You Know Shapes Your Life,” OECD Insights, Paris
22. Baron, A. (2011), "Measuring human capital",
Strategic HR Review, Vol. 10 No. 2, pp. 30-35. https://doi.org/10.1108/14754391111108338
23. Carroll, Lewis, 2009, Through the Looking-Glass and What Alice Found There, Evertype
24. Ramírez, Y.W. and Nembhard, D.A. (2004), "Measuring knowledge worker productivity: A taxonomy",
Journal of Intellectual Capital, Vol. 5 No. 4, pp. 602-628. https://doi.org/10.1108/14691930410567040
25. Alves, R. A., Castro, S. L., & Olive, T. (2008). Execution and pauses in writing narratives : Processing time, cognitive effort
and typing skill. International Journal of Psychology.
26. Dhakal, V., Feit, A. M., Kristensson, P. O., & Oulasvirta, A. (2018). Observations on Typing from 136 Million Keystrokes.
In Proceedings of the 2018 CHI Conference on Human Factors in Computing Systems (pp. 1-12). Association for Computing Machinery. https://doi.org/10.1145/3173574.3174220
27. Holsbeeke, L., Ketelaar, M., Schoemaker, M. M., & Gorter, J. W. (2009). Capacity, Capability, and Performance: Different Constructs or Three of a Kind?
Archives of Physical Medicine and Rehabilitation, 90(5), 849–855. https://doi.org/10.1016/j.apmr.2008.11.015
28. Levitin, D. J. (2015). The Organized Mind: Thinking Straight in the Age of Information Overload (Illustrated edition). Dutton.
29. Wu, T., Dufford, A. J., Mackie, M. A., Egan, L. J., & Fan, J. (2016). The Capacity of
Cognitive Control Estimated from a Perceptual Decision Making Task. Scientific
Reports, 6, 34025.
30. Bruce K. Britton, Abraham Tesser,
Effects of prior knowledge on use of cognitive capacity in three complex cognitive tasks,
Journal of Verbal Learning and Verbal Behavior,
Volume 21, Issue 4,
1982,
Pages 421-436,
ISSN 0022-5371,
https://doi.org/10.1016/S0022-5371(82)90709-5.
31. Phillip G. Armour. 2004. Beware of counting LOC. Commun. ACM 47, 3 (March 2004), 21–24. https://doi.org/10.1145/971617.971635
32. Armour, P.G. (2003). The Laws of Software Process, Auerbach
33. Csikszentmihalyi, M. 1990. Flow: the psychology of optimal experience. United States of America: Harper & Row.
34. Csikszentmihalyi, M 1975. Beyond Boredom and Anxiety: The Experience of Play in Work and Games. San Francisco: Jossey-Bass
35. Abuhamdeh S (2020) Investigating the “Flow” Experience: Key Conceptual and OperationalIssues. Front. Psychol. 11:158.doi: 10.3389/fpsyg.2020.00158
36. Guan, Q., Wang, J., Chen, Y., Liu, Y., & He, H. (2021). Beyond information rate, the capacity of cognitive control predicts response criteria in perceptual decision-making. Brain and cognition, 154, 105788. https://doi.org/10.1016/j.bandc.2021.105788
37. Shannon CE. Prediction and Entropy of Printed English. Bell System Technical Journal. 1951;30(1):50-
64. _eprint: https://onlinelibrary.wiley.com/doi/pdf/10.1002/j.1538-7305.1951.tb01366.x. Available from:
https://onlinelibrary.wiley.com/doi/abs/10.1002/j.1538-7305.1951.tb01366.x.
38. Zheng, J., & Meister, M. (2024). The unbearable slowness of being: Why do we live at 10 bits/s?. Neuron.
39. Shannon, C. E. Communication theory of secrecy systems. Bell System technical Journal, 28, 656-715, 1949