Output and Outcome in software development
What is the difference and how to use it?
How to measure productivity?
"The knowledge worker does not produce something that is effective by itself. He does not produce a physical product—a ditch, a pair of shoes, a machine part. He produces knowledge, ideas, information." ~ Peter Drucker [1]
Productivity in software development, measures outcome per bit of knowledge discovered:
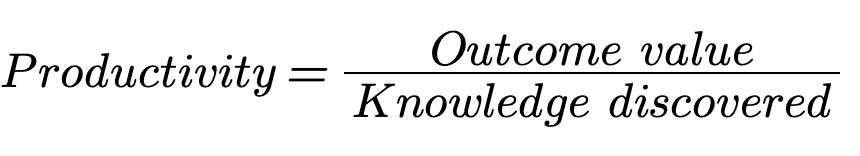
We improve productivity when we increase outcome and/or reduce knowledge discovered in order to get the outcome.
But what is the "outcome" of knowledge work in general and software development in particular? We first need to present the difference between output and outcome:
-
Output is everything physical produced between the initial idea and delivery.
-
Outcome is what happens when the output is delivered to the customer.
- Impact is the benefit your organization, and the world, gets when lots of people use your product.
Outcome is a change in human behavior (of end user or customer) that drives business results. Outcomes are things that people do that are observable and measurable.
Hence output can be used as a leading indicator, and outcome as the final result. Outputs can be used as intermediate goals towards the final goal i.e. the outcome[2]. As an example, if the desired outcome is to reduce the defects by 60% the output estimate can be 100 more new unit tests.
Knowledge workers discover knowledge in order to produce tangible output. They discover knowledge by asking questions. If the output we search for is a gold coin hidden in one of 8 equally sized boxes we need to ask a minimum of 3 questions on average. If the output we search for is $100 billion hidden in one of 8 equally sized boxes we also need to ask a minimum of 3 questions on average. Of course, the market values some output more than others. In general, finding $100 billion is valued more than finding a gold coin. That means the same number of questions could bring different outcomes.
That's why with KEDE we analyze not the outcome but how efficiently the knowledge needed to get the outcome was discovered.
Physical output
There are several attempts to define the output of software development in terms of physical objects.
First is to count Source Lines of Code (SLOC). It is a software metric used to measure the size of a computer program by counting the number of lines in the text of the program's source code. SLOC is typically used to predict the amount of effort that will be required to develop a program, as well as to estimate programming productivity or maintainability once the software is produced. However, the functionality developed is less well correlated with SLOC. Skilled developers may be able to develop the same functionality with far fewer lines of code, so one program with fewer SLOC may provide more functionality than another similar program. The Constructive Cost Model (COCOMO) is a procedural software cost estimation model based on counting SLOC.
Another method is Function Point Analysis. The functional user requirements of the software are identified and each one is categorized into one of five types: outputs, inquiries, inputs, internal files, and external interfaces. Once the function is identified and categorized into a type, it is then assessed for complexity and assigned a number of function points. There are several recognized standards and/or public specifications for sizing software based on Function Point such as SO/IEC 29881:2010 and ISO/IEC 24570:2018. Some of the function point variations include IFPUG[6], COSMIC, NESMA.
Yet another method is to use as output the number of:
- features
- user stories
- story points
- deployments
- pull requests
- commits
Measuring functionality is a way to look at the direct output of software development, but true output is something else.
That is because not all functionality is alike. Some of it is useful to the customer. Some of it is never used! However, even useful functionality isn't the true measure. Some functionality leads to $10 million extra profit for the customer and another only leads to $5 million.
What is the major problem? It is fundamentally the confusion between effectiveness and efficiency that stands between doing the right things and doing things right.
There is surely nothing quite so useless as doing with great efficiency what should not be done at all[1].
In software development the source code is not the goal. Producing lines of code is not the point. Function points are not the point. A software can crank out code line after code line, but if customers don't use the output, then it doesn't matter how much they've cranked out. The point is to create value, to deliver valuable outcomes.
Hence the view that any true measure of software development productivity must be based on outcome value[7].
Outcome value
“…your job is to minimize output, and maximize outcome and impact.” ~ Jeff Patton[10]
Software development is product development. The main question we ask ourselves is “what makes a product great?” We hope the people who buy and use our products would say things like:
- Easy to use
- Solves a problem
- Fun to use
- Saves time
Sometimes developers can achieve an outcome without developing a lot of new source code. Instead they may use an existing library or an open source project. In this case with less output they can achieve the same outcome. It is well accepted that less code means more value. One of the agile principles syas Simplicity--the art of maximizing the amount of work not done--is essential.”. That considers source code (output) as essentially waste that needs to be minimized. We can use a metaphor and compare the size of the code with the length of the road and the outcome with the target destination. It is clear that the shorter the distance the better. Since the longer the distance the longer the time spent traveling we can replace distance with time. Time in this case is a measurement of the work put in. The outcome is the result achieved i.e. the value added from developing the new feature.
As a corollary, it can be argued that software developers are not selling their time to the employer. Instead they are selling the value they provide. For example, if developing a new feature on an ecommerce site takes 40 hours, the developer productivity is not 40 hours of labor, but the outcome from the feature added to the site. A corollary of the above logic: if a software developer automates their work they should expect the same compensation even though they put in less time to produce the same value[4].
In many organizations outcomes are not well defined. The business, and/or product management has not clearly identified outcomes or value before engaging a team in doing the work. There are at least three perspectives on value delivered or outcome value:
- Customer perceived value
- Business value
- Technical value
Customer perceived value
Perceived value is a customer's own perception of a product or service's merit or desirability to them, especially in comparison to a competitor's product[8]. The customer values a product's benefit higher than its function. For example, a customer doesn't buy a gym membership, but they hope to reduce weight or get in shape. Developers create a product/service to help customers/users do something better, faster, more productively, nicer, happier, ...
Customer perceived value and customer satisfaction are two distinct yet complementary constructs. However, value and satisfaction tap different dimensions. Customer satisfaction should be measured as an effective construct, while customer value is best conceptualized as a cognitive variable. Perceived value includes both functional and non-functional aspects. Thus customer perceived value comprises process value, which is perceived during the process of service delivery, and outcome value, which is perceived at the conclusion of the service[5].
Then developers do know that there is a difference between what the customer wants and what they really need.
There is no foolproof method for the developers to understand what a customer needs vs. wants. This doesn't happen until the developers are truly capable of understanding the domain or problem in full. That's why initially developers give the customer what they want. Then the developers wait for them to use it and to tell what they actually need. Rinse and repeat - the whole point of the Iterative feedback loop.
The most popular metric for measuring customer experience is Net Promoter Score (NPS). NPS is calculated using the answer to a key question, using a 0-10 scale: How likely is it that you would recommend [brand] to a friend or colleague?
Respondents are grouped as follows:
- Promoters (score 9-10) are loyal enthusiasts who will keep buying and refer to others, fueling growth.
- Passives (score 7-8) are satisfied but unenthusiastic customers who are vulnerable to competitive offerings.
- Detractors (score 0-6) are unhappy customers who can damage your brand and impede growth through negative word-of-mouth. Subtracting the percentage of Detractors from the percentage of Promoters yields the Net Promoter Score, which can range from a low of -100 (if every customer is a Detractor) to a high of 100 (if every customer is a Promoter).
Value to the users is not equal to income / bottom line. Value is what users / clients deem valuable. You create value hypotheses (business), then implement them (development) and highlight them (marketing).
As an example let's look at how Citibank was trying to make $7.8M in interest payments, but it sent $900M instead[9].
On August 11, Citibank was supposed to send out interest payments totaling $7.8 million to these creditors. On Flexcube, the easiest (or perhaps only) way to execute the transaction—to pay the Angelo Gordon Lenders their share of the principal and interim interest owed as of August 11, 2020, and then to reconstitute the 2016 Term Loan with the remaining Lenders—was to enter it in the system as if paying off the loan in its entirety, thereby triggering accrued interest payments to all Lenders, but to direct the principal portion of the payment to a "wash account"—"an internal Citibank account... to help ensure that money does not leave the bank."
The actual work of entering this transaction into Flexcube fell to a subcontractor in India. He was presented with a Flexcube screen that looked like the below:
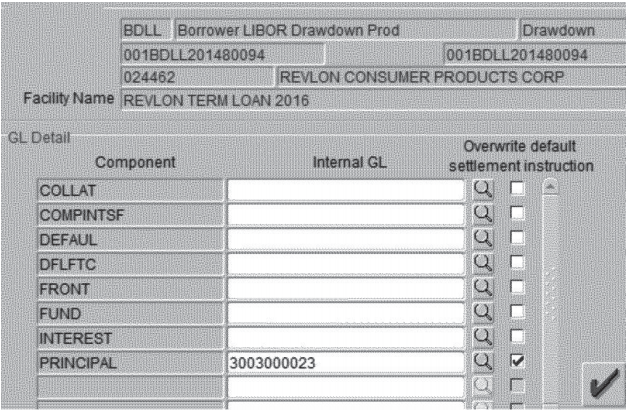
The subcontractor thought that checking the "principal" checkbox and entering the number of a Citibank wash account would ensure that the principal payment would stay at Citibank. He was wrong. To prevent payment of the principal, the subcontractor actually needed to set the "front" and "fund" fields to the wash account as well as "principal." The subcontractor didn't do that.
Citibank's procedures require that three people sign off on a transaction of this size. In this case, that was the subcontractor, a colleague of his in India, and a senior Citibank official in Delaware. All three believed that setting the "principal" field to an internal wash account number would prevent payment of the principal. As he approved the transaction, the Delaware supervisor wrote: "looks good, please proceed. Principal is going to wash."
But the principal wasn't going to wash. When the subcontractor conducted a routine review the next morning, he noticed there was something drastically off about the previous day's figures. Citibank had actually sent out almost $900 million, not the $7.8 million it was trying to send.
Business value
There are outcomes that matter most for a business :
- Increased Revenue
- Reduced Cost
- Increased Market Share
- Protected Revenue
Business value is often referred to as "impact".
For startups it is common to track increase in revenue as Monthly Recurring Revenue (MRR). As an example, let's look at a small startup who shared their journey from a financial performance perspective. It took the startup 324 days to reach $400 MRR since they got their first paying subscriber. Then things got a bit crazy. It took them just nine months to go from $400 to $10k MRR. Then, ten months after the $10k MRR milestone, they were at $41k MRR. The graph below shows their MRR growth.
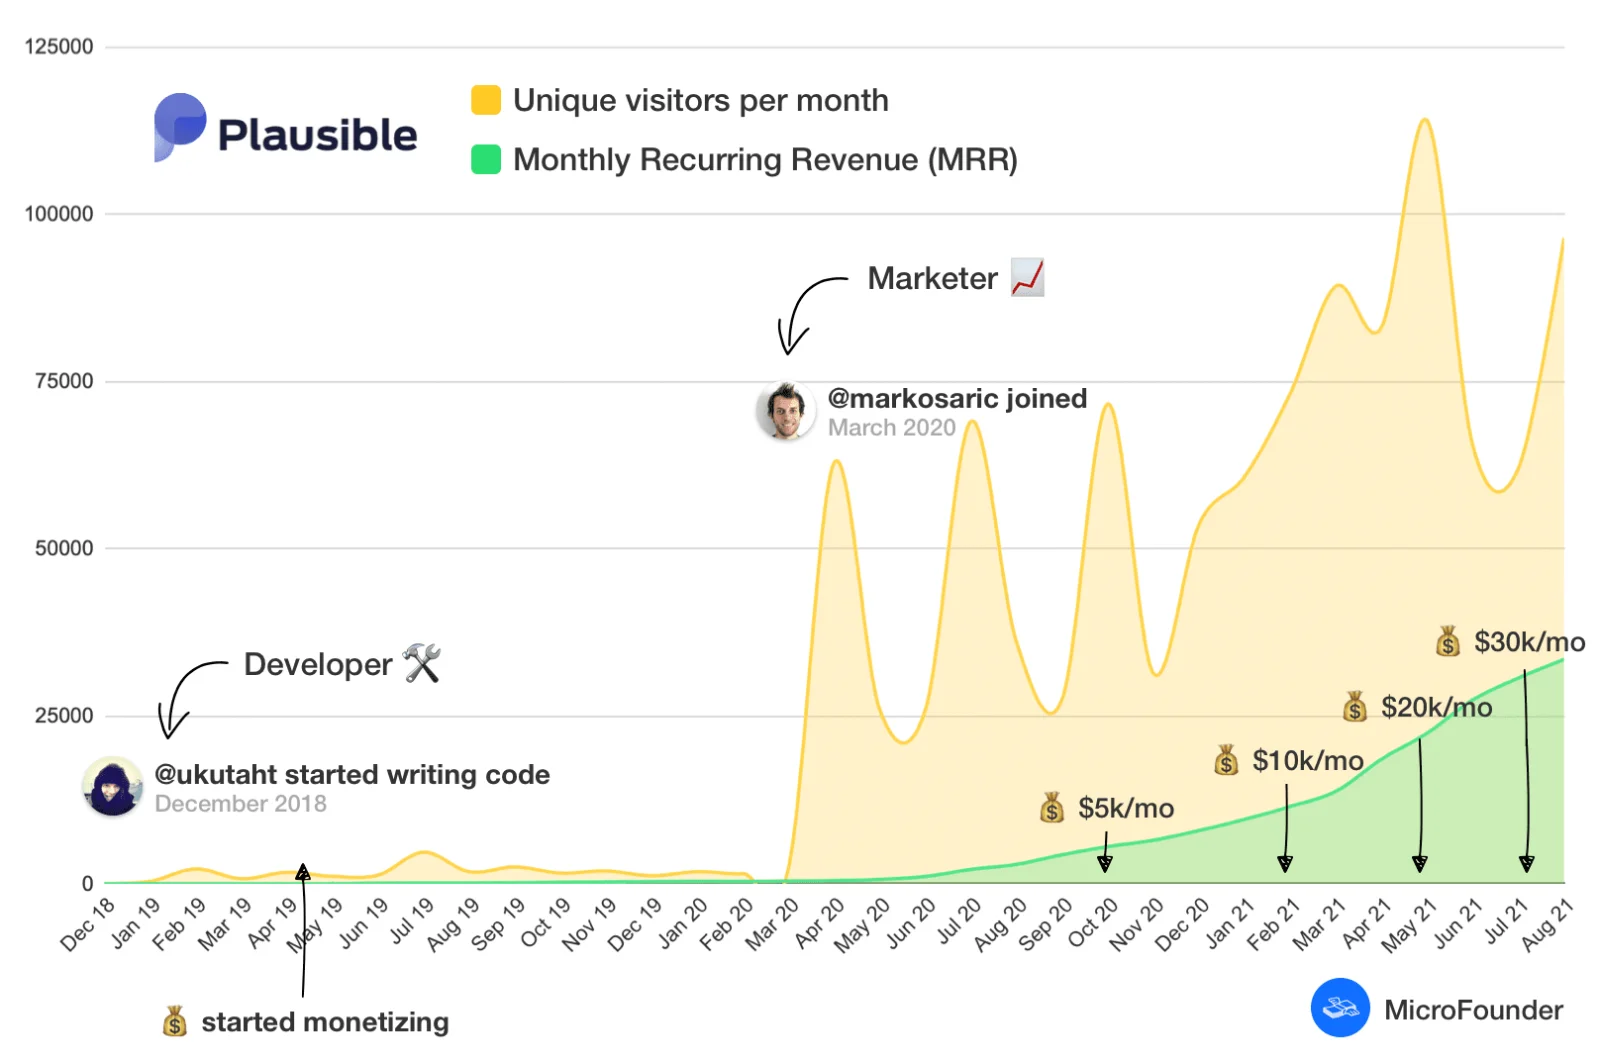
What happened in April 2020 with that first big spike? Well, the first thing is that the second founder joined. He is not a developer, but...a marketing professional to focus on the marketing side of the startup. They published a blog post and it got the attention of Hacker News with more than 50,000 people reading the post. As they say:
"Obviously, in the year and a half since then, we've put a lot of effort into improving our product, the infrastructure and several other blog posts have helped us along the way, but we wouldn't be where we are today without that first standout post."[3]
The graph shows that often tracking MRR is not the proper way to measure how developers add value to a business. That is because to measure value by income to the company, you need a way to directly measure developers' contribution to the bottom line. This is nearly impossible with marketers and developers whose work effects are delayed and mixed with other factors. Features implemented weeks or months ago could affect MRR today. You won't really know some changes work until you've already got a decent number of customers going through different stages of their customer journey.
Technical value
Then there is value to the developers in how the solution was developed.
One of the criteria often used is the size of the code. Where is writing less code better than writing more code?
It is generally accepted that a good definition of elegant programming is a source that efficiently provides a solution with a minimum amount of code. The old saying goes less is more in the coding world. It's always best to write the most efficient program with the least amount of code. That is, bad programmers tend to write big, convoluted, sloppy code. Good programmers write tight, efficient, and clear code. Indeed, sometimes shorter code is more concise and elegant, perhaps based on a particularly well-chosen collection of information structures used internally. Less code is easier to view, maintain, and update. It also takes up less space. Less code means there are fewer places for mistakes to hide.
On another hand, Less code is not always cleaner code. It might turn into an unreadable mess if you attempt to minimize code too far. For example, running code through a minimizer makes your code smaller, but it becomes unreadable. Unreadable is bad and implies un-debuggable, which is more bad. Sometimes the extra code is legible, explicit, structured, easier to understand and to refactor. It provides additional fault resistance, error recovery, useful logging, or smarter algorithms which might execute more rapidly. The extra code мaybe comments and documentation which will help later maintainers figure out how the program is designed, and why it was designed that way.
The best source size very much depends on the context. In particular, smaller code size is almost invariably better in embedded systems. Embedded systems have processors, just as regular PCs do. However, they usually have very limited space for program code and data, and rather small amounts of RAM by comparison. In such a context developers are sometimes needed to spend a whole day rewriting code to reduce already extremely tight coding by the two further bytes necessary to fit it exactly into storage.
There is also a scientifically based perspective on what makes a good code defined by its cyclomatic complexity. Cyclomatic complexity is a measurement developed by Thomas McCabe to determine the stability and level of confidence in a program. It measures the number of linearly-independent paths through a program module. The fewer the paths through a piece of code, and the less complex those paths are, the lower the Cyclomatic Complexity. Programs with lower Cyclomatic complexity are easier to understand and less risky to modify. The simple interpretation is that the cyclomatic complexity is an upper bound for the number of test cases required to obtain branch coverage of the code.
If we try to summarize then a possible ranking of Levels of value could be:
- Level 1: Writing code that works
- Level 2: Writing code that does what the customer wants
- Level 3: Writing code that does what the customer needs
- Level 4: Writing code that does what the customer needs today and your co-workers can understand and maintain. In other words, it is easy to change.
Works Cited
1. Drucker, P. (2018). Essential Drucker. Routledge.
2. Is the Distinction Between Outcomes and Output Overdone?
3. How we bootstrapped our open source Google Analytics alternative to $500k ARR
4. Is it unethical for me to not tell my employer I’ve automated my job?
5. Eggert, A. and Ulaga, W. (2002), "Customer perceived value: a substitute for satisfaction in business markets?", Journal of Business & Industrial Marketing, Vol. 17 No. 2/3, pp. 107-118. https://doi.org/10.1108/08858620210419754
6. International Function Point Users Group
7. Fowler , Martin (2003) CannotMeasureProductivity
9. Citibank just got a $500 million lesson in the importance of UI design
10. Patton, J, Economy, P. (214) "User Story Mapping: Discover the Whole Story, Build the Right Product"
Getting started


