The Mathematics of Knowledge Discovery Efficiency (KEDE)
This is a short read. Here is the detailed version.
KEDE definition
Knowledge is a dynamic construct shaped by human inquiry, creativity, and interaction. It evolves through the systematic refinement of conjectures and the elimination of errors, evolving toward greater understanding. To measure knowledge, we interpret knowledge through the perspective of information theory.
Work comprises cognitive and manual labor. Manual labor involves physical effort to produce tangible results, while cognitive labor requires thinking and decision-making to address the essential questions of "what," "how," and "why" a task is performed.[2]:
- What needs to be done?
- How should it be done?
- Why is it being done?
Each of these questions can be broken down into increasingly detailed sub-questions. This process continues until a clear understanding is reached, enabling the individual to proceed with manual labor. Importantly, cognitive labor always precedes manual labor because tasks require planning, decision-making, or problem-solving before execution.
For each task, Required Knowledge represents the complexity of the task, i.e. what must be known to complete it, while Prior Knowledge refers to the skills, experience, and understanding an individual already possesses. The gap between these two is the Knowledge to Be Discovered. It represents what the individual thinks they don't know, given what they think they do know. Any uncertainty or need for additional clarity about a task implies the existence of some form of a knowledge gap - even if it is small or subtle.
Questions are the cognitive tools we use to close knowledge gaps. Questions arise only when there is Knowledge to Be Discovered. The existence of any question implies a perceived gap in knowledge, understanding, or certainty. Whether the gap is large (fundamental knowledge is missing) or small (details need confirmation or alternatives are being explored), the act of questioning reflects the Knowledge work i.e. the effort to bridge that gap. Conversely, if an individual believes they know everything necessary about a task, there is no uncertainty, and no questions arise.
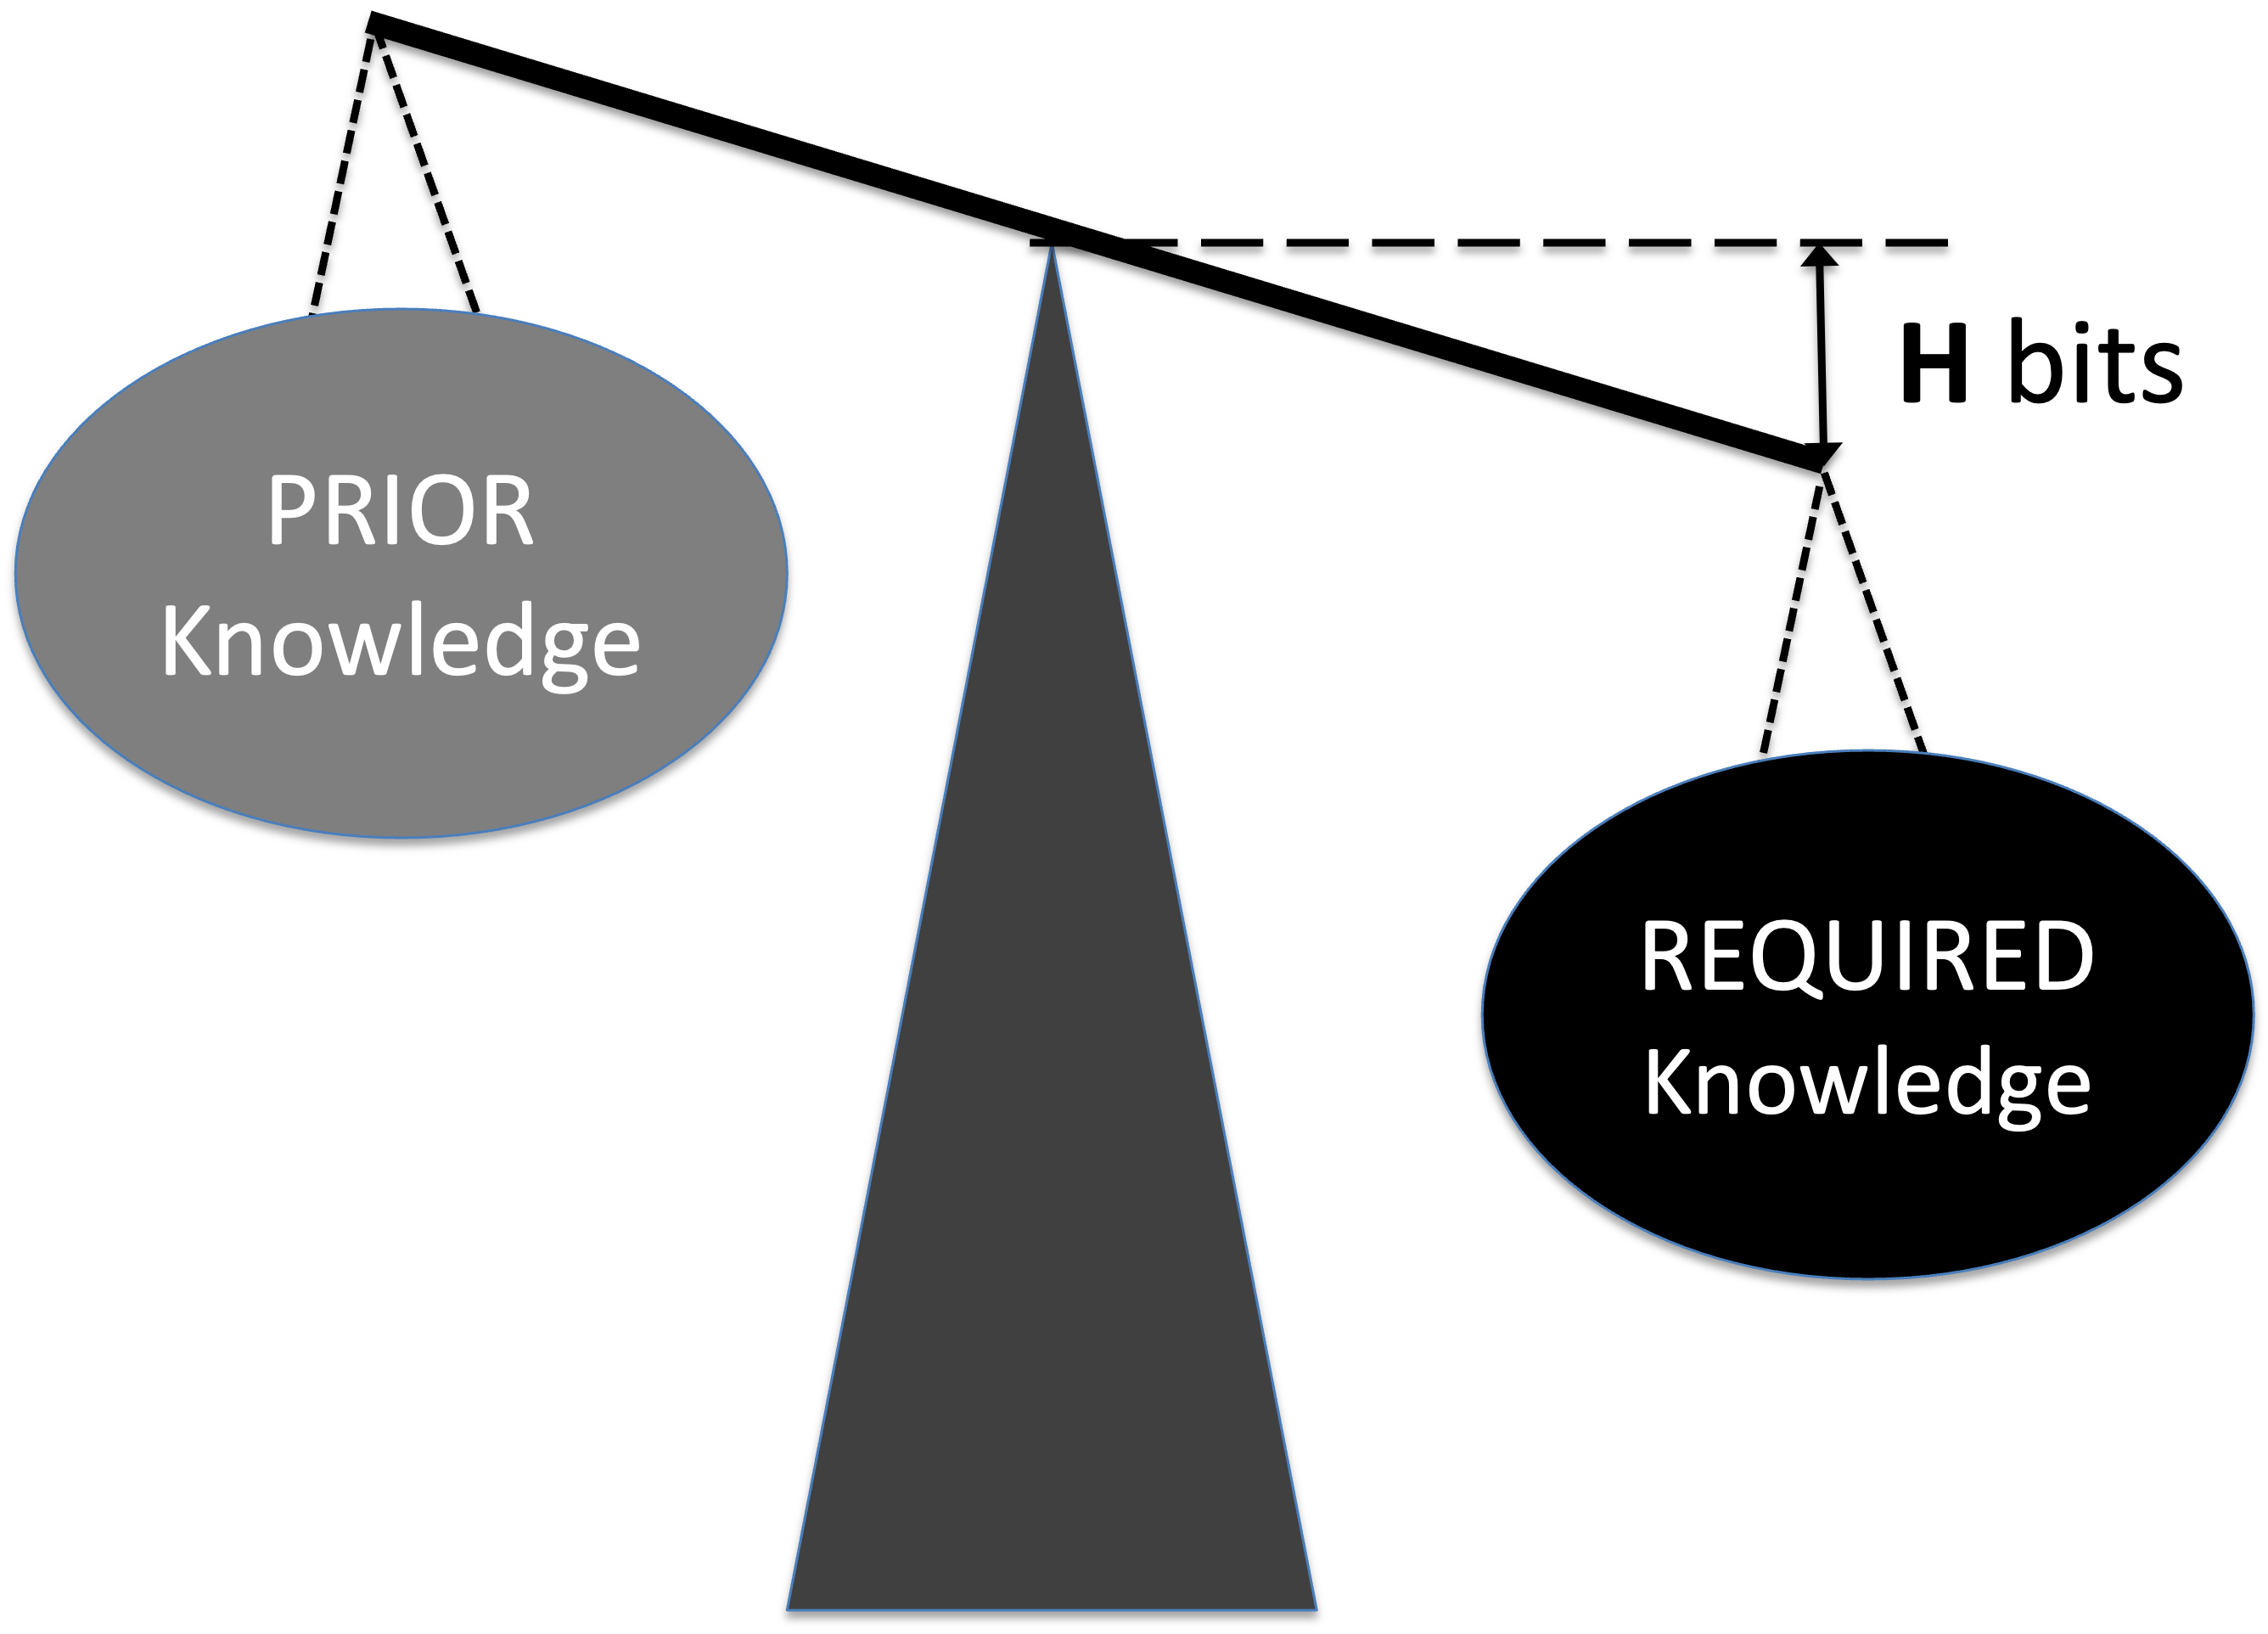
- Imagine a scale: on one side is the required knowledge and on the other is the prior knowledge.
- They will be balanced if they are equal, implying that the knowledge to be discovered equals zero.
- When balanced, no further knowledge is needed; when imbalanced, knowledge acquisition is required.
- The gap H between required and prior knowledge is the Knowledge to Be Discovered.
To measure knowledge, we interpret knowledge through the perspective of information theory.
The complexity of a task, as perceived by an individual, is defined as the "required knowledge" or total unconditional missing information H(X), An individual's perceived capabilities, or "prior knowledge" is defined as the mutual information I(X:Y). The "knowledge to be discovered" is the conditional information H(X|Y) - what the individual lacks about the task before starting it.
A Knowledge Discovery Process transforms invisible knowledge into visible, tangible output. To learn more about it, please refer to this article. The quality of the output is assumed to meet target standards.
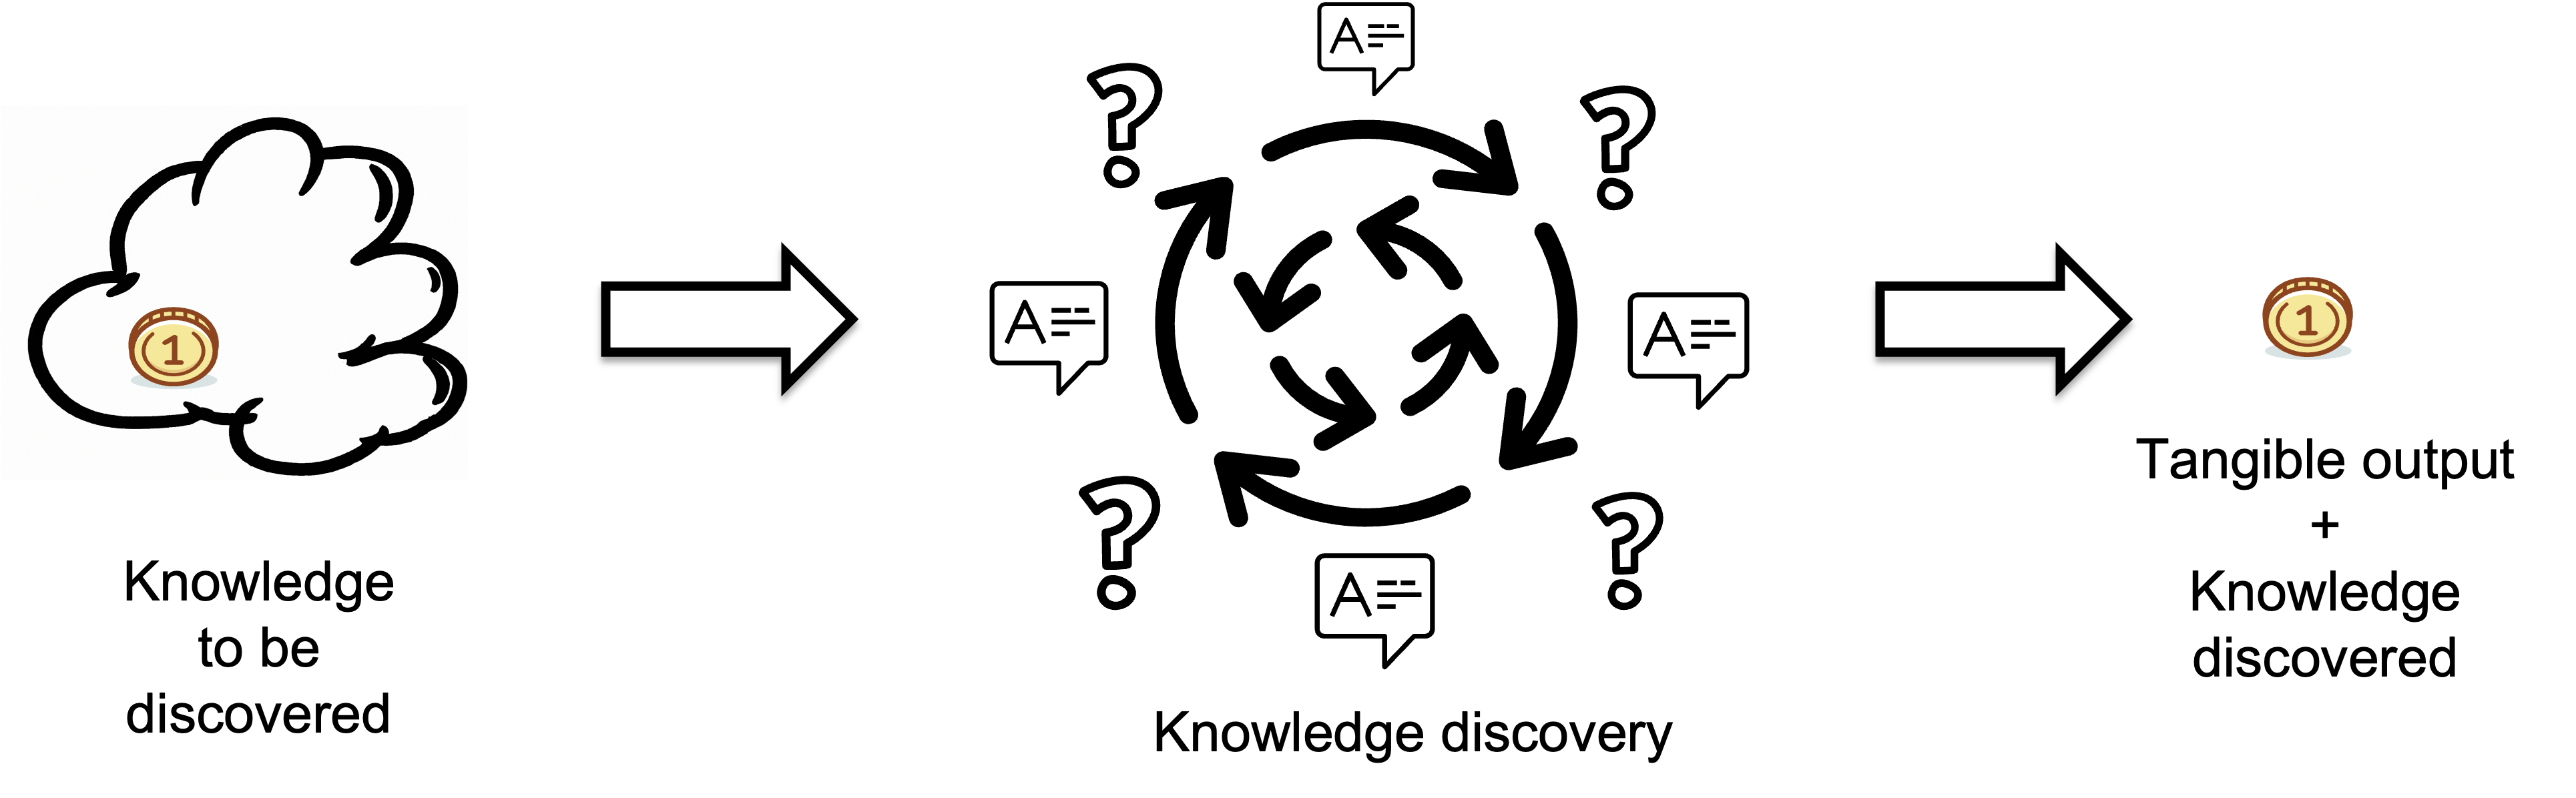
Inputs represent the knowledge individuals lack before starting a task i.e. the missing information or knowledge that needs to be discovered, which is measured in bits.
The Knowledge to Be Discovered is measured in bits of information and can take values between 0 and infinity. That is difficult to use for comparing efficiency in different contexts. Using mathematics we convert the bits of information H into an efficiency index and define a new metric called KEDE (KnowledgE Discovery Efficiency). It is pronounced [ki:d].
KEDE effectively converts the knowledge to be discovered H(X|Y), which can range from 0 to infinity, into a bounded scale between 0 and 1. The higher the KEDE the less knowledge to be discovered.
KEDE quantifies the knowledge software a person didn't have prior to starting a task, since it is this lack of knowledge that significantly impacts the time and effort required.
Calculating KEDE
To calculate KEDE for a knowledge discovery process, we need to find the missing information H in bits.
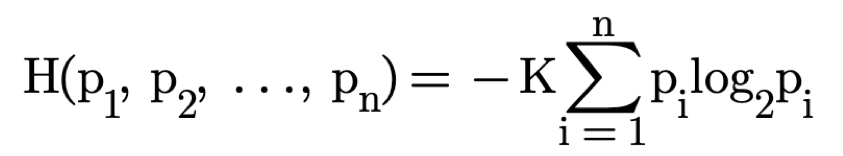
Consider finding a gold coin among 64 boxes using binary ("Yes" or "No") questions, like if the coin is in the specified half of the boxes.
The missing information H equals the average number of questions needed to locate the coin, typically 6 for this example.
Below is an animation of calculating KEDE when we search for the gold coin.
Example of a Human Knowledge Discovery Process
In real life, unlike the gold coin, we can't precisely calculate the knowledge discovered H because the "number of boxes" n and their "size" pi are unknown. The process of knowledge discovery is like a black box, with questions that individuals ask themselves or others being invisible and uncountable. This uncertainty makes it impossible to apply Shannon's formula directly.
To navigate this, we follow the scientific principle that emphasizes reliance on observable facts. We gauge the knowledge discovery process by measuring the tangible output, such as the code produced, as a proxy for the invisible questions asked. This approach allows us to estimate the average number of questions, or H, based on the quantity of code generated over time.
An illustrative example of inferring H from observable output is analyzing the typing of the word “Honorificabilitudinitatibus” from Shakespeare's “Love's Labour's Lost.” This 27-letter word, notable for its alternating consonants and vowels, serves as a practical demonstration of measuring knowledge discovery through direct, observable actions.
At the end of the exercise I have the word “Honorificabilitudinitatibus” written down and along with it a sequence of zeros and ones. The "1"s represent existing knowledge; the "0"s, represent the knowledge gap.
|
|
|
H | o | n | o | r |
|
i | f | i | c | a | b | i |
|
|
l | i | t |
|
|
u | d | i |
|
n | i |
|
|
|
t | a | t | i | b | u | s |
|---|---|---|---|---|---|---|---|---|---|---|---|---|---|---|---|---|---|---|---|---|---|---|---|---|---|---|---|---|---|---|---|---|---|---|---|---|---|
| 0 | 0 | 1 | 1 | 1 | 1 | 1 | 0 | 1 | 1 | 1 | 1 | 1 | 1 | 1 | 0 | 0 | 1 | 1 | 1 | 0 | 0 | 1 | 1 | 1 | 0 | 1 | 1 | 0 | 0 | 0 | 1 | 1 | 1 | 1 | 1 | 1 | 1 |
In the exercise above we witnessed the discovery and transformation of invisible knowledge into visible tangible output.
We can now calculate the knowledge discovered by dividing the total number of questions asked by the total number of symbols. Here H = 11/27 = 0.41 questions per symbol or 0.41 bits of information. The KEDE score is 71.
Measuring KEDE in software development
To calculate the Knowledge Discovery Efficiency (KEDE) in software development, we consider the source code as a long string of symbols. The exact length of this string varies with the context, programming language, and technology used. To address this variability, we rely on two natural limits: the cognitive capacity of the human brain[7] and the maximum human typing speed[6].
We define N as the maximum number of symbols that could be produced in a time interval, assuming that the minimum symbol duration is one unit of time and is equal to the time it takes to ask one question.
This assumption is grounded in research indicating that:
- Asking questions is an effortful task that precludes simultaneous typing[3]. If a symbol was not typed, then a question was asked. This implies that the question rate is equivalent to the symbol rate, as explained here.
- The maximum typing speed for humans is approximately 4.2 symbols per second[8][9][10].
- The capacity of cognitive control of the human brain is around 3 to 4 bits per second, and since we equate one question to one bit of information, this translates to 3 to 4 questions per second[7].
To align the symbol rate with the cognitive capacity, we set a maximum symbol rate N at 100,000 symbols per 8 hours of work, resulting in a symbol duration time t of 0.288 seconds. This yields a symbol rate r of 3.47 symbols per second, fitting within the cognitive control range of the human brain.
From this, we generalize the following relation for the sum of questions Q, symbols S and the maximum symbol rate N
(1)
Here Q represents the total number of questions asked in a time interval, and S is the total number of symbols produced for the same time interval.
The KEDE theorem is derived from the aforementioned principles:
(2)
Here, H denotes the amount of missing information, N represents the maximum possible symbols that could be produced within a given time frame, S is the actual number of symbols produced in that time frame, and W stands for the probability of waste.
This theorem bridges the gap between measurable output S and theoretical concepts of information H, using N as a constant to represent ideal knowledge discovery efficiency.
To apply KEDE in practice, S is directly counted from source code files, while N is defined as the total possible symbols a developer can produce in a working day, considering an 8-hour day and a specific symbol rate (r).
Here h is the number of working hours in a day and CPH is the maximum number of symbols that could be contributed per hour. In order to obtain a maximum symbol rate CPH of 100,000 symbols per 8 hours of work, a symbol rate r of 3.47 symbols per second, an eight-hour workday, and a CPH of 12,500 symbols per hour are defined..
When we substitute in (2) this formula for N, it becomes:
(3)
When we substitute (3) in (1) and convert the KEDE equation into percentages, it becomes:
(4)

- Minimum value of 0 and maximum value of 100.
- KEDE approaches 0 when the missing information is infinite, which is the case when humans create new knowledge, as exemplified by intellectuals like Albert Einstein and startups developing new technologies like PayPal.
- KEDE approaches 100 when the missing information is zero, which is the case for an omniscient being, such as God.
- KEDE is higher when software developers apply prior knowledge instead of discovering new knowledge.
- anchored to the natural constraints of the maximum possible typing speed and the cognitive control of the human brain, supporting comparisons across contexts, programming languages and applications.
For an expert full-time software developer who mostly applies prior knowledge but also creates new knowledge when needed, we would expect a KEDE value of 20.
Importantly, the KEDE theorem isn't tied to the absolute values of typing speed or cognitive capacity. Instead, it's based on the ratio between the manual work done and the manual work that could theoretically be done given the cognitive constraints. The value of N, or the maximum symbol rate, is used as a constant to represent an idealized, maximum efficiency over a standard work interval (such as an 8-hour workday). The specific values used for maximum typing speed and cognitive capacity are not the core components of the theorem itself; they are parameters that give context and allow for the application of the theorem to real-world scenarios. Changes in research would prompt adjustments in the constant N but would not necessitate a change in the structure or application of the theorem itself.
Flow as a Function of Skill-Challenge Balance
Flow is a state of optimal experience that generates feelings of happiness and enjoyment[4][5]. Flow states are commonly referred to in many ways in society, such as "wired in," "in the groove," "in the moment," and "the zone." Research indicates that flow experiences represent a distinct state that can be identified not only through self-report data but also through physiological measures
The output of a knowledge discovery process has only two possible outcomes: symbols S and questions Q), with probabilities KEDE and (1-KEDE), respectively, as explained here For calculating the balance between questions and symbols we use Shannon's formula[1]
(5)
In this case, p1 = KEDE and p2 = (1-KEDE) and the Balance function of one variable is:
(6)
Figure below shows the function Balance(KEDE).
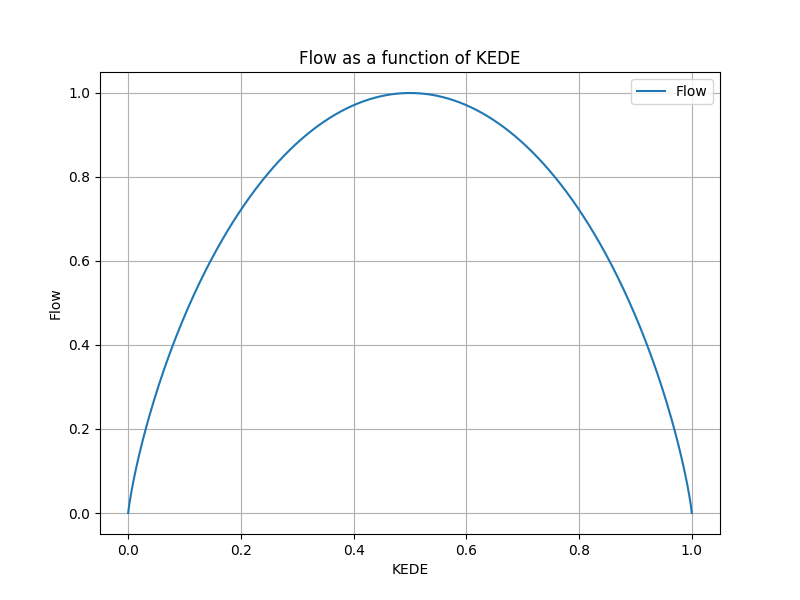
The balance function is always positive, concave (or concave downward), and has a maximum value at KEDE = 1/2. It is zero at both KEDE = 0 and KEDE = 1.
We assume that the number of questions Q reflects the complexity of the work, and the number of symbols produced S reflects the individual capabilities of a individual. When they are in balance the individual is in a state called flow.
Flow is characterized by a balance between the challenges of software development and the individual's capabilities. According to Csikszentmihalyi, it occurs at the boundary between boredom and anxiety, and is an optimal work experience[4][5].
The maximum value of the balance function is one when KEDE is equal to 1/2, as this indicates a balance between questions and answers. When KEDE is equal to 0, the individual may be in a state of anxiety, as the challenges are too great. On the other hand, when KEDE is equal to 1, the individual may be in a state of boredom, as the challenges are too low. In general, values of KEDE less than 1/2 indicate a lack of balance and a tendency towards anxiety, while values greater than 1/2 indicate a lack of balance and a tendency towards boredom. In both cases, the level of balance is less than in the case of KEDE=1/2.
Flow as a Function of Knowledge Discovered
We can express Flow not only as a function of the frequency of questions asked, but also as a function of the average knowledge discovered per symbol.
Given the relationship
(7)
We calculate H using the KEDE theorem :
The below diagram shows you how the Flow as a function of H for H > 0.
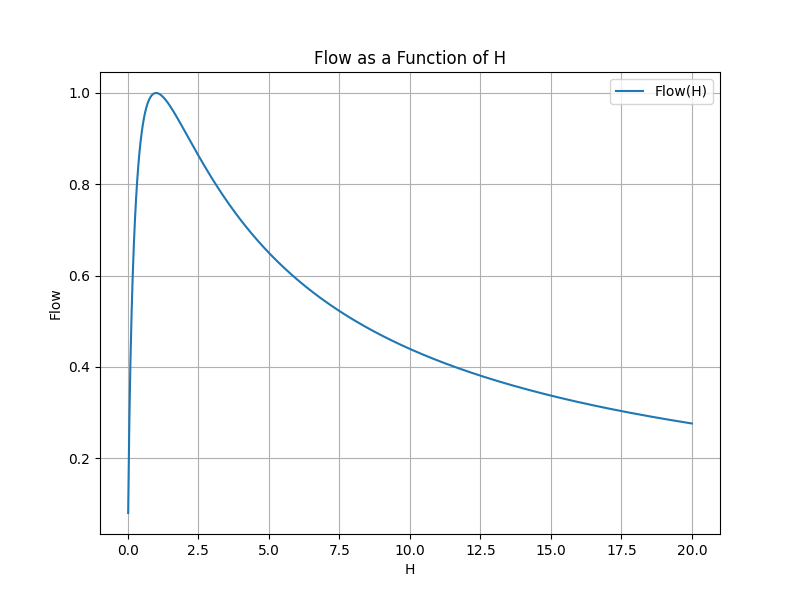
On the x-axis we have the H value ranging from 0 to 20. On the y-axis we have Flow value.
The curve is skewed to the right. The state of Flow is achieved at H=1 bit. To the left o thet Flow state there is a narrow range of H between 0 and 1, which is the state of Boredom. To the right of Flow there is a wide range of anxiety.
We see that there are many ways to be anxious and just a few ways to be bored or in the Flow.
What is the value of knowing KEDE?
The value of knowing KEDE is that it allows for quantifying the human capital of any organization, as well as Indicators such as Collaboration, Cognitive Load, Happiness (Flow State), Productivity(Value per Bit of information Discovered), and Rework (Information Loss Rate). They present a multidimensional view of the individual work experience and the software development process efficiency.
KEDE is a general form of a metric for knowledge work. That means for each specific context we have to define a specific way to calculate KEDE. For instance, if we do the knowledge work of a surgeon then both the knowledge discovered and the maximum amount of knowledge that could possibly be discovered need to be measured in a specific way.
Due to its general definition KEDE can be used for comparisons between organizations in different contexts. For instance to compare hospitals with software development companies! That is possible as long as KEDE calculation is defined properly for each context. In what follows we will define KEDE calculation for the case of knowledge workers who produce textual content in general and computer source code in particular.
How to cite:
Bakardzhiev D.V. (2021) The Mathematics of Knowledge Discovery Efficiency (KEDE) https://docs.kedehub.io/kede/what-is-kede-short-math.html
Works Cited
1. Shannon, C. E. (1948). A Mathematical Theory of Communication. Bell System Technical Journal. 1948;27(3):379-423. doi:10.1002/j.1538-7305.1948.tb01338.x
2. Drucker , Peter F, “Knowledge-Worker Productivity: The Biggest Challenge,California Management Review, vol. 41, no. 2, pp. 79–94, Jan. 1999, doi: 10.2307/41165987.x
3. Kahneman D. (1973). Attention and Effort. Englewood Cliffs, NJ: Prentice-Hall
4. Csikszentmihalyi, M. 1990. Flow: the psychology of optimal experience. United States of America: Harper & Row.
5. Csikszentmihalyi, M 1975. Beyond Boredom and Anxiety: The Experience of Play in Work and Games. San Francisco: Jossey-Bass
6. Dhakal, V., Feit, A. M., Kristensson, P. O., & Oulasvirta, A. (2018). Observations on Typing from 136 Million Keystrokes. In Proceedings of the 2018 CHI Conference on Human Factors in Computing Systems (pp. 1-12). Association for Computing Machinery. https://doi.org/10.1145/3173574.3174220
7. Wu, T., Dufford, A. J., Mackie, M. A., Egan, L. J., & Fan, J. (2016). The Capacity of Cognitive Control Estimated from a Perceptual Decision Making Task. Scientific Reports, 6, 34025.
8. Shaffer, L. H. (1973). Latency mechanisms in transcription. In S. Kornblum (Ed.), Attention and performance IV (pp. 435-446). New York: Academic Press.
9. Ostry, D. J. (1980). Execution-time movement control. In G. E. Stelmach & J. Requin (Eds.), Tutorials in motor behavior (pp. 457-468). Amsterdam: North-Holland.
10. Dhakal, V., Feit, A. M., Kristensson, P. O., & Oulasvirta, A. (2018). Observations on Typing from 136 Million Keystrokes. In Proceedings of the 2018 CHI Conference on Human Factors in Computing Systems (pp. 1-12). Association for Computing Machinery. https://doi.org/10.1145/3173574.3174220
Getting started


