A mathematical theory of the state of Flow
A knowledge-centric approach
Abstract
Flow is a state of optimal experience that generates feelings of happiness and enjoyment. Flow states are commonly referred to in many ways in society, such as "wired in," "in the groove," "in the moment," and "the zone." Research indicates that flow experiences represent a distinct state that can be identified not only through self-report data but also through physiological measures
This article introduces a novel mathematical model to quantify the Skill-Challenge Balance, essential for achieving a Flow state, through the lens of information theory. It contrasts with existing models this approach addresses the balance between an individual's perceived capabilities (prior knowledge) and task challenges (knowledge to be discovered), offering a refined method for identifying Flow states.
The model uses mutual information (I(X;Y)) and conditional missing information (H(Y|X)) to define the balance essential for flow. The balance function, governed by the Knowledge Discovery Efficiency (KEDE), quantifies the alignment between a person's capabilities and task complexity. An optimal KEDE value of 1/2 suggests a perfect balance, indicative of flow, while values deviating from this point suggest tendencies towards anxiety or boredom.
This model not only enriches our theoretical understanding of Flow but also holds practical implications for enhancing workplace productivity and well-being. It paves the way for future research and practical applications, encouraging the development of strategies and tools to help individuals and organizations better achieve and sustain flow states. Ultimately, this work contributes to a deeper appreciation of the psychological and informational dynamics at play in achieving optimal experiences in professional settings.
What is Flow?
Flow is a state of optimal experience that generates feelings of happiness and enjoyment. Flow states are commonly referred to in many ways in society, such as "wired in," "in the groove," "in the moment," and "the zone."
Research indicates that flow experiences represent a distinct state that can be identified not only through self-report data but also through physiological measures[13]. The key characteristics of a person experiencing flow include:
- A sense of loss of self-consciousness.
- A perception of time passing faster.
- A sense of control over one's actions, as increased capabilities reduce the margin of error.
- A state of security and relaxation with the complete absence of worry.
Individuals who have experienced flow often wish to replicate the activity, regardless of whether it provides material rewards or not. This suggests that flow is an optimal experience that facilitates the fulfillment of individual potential.
The Skill-Challenge Balance and Flow
According to Csikszentmihaly, flow appears at the boundary between boredom and anxiety, when the challenges are balanced with the individual's capabilities[1][2].
The relation between the skill-challenge balance and optimal flow is classically understood by means of the “channel model” depicted in the image below.
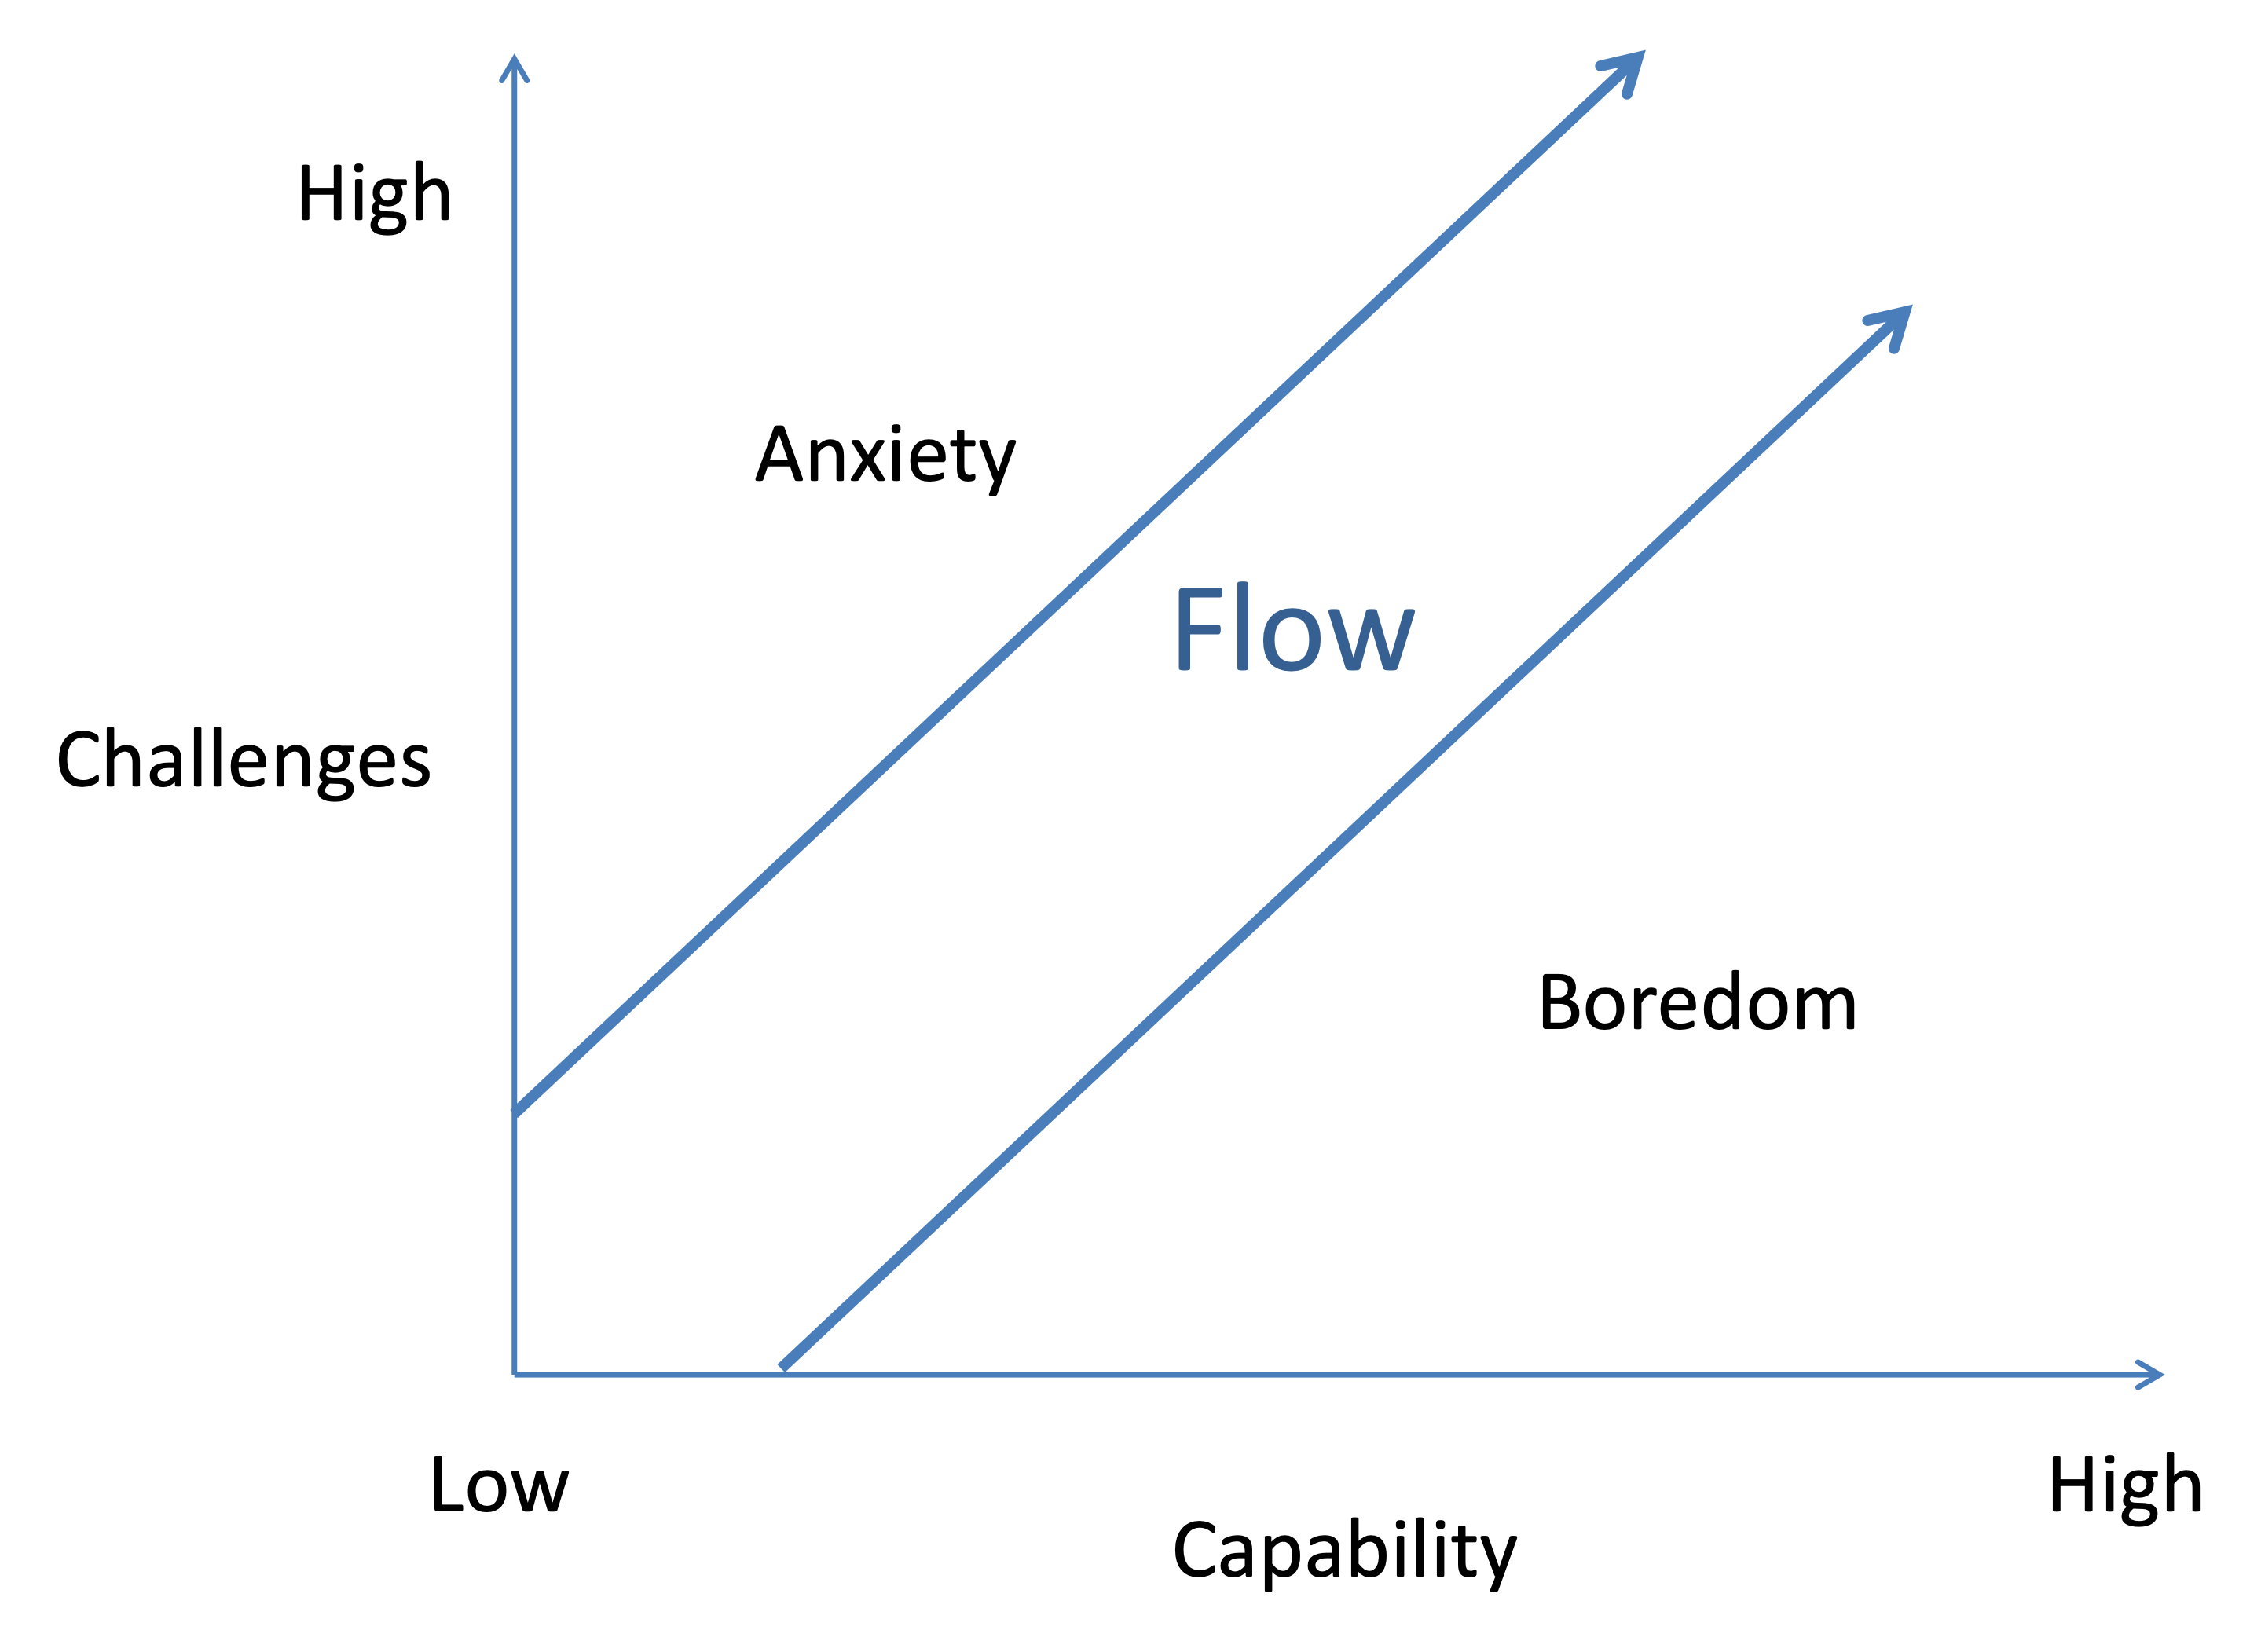
- Graph Axes: X = personal capability; Y = challenge (task)
- FLOW: a balance between an individual's perceived skills and the perceived challenges
- Boredom: Low challenge, high capability — If challenges are too low, one gets back to Flow by increasing them.
- Anxiety: High challenge, Low capability — If challenges are too great, one can return to the Flow state by reducing the challenge or developing new capabilities.
The model posits entering a flow state depends on finding a balance between an individual's perceived skills and the perceived challenges of a task. In other words, the individual's capability should match the complexity of the work. Numerous studies have shown that when skill and challenge are approximately equal, flow is experienced[15][16][17][18][19][20][21][22]. In the channel model, it does not matter at what level of skill and challenge players are at. Even for beginners with little skill, so long as they are playing an easy game, flow should be experienced since their minimal skill is matched by the minimal challenge of the game. Controlled experiments have shown that optimal challenges lead to flow[10]. This is why flow is considered to be intrinsically motivating, rather than extrinsically motivating: the motivation comes from within the activity[5]. Moreover if flow is a highly motivating state[19][20], then even relatively novice players should be motivated to keep playing right from the introduction to a new game.
An alternative to the classic model of flow is what can be described as a quadrant model of flow as presented in the image below.
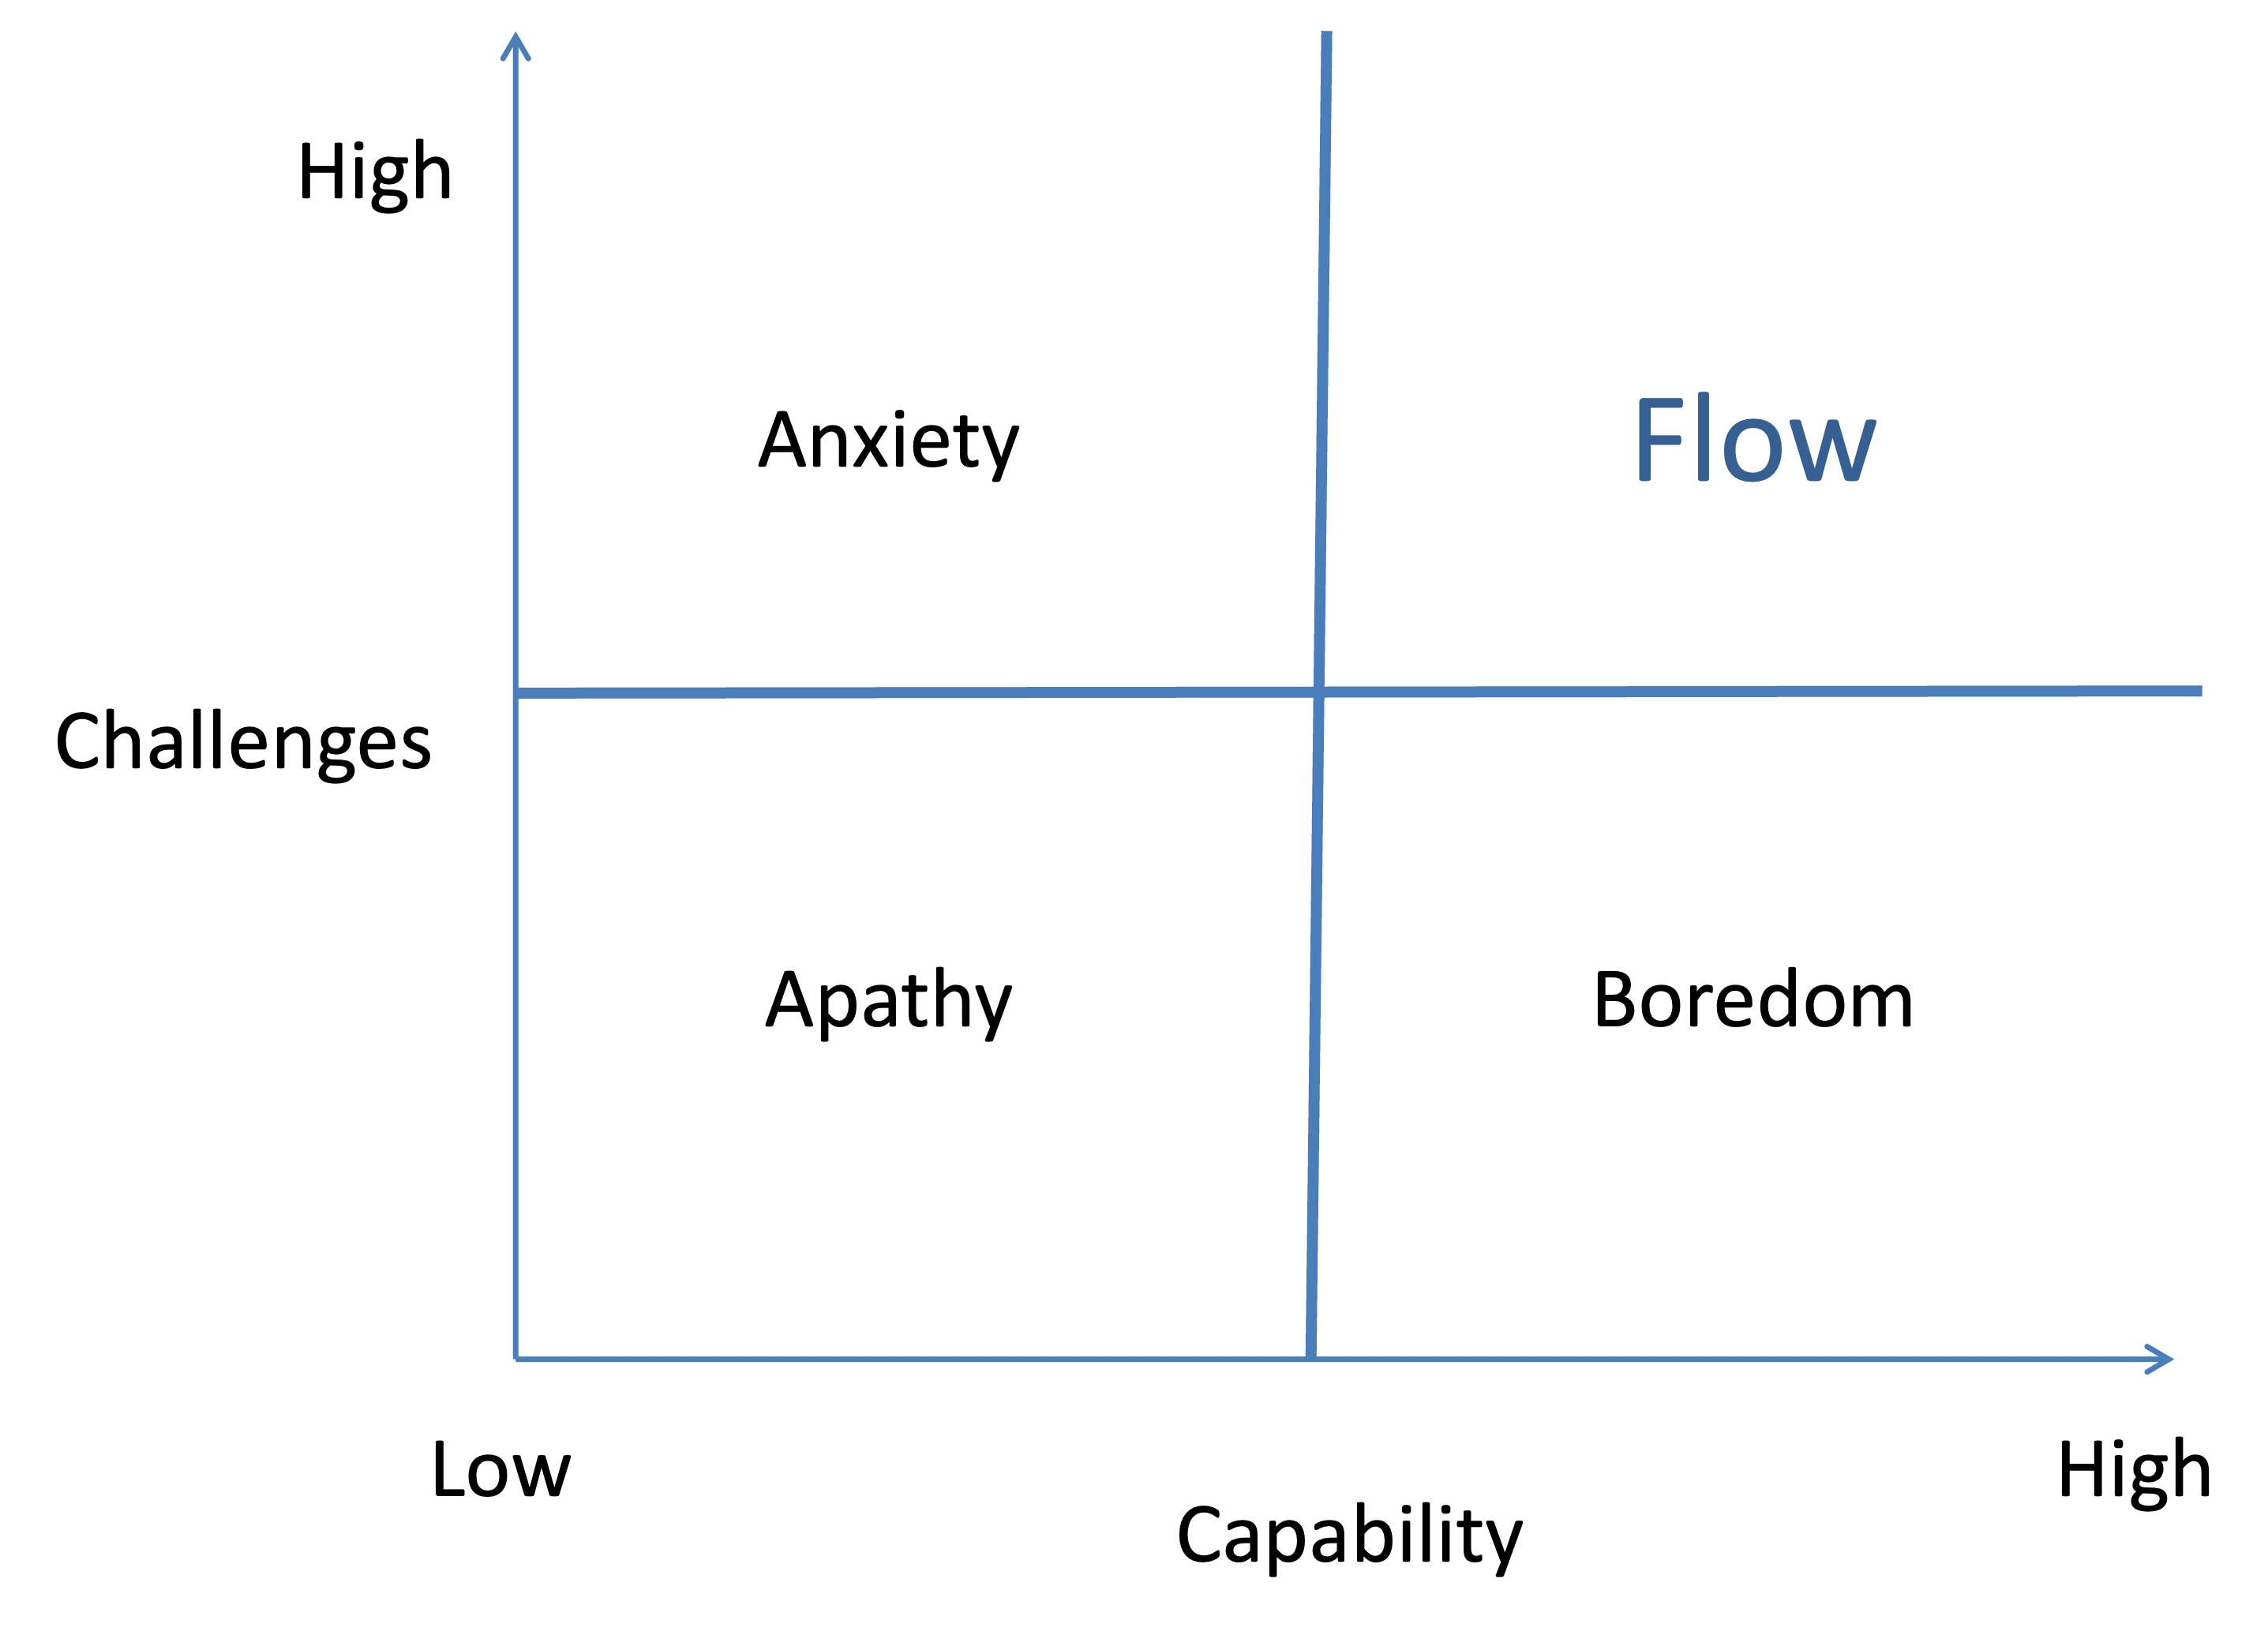
- Graph Axes: X = personal capability; Y = challenge (task)
- FLOW: High challenge, high capability — "the goal".
- Apathy: Low challenge, low capability. — A general lack of interest in the task at hand.
- Boredom: Low challenge, high capability — If challenges are too low, one gets back to Flow by increasing them.
- Anxiety: High challenge, Low capability — If challenges are too great, one can return to the Flow state by reducing the challenge or developing new capabilities.
In this model, flow is experienced only when players feel that they have reached a high level of skill (offset by a high level of challenge). The quadrant model posits that the balance between challenge and skill does not always lead to optimal flow[23][24][25][26]. For players who feel they have minimal skill and are playing what they feel is a minimally challenging game, apathy rather than flow should ensue. In the quadrant model it does matter at what level of skill and challenge players are at. Players who have played more frequently to develop their skill are at a point where they can take on higher game demands confidently. These players would fall in the “optimal flow” quadrant of the model. By contrast, novice players may not enter flow as easily as they are focusing on building fundamental skills and becoming familiar with a game environment by playing minimally challenging (yet balanced) levels. Novices would thus land in the “apathy” quadrant.
Another alternative is the skill-challenge balance model. Empirical support for the notion that flow within video games is engendered by the balance of challenge and skill comes from studies which manipulate how challenging the game is by increasing or decreasing the speed at which players must play. When speed of play is manipulated, an inverted-U relation between the perceived skill-challenge balance and flow is produced[15][16][17][18][19][20][21][22][27], Specifically, optimal flow is produced when the speed-based demands matches the player's skill, and less flow ensues when skills far exceed demands (e.g., slow-paced and too easy). Similarly, less flow also ensues if the demands far exceed skills (e.g., far too fast-paced and hence too difficult). These relations are depicted in the image below.
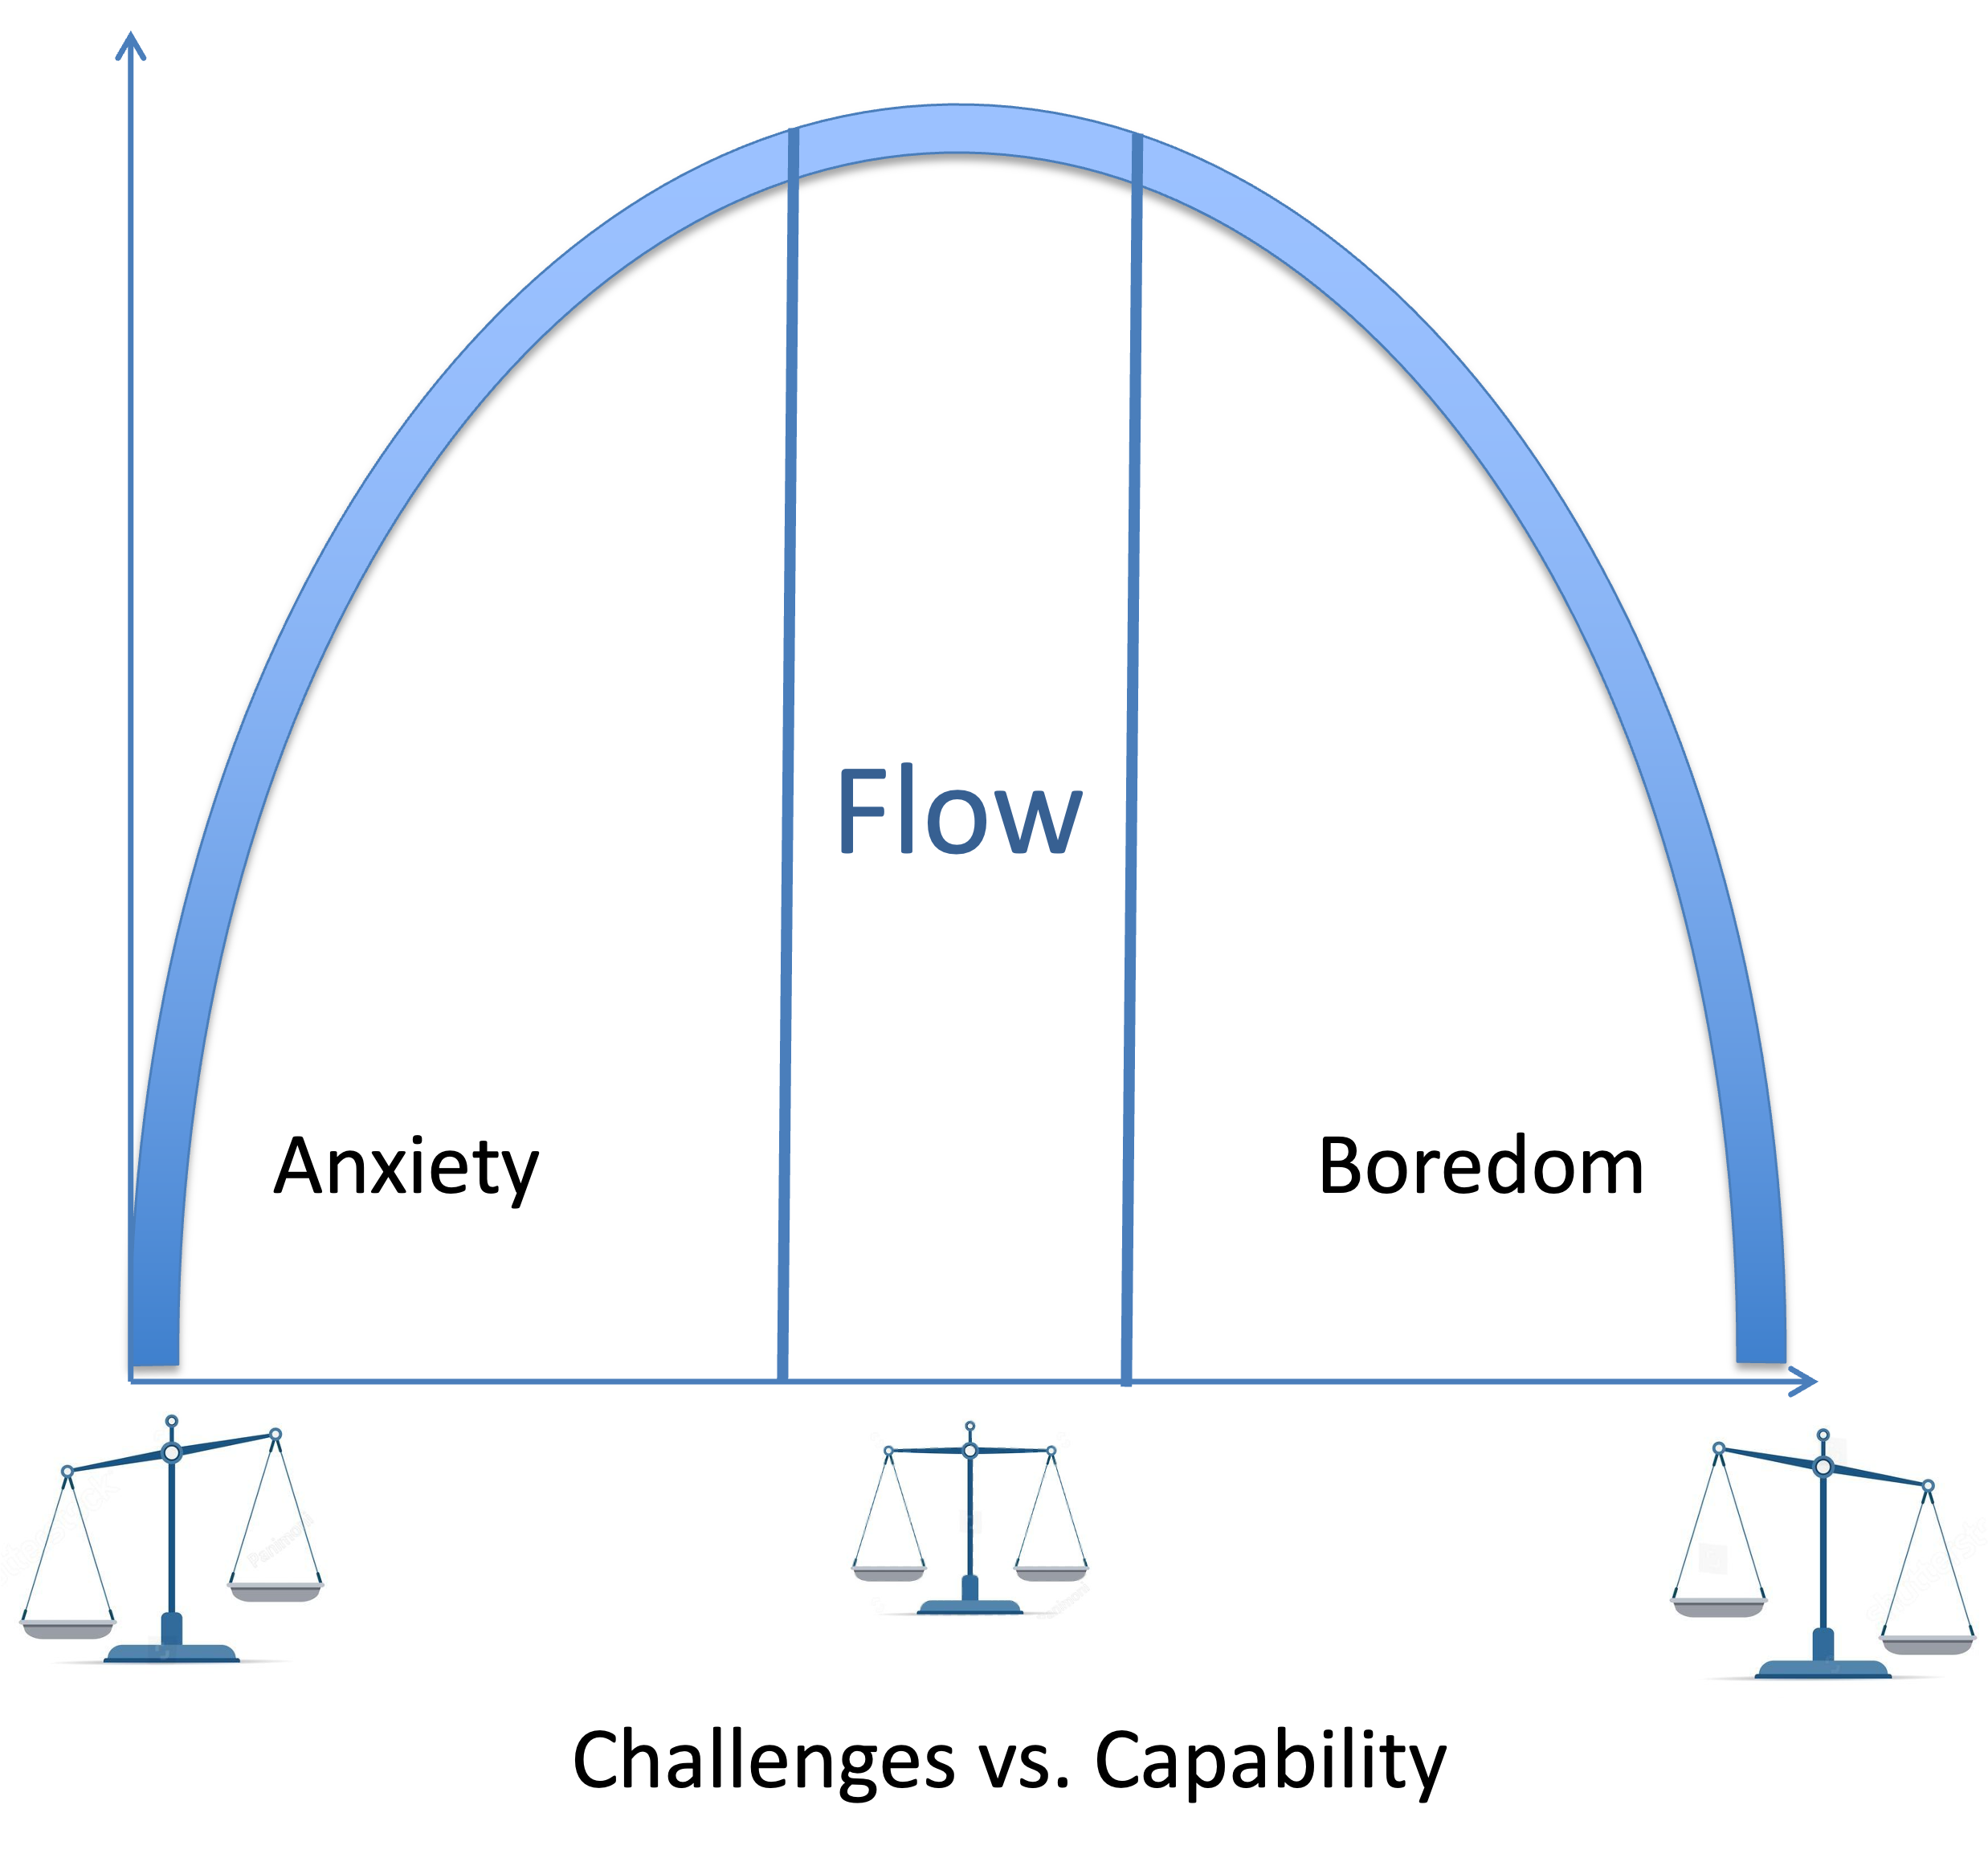
- Graph Axes X = ratio between an individual's perceived skills and the perceived challenges
- Flow: a balance between an individual's perceived skills and the perceived challenges
- Boredom: Low challenge, high capability — If challenges are too low, one gets back to Flow by increasing them.
- Anxiety: High challenge, Low capability — If challenges are too great, one can return to the Flow state by reducing the challenge or developing new capabilities.
A heightened desire to re-engage in the activity appears to only be experienced at the apex of the inverted-U flow function[20]. That is the urge to keep playing appears to be maximized by flow.
Entering Flow
In this article, a knowledge-centric perspective is adopted, necessitating an examination of how the absence of knowledge impacts an individual's Flow state.
To enter and maintain a flow state, the following conditions should be met[3]:
- The opportunity for action, with a clear and attainable goal. That doesn't meant having an overall goal for the activity, but knowing what to do next from moment to moment[9]
- An action with a balance between skill level and challenge, meaning that the activity is neither too easy nor too difficult.
- Clear and immediate feedback, so that successes and failures are apparent and behavior can be adjusted as needed.
The balance should be established for each task the individual will face. Once the conditions for action are in place, the individual is able to engage in a series of challenging tasks that are neither too difficult (not overwhelming) nor too easy (not boring). By balancing each task, we can create the conditions for entering flow for each set of tasks, each feature, and ultimately, for the scope of the project.
Sustaining flow is dependent on the fact that neither capabilities nor challenges remain constant. When the challenges presented exceed an individual's capabilities, they may experience states of perplexity, worry, and anxiety. On the other hand, if there are no challenges in a task that match the individual's capabilities, they may become bored. Prolonged boredom can eventually lead to a state of anxiety, as there may be a perception that current capabilities may be lost[4].
When the conditions for flow are met, they create a feedback loop between action and feedback that allows for continuous, effortless tuning of performance while taking action. This feedback loop makes an activity worth doing for its own sake[3].
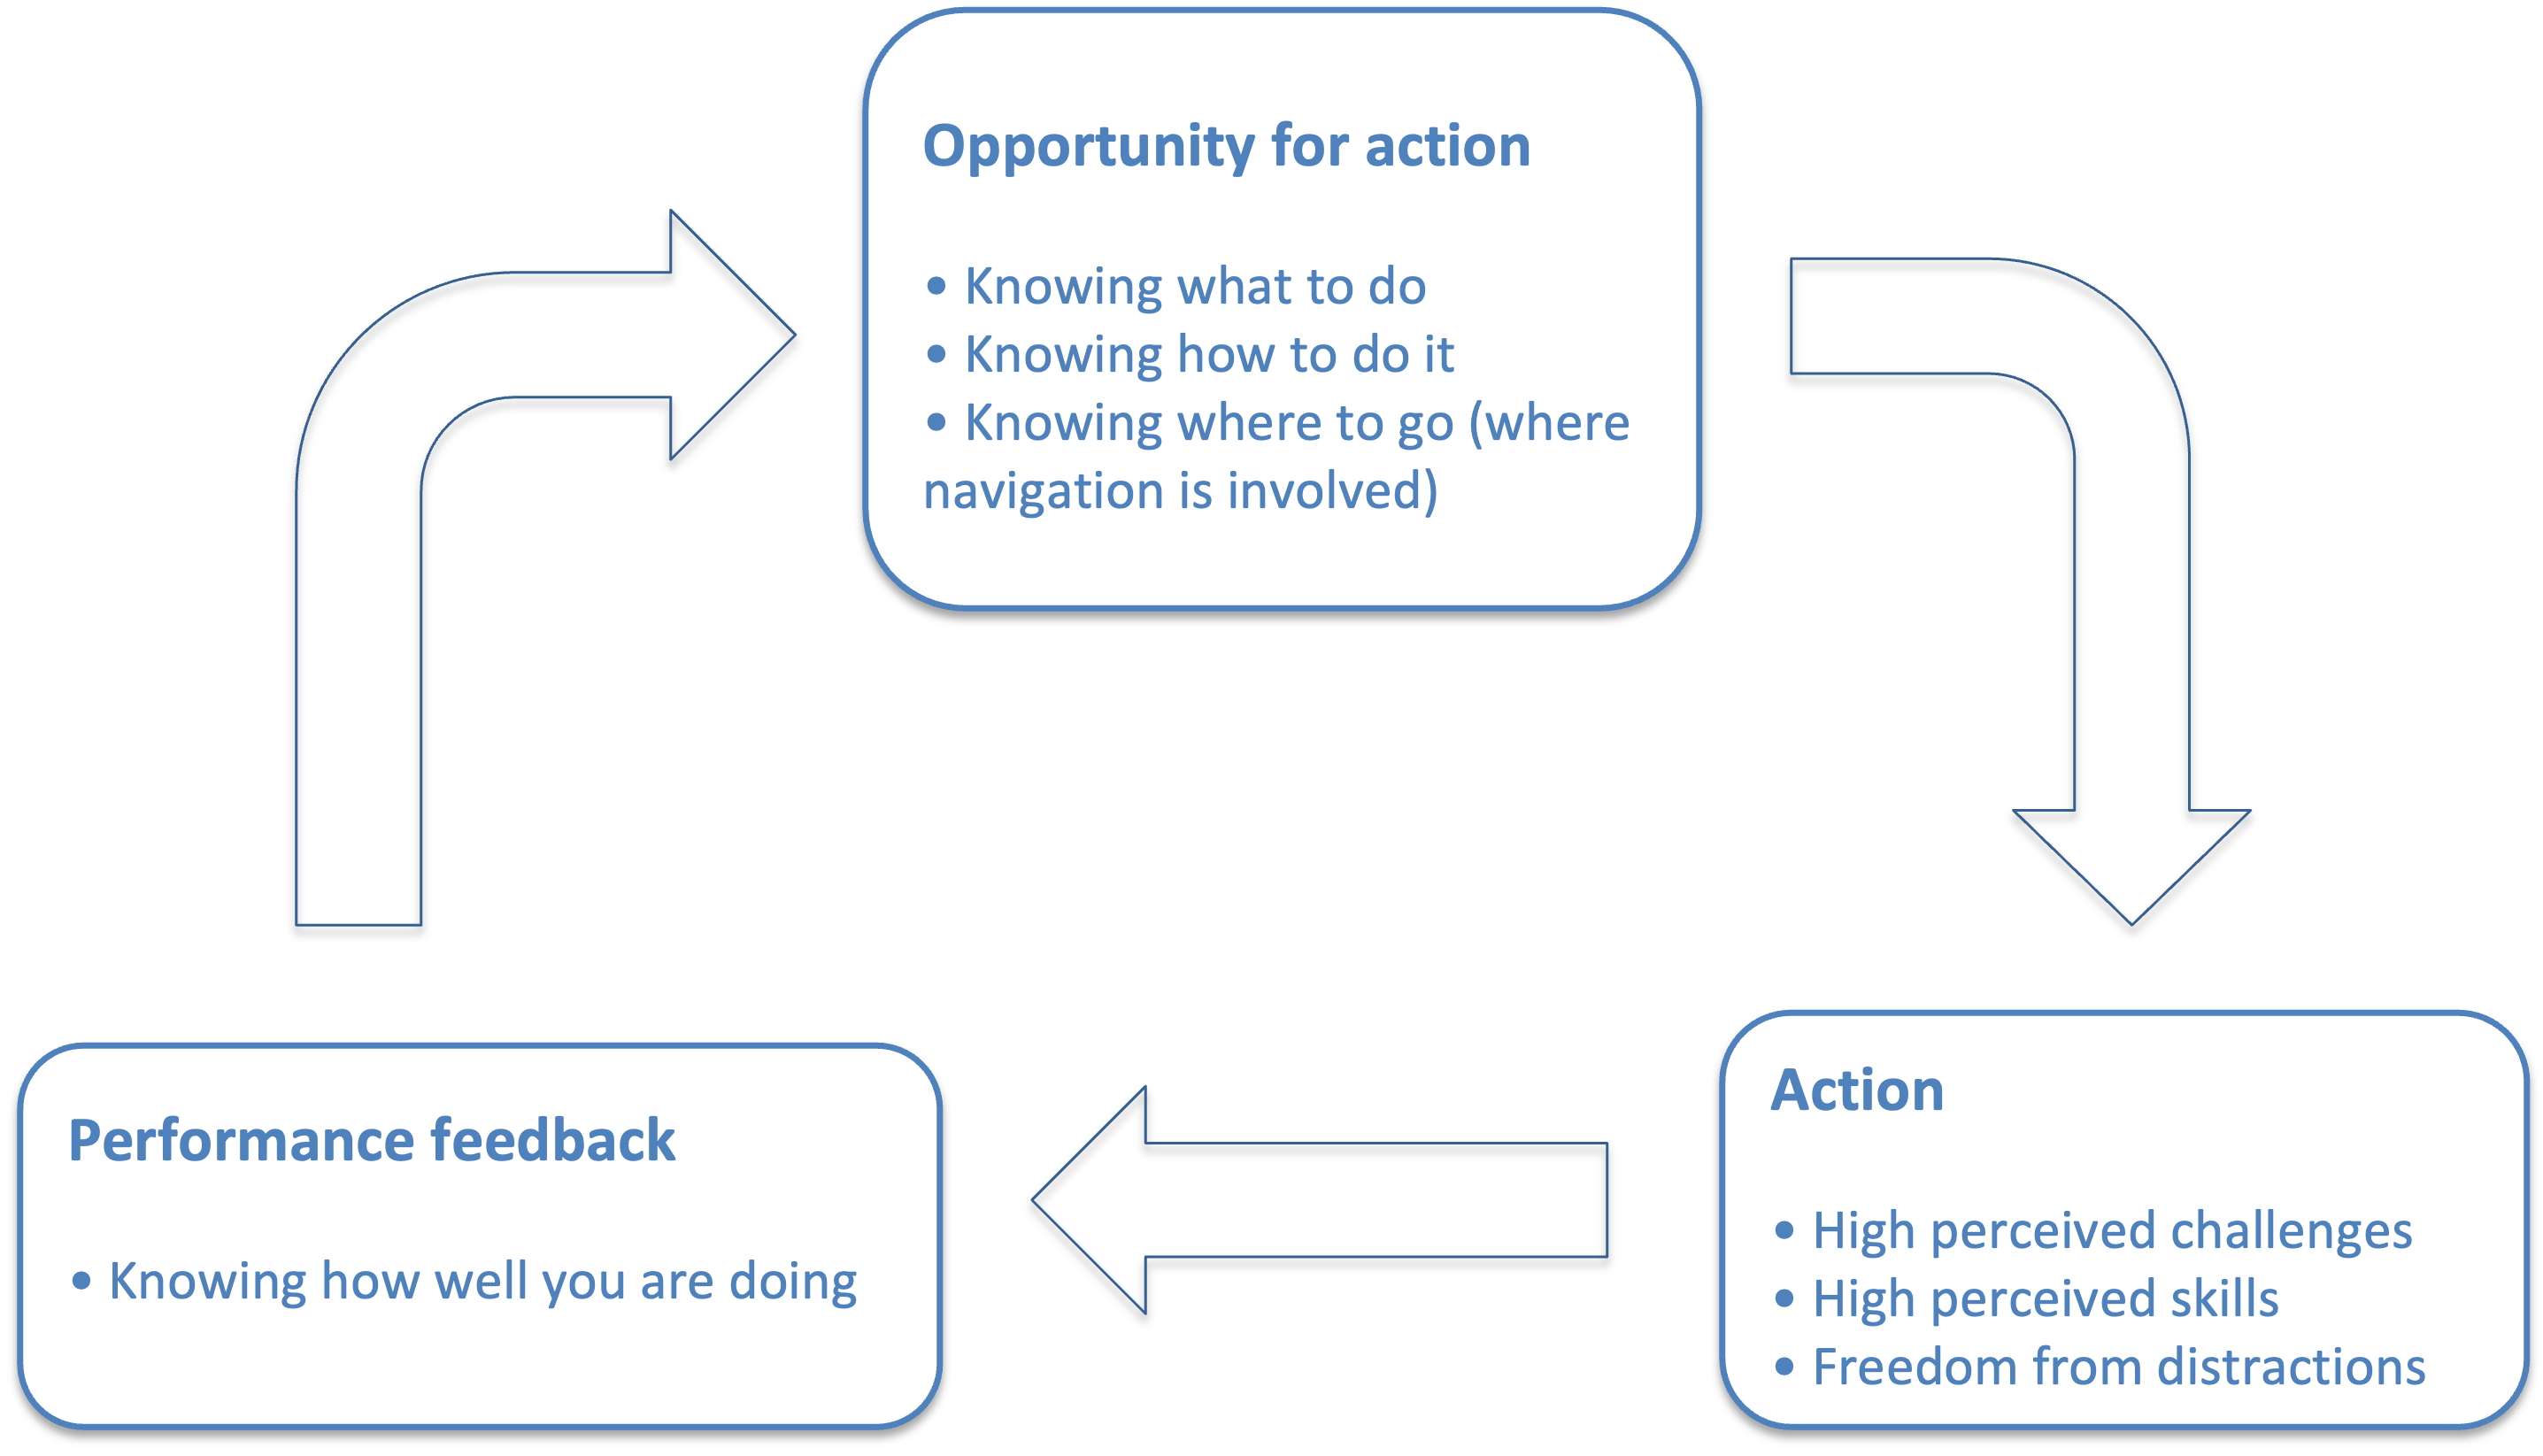
In order to have an opportunity to act, an individual needs to have a clear proximal goal[3]. This is not the overall goal of the activity, but rather a clear goal for the next step in the action sequence, and then the next, and so on, until the final goal is reached. The relationship between clear, attainable proximal goals and flow may be self-evident. If an individual does not know what to do next, they are less likely to enter a flow state. In order to have a clear and attainable proximal goal, an individual needs to:
- Know what to do
- Know how to do it
- Know where to go (where navigation is involved)
After the goal is established, the individual needs to subjectively evaluate if their capabilities are in balance with the work complexity. If that is the case, then there will be a balance between:
- High perceived challenges
- High perceived skills
To maintain the flow state, it's also important to provide the individual with an environment free from distractions. Additionally, we must ensure that the individual receives immediate feedback that allows them to continuously adjust their performance as they tackle these challenges. This kind of feedback communicates how well they are performing and how they can improve their performance.
A mathematical model of The Skill-Challenge Balance and Flow
Existing models
There are a couple of models that propose that knowledge or information give rise to flow. One study used the channel model of flow. They examine the role of a single variable, the difficulty of training, on the rate of learning, to a broad class of learning algorithms in the context of binary classification tasks[28]. Identifying the precision, β, with the level of skill and the level challenge with the inverse of true decision variable, 1/Δ, they show that when challenge equals skill, flow is associated with a high learning rate and accuracy, anxiety with low learning rate and accuracy and boredom with high accuracy but low learning rate
Another study proposed a formal theoretical structure — the informational theory of flow[29]. They propose that the mutual information I(M:E) between desired end states (E) and means of attaining them (M) gives rise to flow. They show that increasing I(M:E) increases flow and has important downstream benefits, including enhanced attention and enjoyment. However, this approach is not able to explain the effects of I(M:E) on flow in terms of skill-challenge balance.
Importantly, that model predicts that the task is most interesting when the success rate is 50% (with a binary outcome), if the outcome of means is perfectly informative of the end outcome (i.e. P{E|M} = 0 or 1). A 50% success rate suggests a balanced challenge where success is uncertain, thus requiring effort and skill to overcome, making the task engaging and motivating. That is a result we use in this article.
A knowledge-centric model
Our proposal is to use the Skill-Challenge Balance model and extend the informational theory of flow. The informational view is an "ideomotor" view of the flow experience, in that it focuses on the link between action and outcome while ignoring the uncertainty associated with the upstream processes of selection of the action itself[31]. Fluent selection and execution of actions (“sense of mastery”, “knowing what to do and how to do it”), rather than increased dependency between action (M) and outcome (E), is often reported to describe flow experiences among experts. Hence the question: would a participant experience maximal flow in a situation where I(M;E) is also maximal but there’s ambiguity in which target to select to get the desired outcome? Selection doesn't mean chance, but a state where the person feels in control or even responsible for the outcome because it was intentional. It is possible to reconcile the “selection” view with the “informational” view of flow and we show how.
Discovering knowledge
In our model, we adopt a knowledge-centric view, applying Information Theory not within its traditional domain of communication but in the realms of knowledge work and decision-making.
Consider a scenario where an individual is tasked with typing the first letter of a word. This situation offers a window into how decisions are influenced and made based on available knowledge and external information sources. To navigate this process, we define three key variables:
- X: Represents the aggregate of all information, insights, and understanding required to achieve a specific outcome. X encompasses a broad spectrum of possible outcomes, signifying the overarching objective of the decision-making process — identifying the correct letter to type.
- Y: Represents the person's existing knowledge base, encompassing all prior information relevant to making the decision about X, as well as any other knowledge about anything else. Y influences the initial state of certainty or uncertainty regarding X, acting as the foundation upon which decisions are based. Initially, Y holds a certain level of information that may or may not be sufficient to resolve the uncertainty about X.
- Z: An external source of information, such as a book, from which the person can obtain answers to binary questions that directly pertain to X. Each interaction with Z is aimed at reducing the uncertainty about X. Z is a mechanism through which Y is enhanced, enabling a more informed decision-making process.
Given the multiple potential outcomes represented by X, there is a certain level of entropy H(X) associated with X, which signifies the initial uncertainty about X before considering any existing knowledge Y. H(X) is more about the potential variety and unpredictability in X itself, rather than the person's specific state of knowledge at any given moment. From a knowledge-centric perspective, H(X) is the person's perception of the "required knowledge" to successfully complete the task,
The mutual information I(X;Y) quantifies how much Y reduces the person's uncertainty about X due to the information obtained from Y It also captures the variability in the utility of Y. From a knowledge-centric perspective, the mutual information I(X;Y) is the person's perception of their individual capabilities or their "prior knowledge". It is the part of the person's existing knowledge base Y that they consider applicable for successfully achieving the outcome X. Prior knowledge is known to facilitate the learning of new knowledge from knowledge sources like Z. Estimates suggest that between 30% and 60% of the variance in learning outcomes can be explained by prior knowledge[11]. Additionally, prior knowledge of different domains can jointly support the recall of arguments[12]. In instances where no questions are needed, Y has effectively reduced all uncertainty about X by itself, suggesting high mutual information I(X;Y) for those instances. Conversely, when questions are needed, Y has not fully reduced uncertainty about X, indicating lower mutual information I(X;Y) for those specific instances. The overall I(X;Y) would reflect an average across all instances, considering both when Y is and isn’t sufficient by itself.
Conditional Entropy H(X|Y) quantifies the uncertainty that remains about X after considering the prior knowledge I(X;Y) before augmentation through Z. It represents the "knowledge to be discovered" - the difference between the prior knowledge a person possesses and the required knowledge needed to complete a task.
The complexity of a task, as perceived by an individual, is defined as the "required knowledge" or total unconditional missing information H(X), An individual's perceived capabilities, or "prior knowledge" is defined as the mutual information I(X:Y). The "knowledge to be discovered" is the conditional information H(X|Y) - what the individual lacks about the task before starting it.
A Knowledge Discovery Process transforms invisible knowledge into visible, tangible output. To learn more about it, please refer to this article. The quality of the output is assumed to meet target standards.
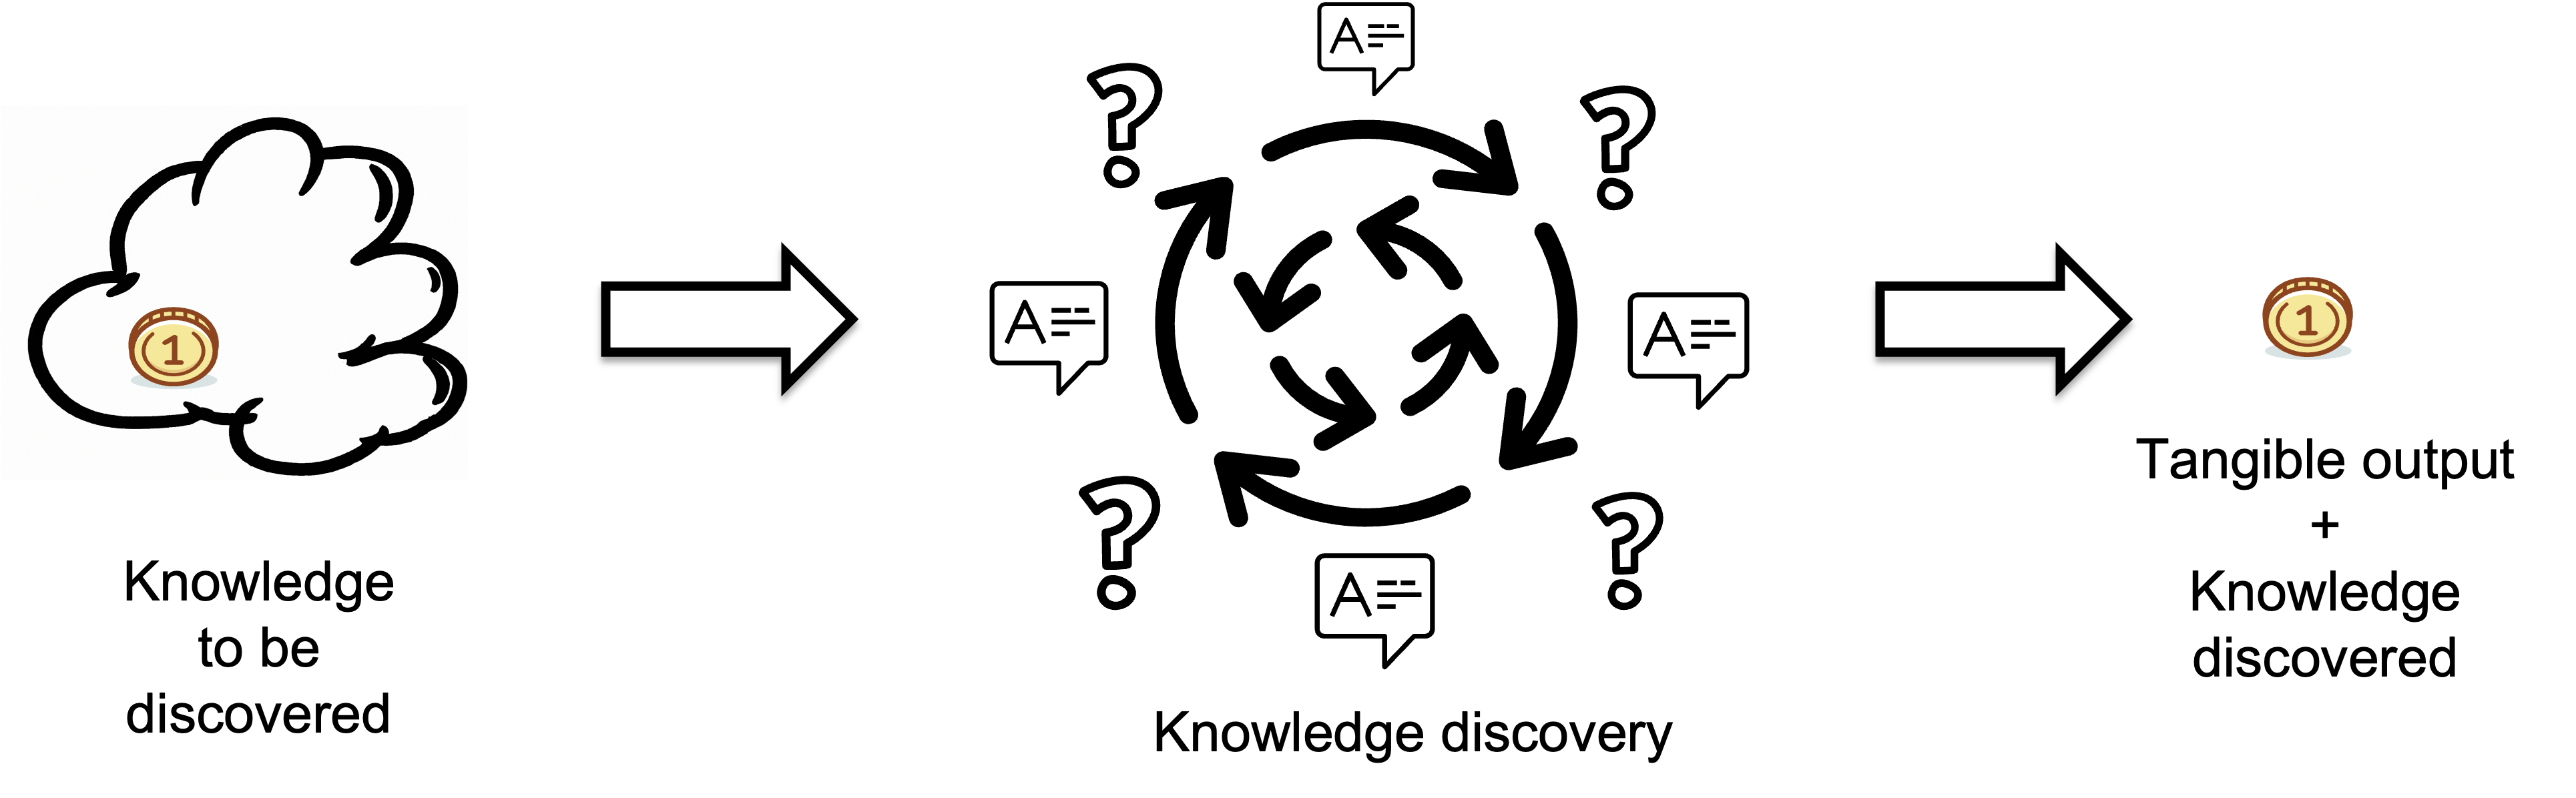
Inputs represent the knowledge individuals lack before starting a task i.e. the missing information or knowledge that needs to be discovered, which is measured in bits.
Below is an animated example of calculating Knowledge Discovered when we search for a gold coin hidden in 1 of 64 boxes.
The distinction between knowledge to be discovered and knowledge discovered is that the former is subjective and conditional, while the latter is objective and real.
Knowledge is a dynamic construct shaped by human inquiry, creativity, and interaction. It evolves through the systematic refinement of conjectures and the elimination of errors, evolving toward greater understanding. To measure knowledge, we interpret knowledge through the perspective of information theory. This means that we interpret knowledge through the perspective of information theory. In the table below, we have related human terms to concepts from information theory.
| SUBJECTIVE | OBJECTIVE (ACTUAL) | ||
|---|---|---|---|
| Human perspective | Information Theory lens | Human perspective | Information Theory lens |
|
Knowledge to be discovered |
Knowledge discovered |
||
|
Required knowledge |
|
|
|
|
Prior knowledge |
|
|
|
The first column of the table lists various subjective elements from both human and information theory perspectives. The second column of the table contains knowledge discovered, which is the information that can be observed and verified through objective reality. We can measure knowledge discovered (or the information gained) by counting the number of questions asked.
Quantifying Flow
In order to determine whether a person was in a state of flow, it's essential to assess the balance between their perceived individual capabilities and the challenge of each task they worked on.
To quantify this balance, we need to assess how a person felt while working on a task. This assessment demands precise and dependable information regarding both factors. This is difficult, if not impossible, to achieve accurately as it involves tapping into the individual's cognitive process.
Imagine a scale: on one side is the required knowledge and on the other is the prior knowledge. They will be balanced if they are equal, implying that the knowledge to be discovered equals zero bits. However, maintaining a state of flow requires a slight leaning towards challenging tasks, meaning the knowledge to be discovered should be greater than zero.
Therefore, even if we can't quantify the prior knowledge and required knowledge in bits of information, we can express their difference i.e. the knowledge discovered, in terms of bits of information.
However, it is not possible to accurately measure neither the prior knowledge nor the knowledge to be discovered in advance. Instead, the amount of knowledge discovered can be quantified after the task has been completed by counting the number of questions asked, providing insight into the subjective knowledge that needed to be discovered.
Flow as a Function of Skill-Challenge Balance
To quantify the Skill-Challenge Balance model of the Flow state we need a function that behaves as outlined above. It needs to have as parameters the probabilities: p of knowing (the frequency of a particular symbol being typed) and q of ignorance (the frequency of questions asked that do not result in that symbol).
where Q is the total number of questions asked in a time interval, S is the total number of answers acquired for the same time interval, H is the Information per Symbol.
Shannon's entropy formula for a discrete random variable with probabilities[14] p and q is given by:
In our scenario, since there are only two values, p and q, and substituting q with ( 1 - p ), the formula simplifies to:
This formula now solely depends on p and can be used to calculate the entropy for any given value of p in the range [0, 1]. Applying Shannon's entropy formula to this distribution will give us a measure of the entropy (or uncertainty) inherent in knowing rate.
KEDE is a ratio between the knowledge discovered and the maximum knowledge that could be discovered for a time period, as explained in details here:
(1)
where Q is the total number of questions asked in a time interval, S is the total number of answers acquired for the same time interval, H is the Information per Symbol.
KEDE is continuous in the closed interval of (0,1]. KEDE is inversely proportional on the questions asked i.e. on the difference between knowledge required by a task and the prior knowledge of a person, and proportional to the answers acquired
Thus, to ascertain if the person's capability and the task complexity were balanced, we can measure the knowledge discovered after successful task completion. We can employ Knowledge Discovery Efficiency (KEDE) for this measurement, as explained in details here..
We have two outcomes, with probabilities KEDE and (1-KEDE), respectively. For calculating the balance between H(x|Y) and I(X:Y) we use Shannon's formula
In this case, p1 = KEDE and p2 = (1-KEDE) and the Balance function of one variable is:
(2)
It has a single parameter, the Knowledge Discovery Efficiency (KEDE) , presented in short here and in detail here[30].
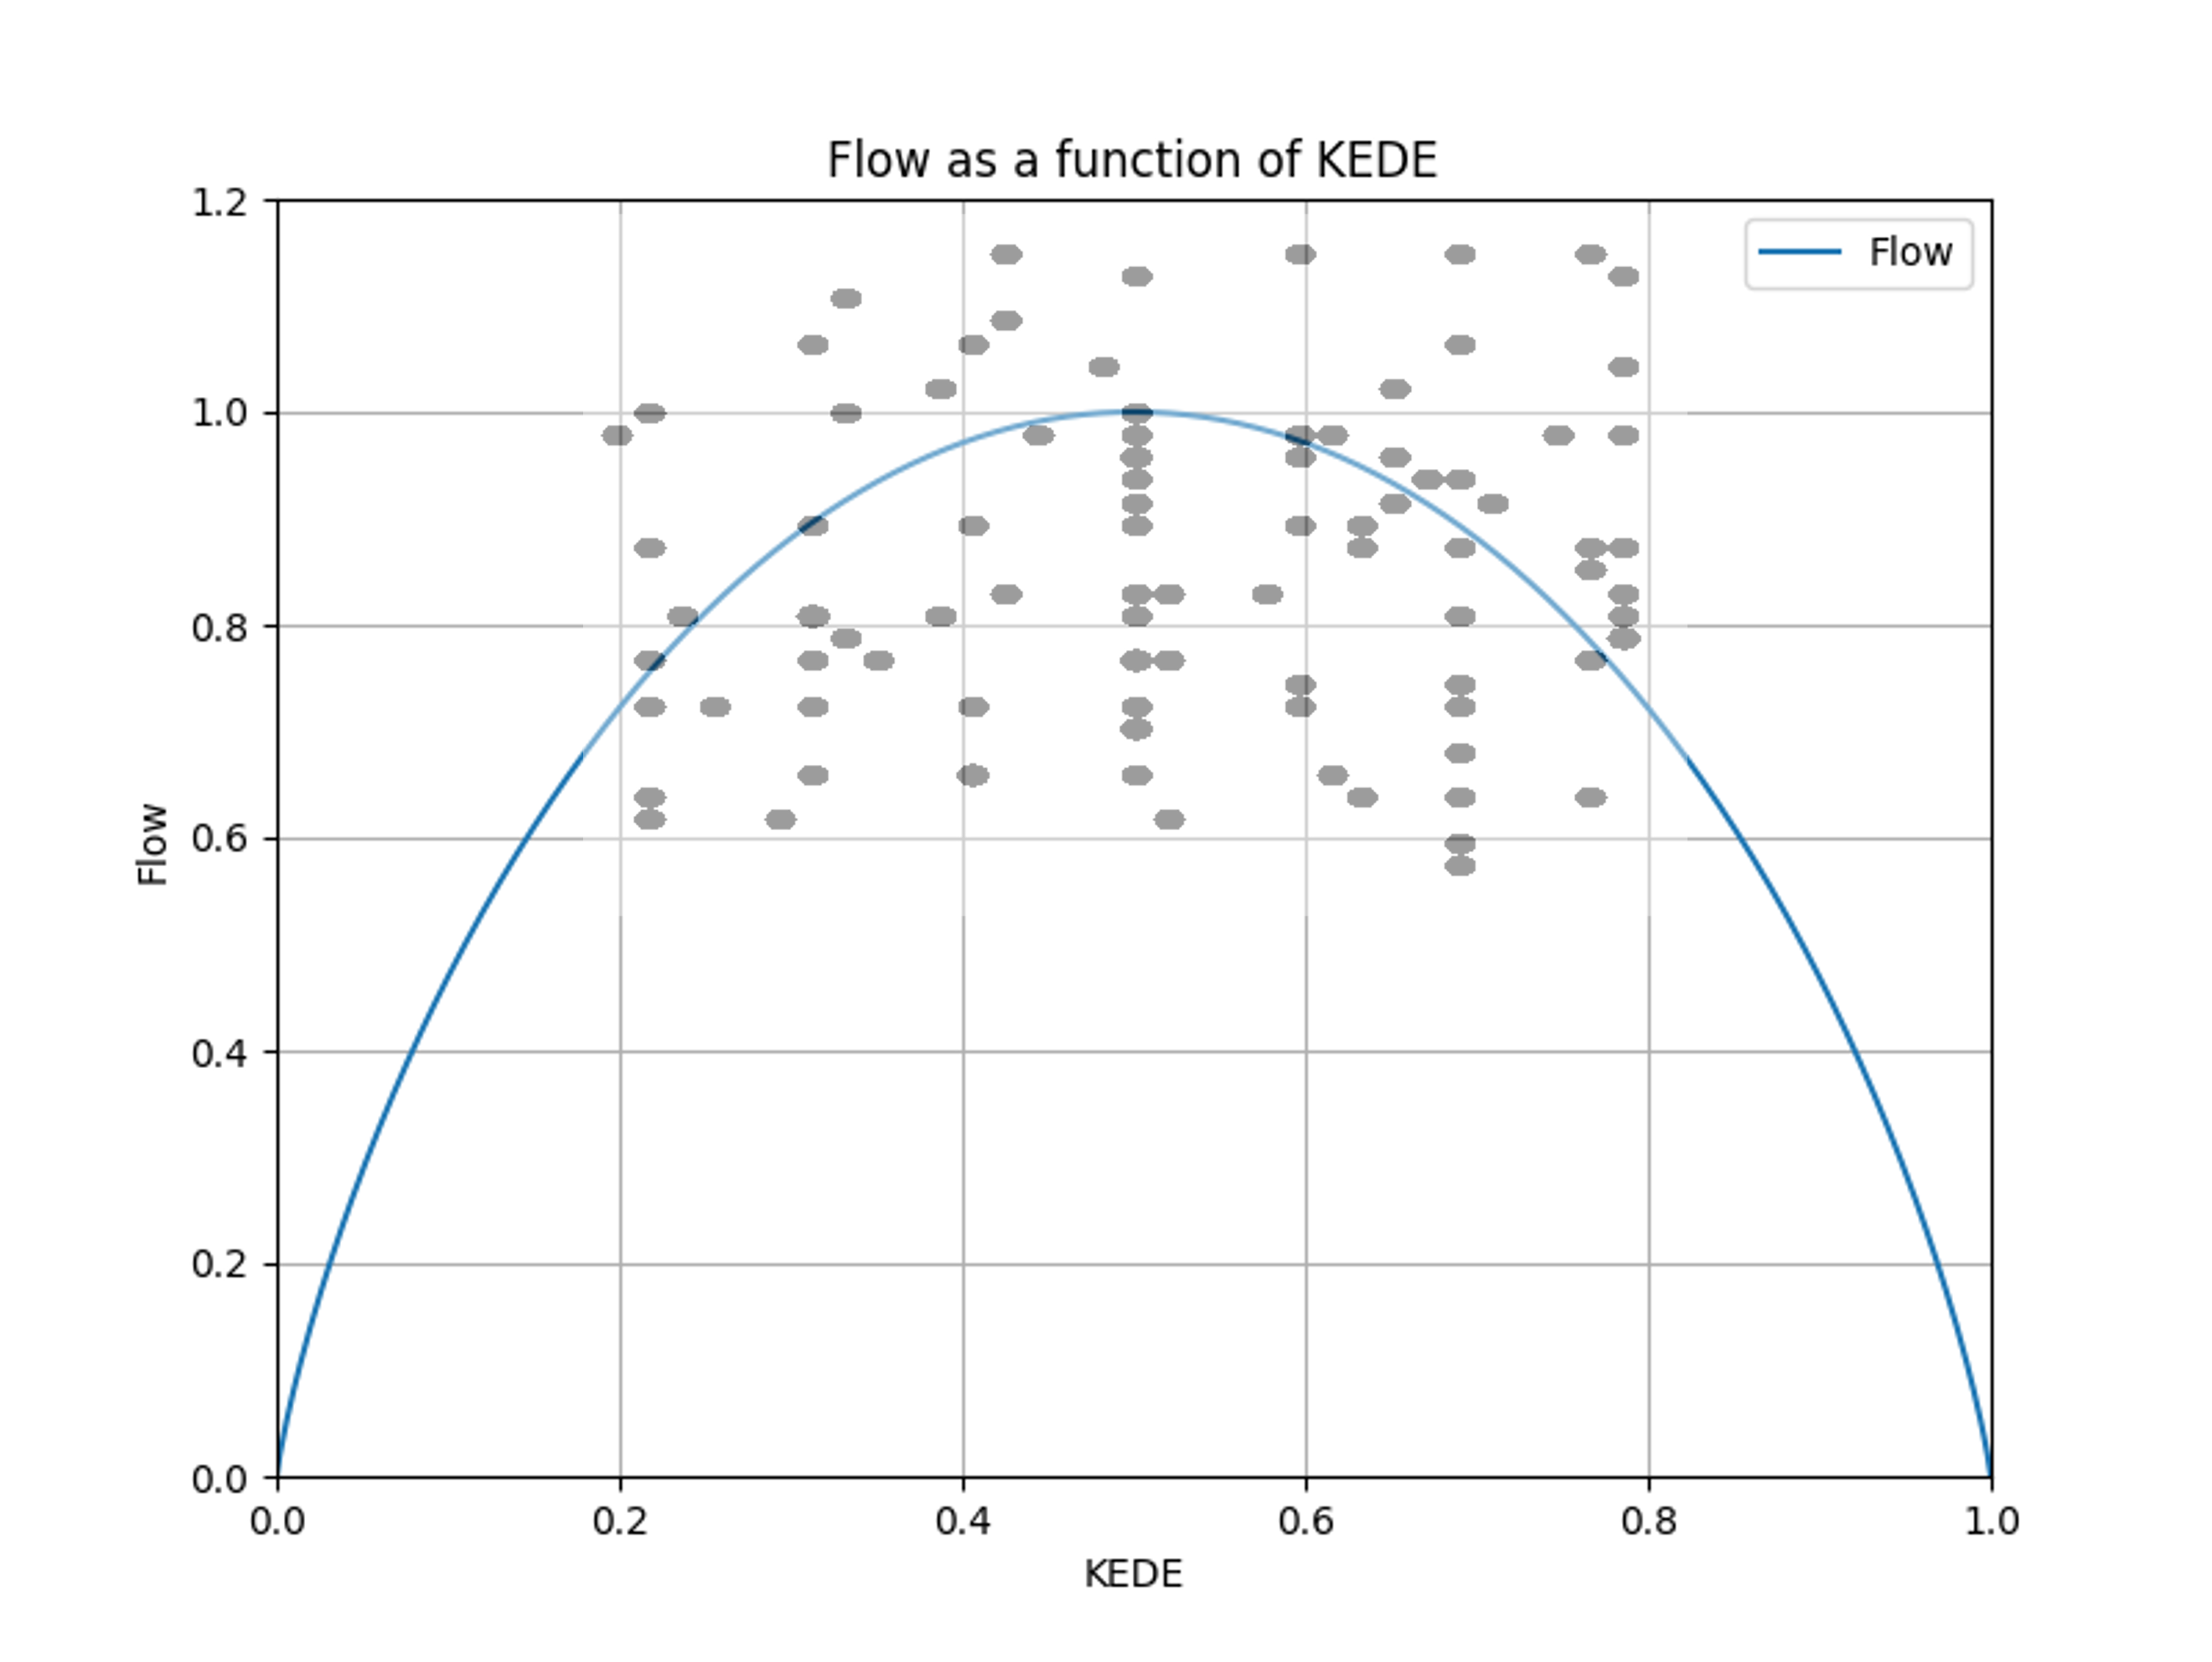
Figure below shows the function Flow(KEDE).
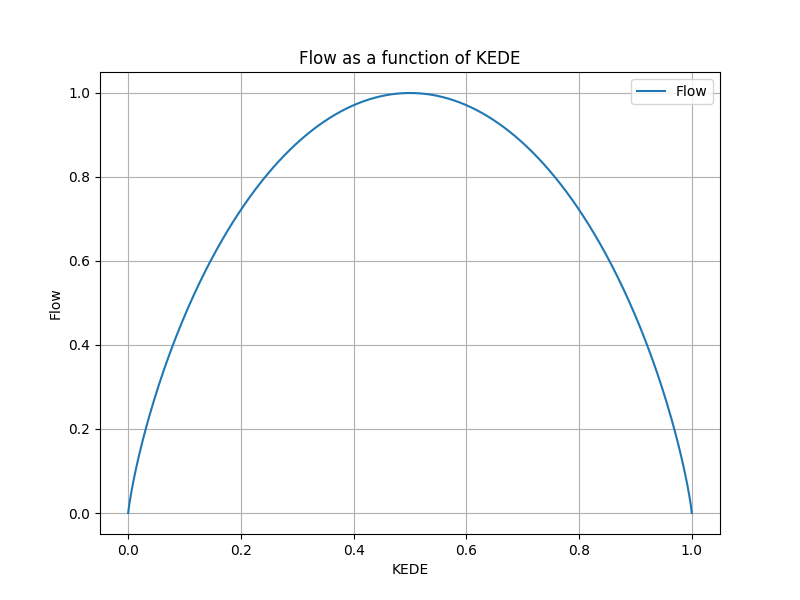
The Flow function is always positive, concave (or concave downward), and has a maximum value at KEDE = 1/2. It is zero at both KEDE = 0 and KEDE = 1.
This property is consistent with what we stated we expect from a quantity that measures the balance between task challenges and individual capabilities. The shape of the function is consistent with the Skill-Challenge Balance model.
When KEDE is equal to 0, the person may be in a state of anxiety, as the challenges are too great. On the other hand, when KEDE is equal to 1, the person may be in a state of boredom, as the challenges are too low. The optimal state is when KEDE is equal to 1/2, as this indicates a balance between task challenges and individual capabilities. It is clear that for any value of 0 < KEDE < 1/2, we have less balance than in the case KEDE = 1/2. This is the case of individual experience tending to anxiety, as its limiting case from the left.
It is also clear that for any value of 1/2 < KEDE < 1, we again have less balance than in the case KEDE = 1/2. This is the case of individual experience tending to boredom, as its limiting case from the right.
In general, values of KEDE less than 1/2 indicate a lack of balance and a tendency towards anxiety, while values greater than 1/2 indicate a lack of balance and a tendency towards boredom. In both cases, the level of balance is less than in the case of KEDE=1/2.
For the example with the longest English word KEDE is:
After that we can calculate Flow:
Flow as a Function of Knowledge Discovered
We can express Flow not only as a function of the frequency of questions asked, but also as a function of the average knowledge discovered per symbol.
Given the relationship
(3)
We calculate H using the KEDE theorem :
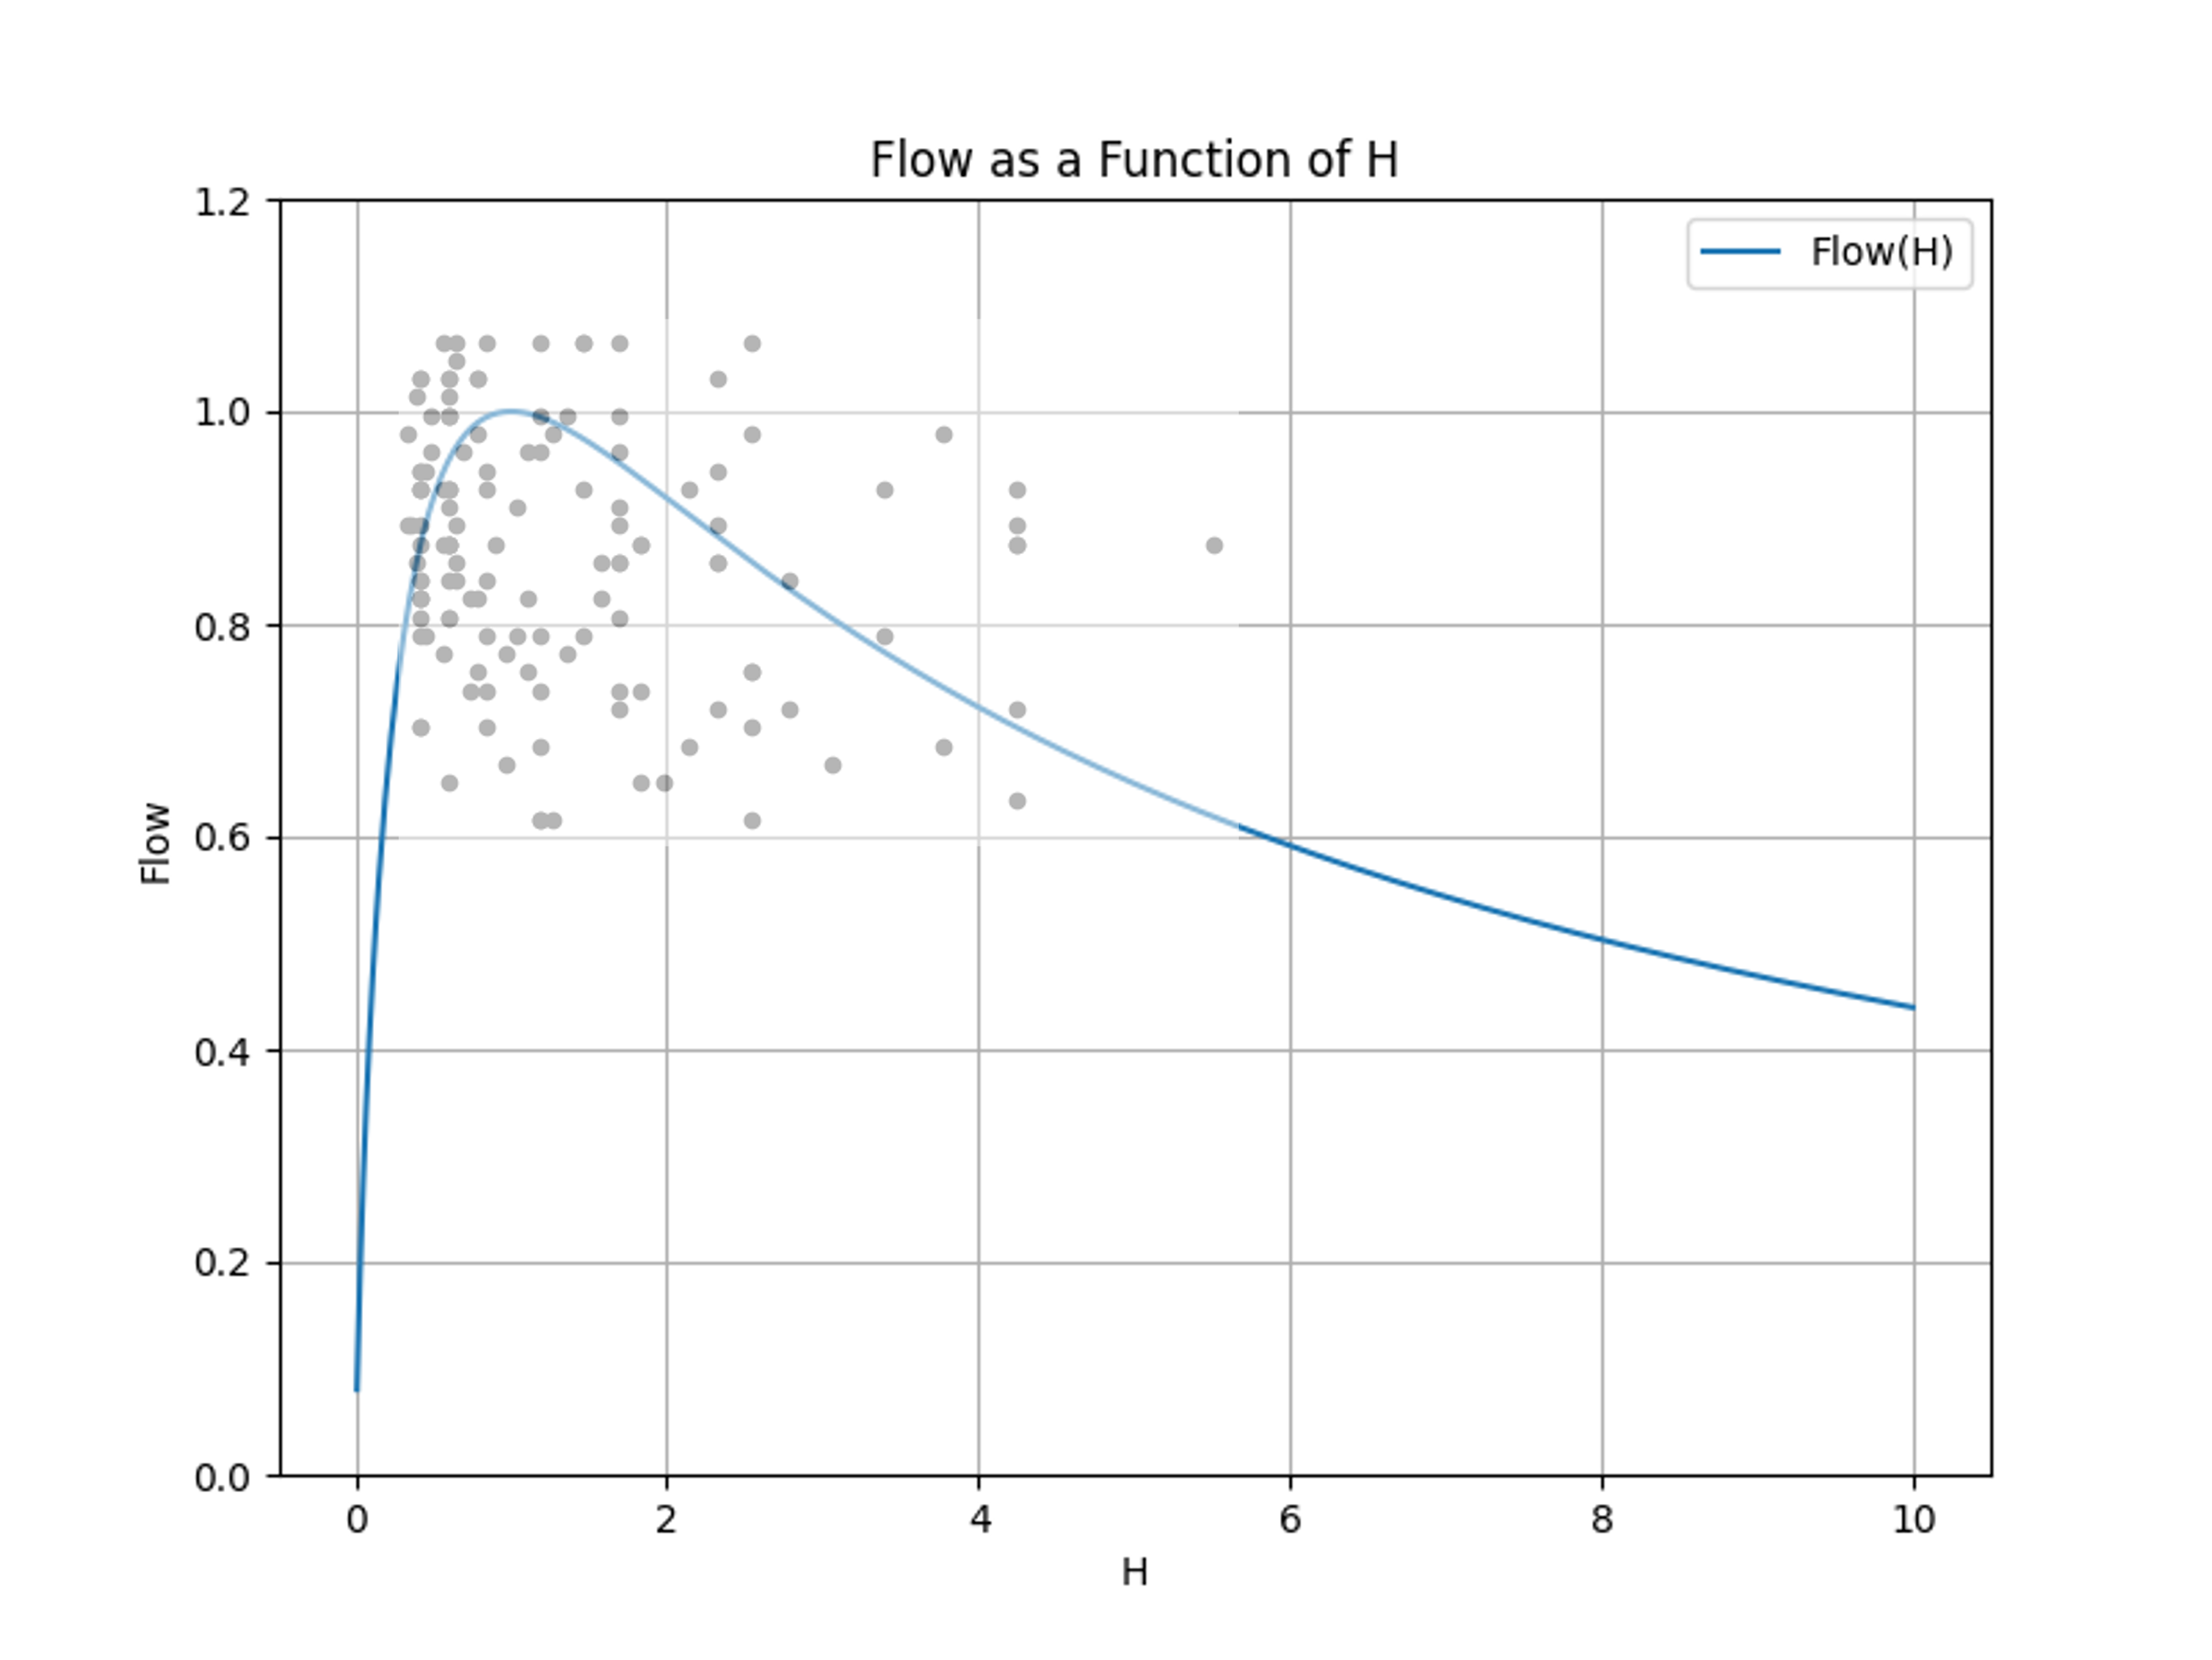
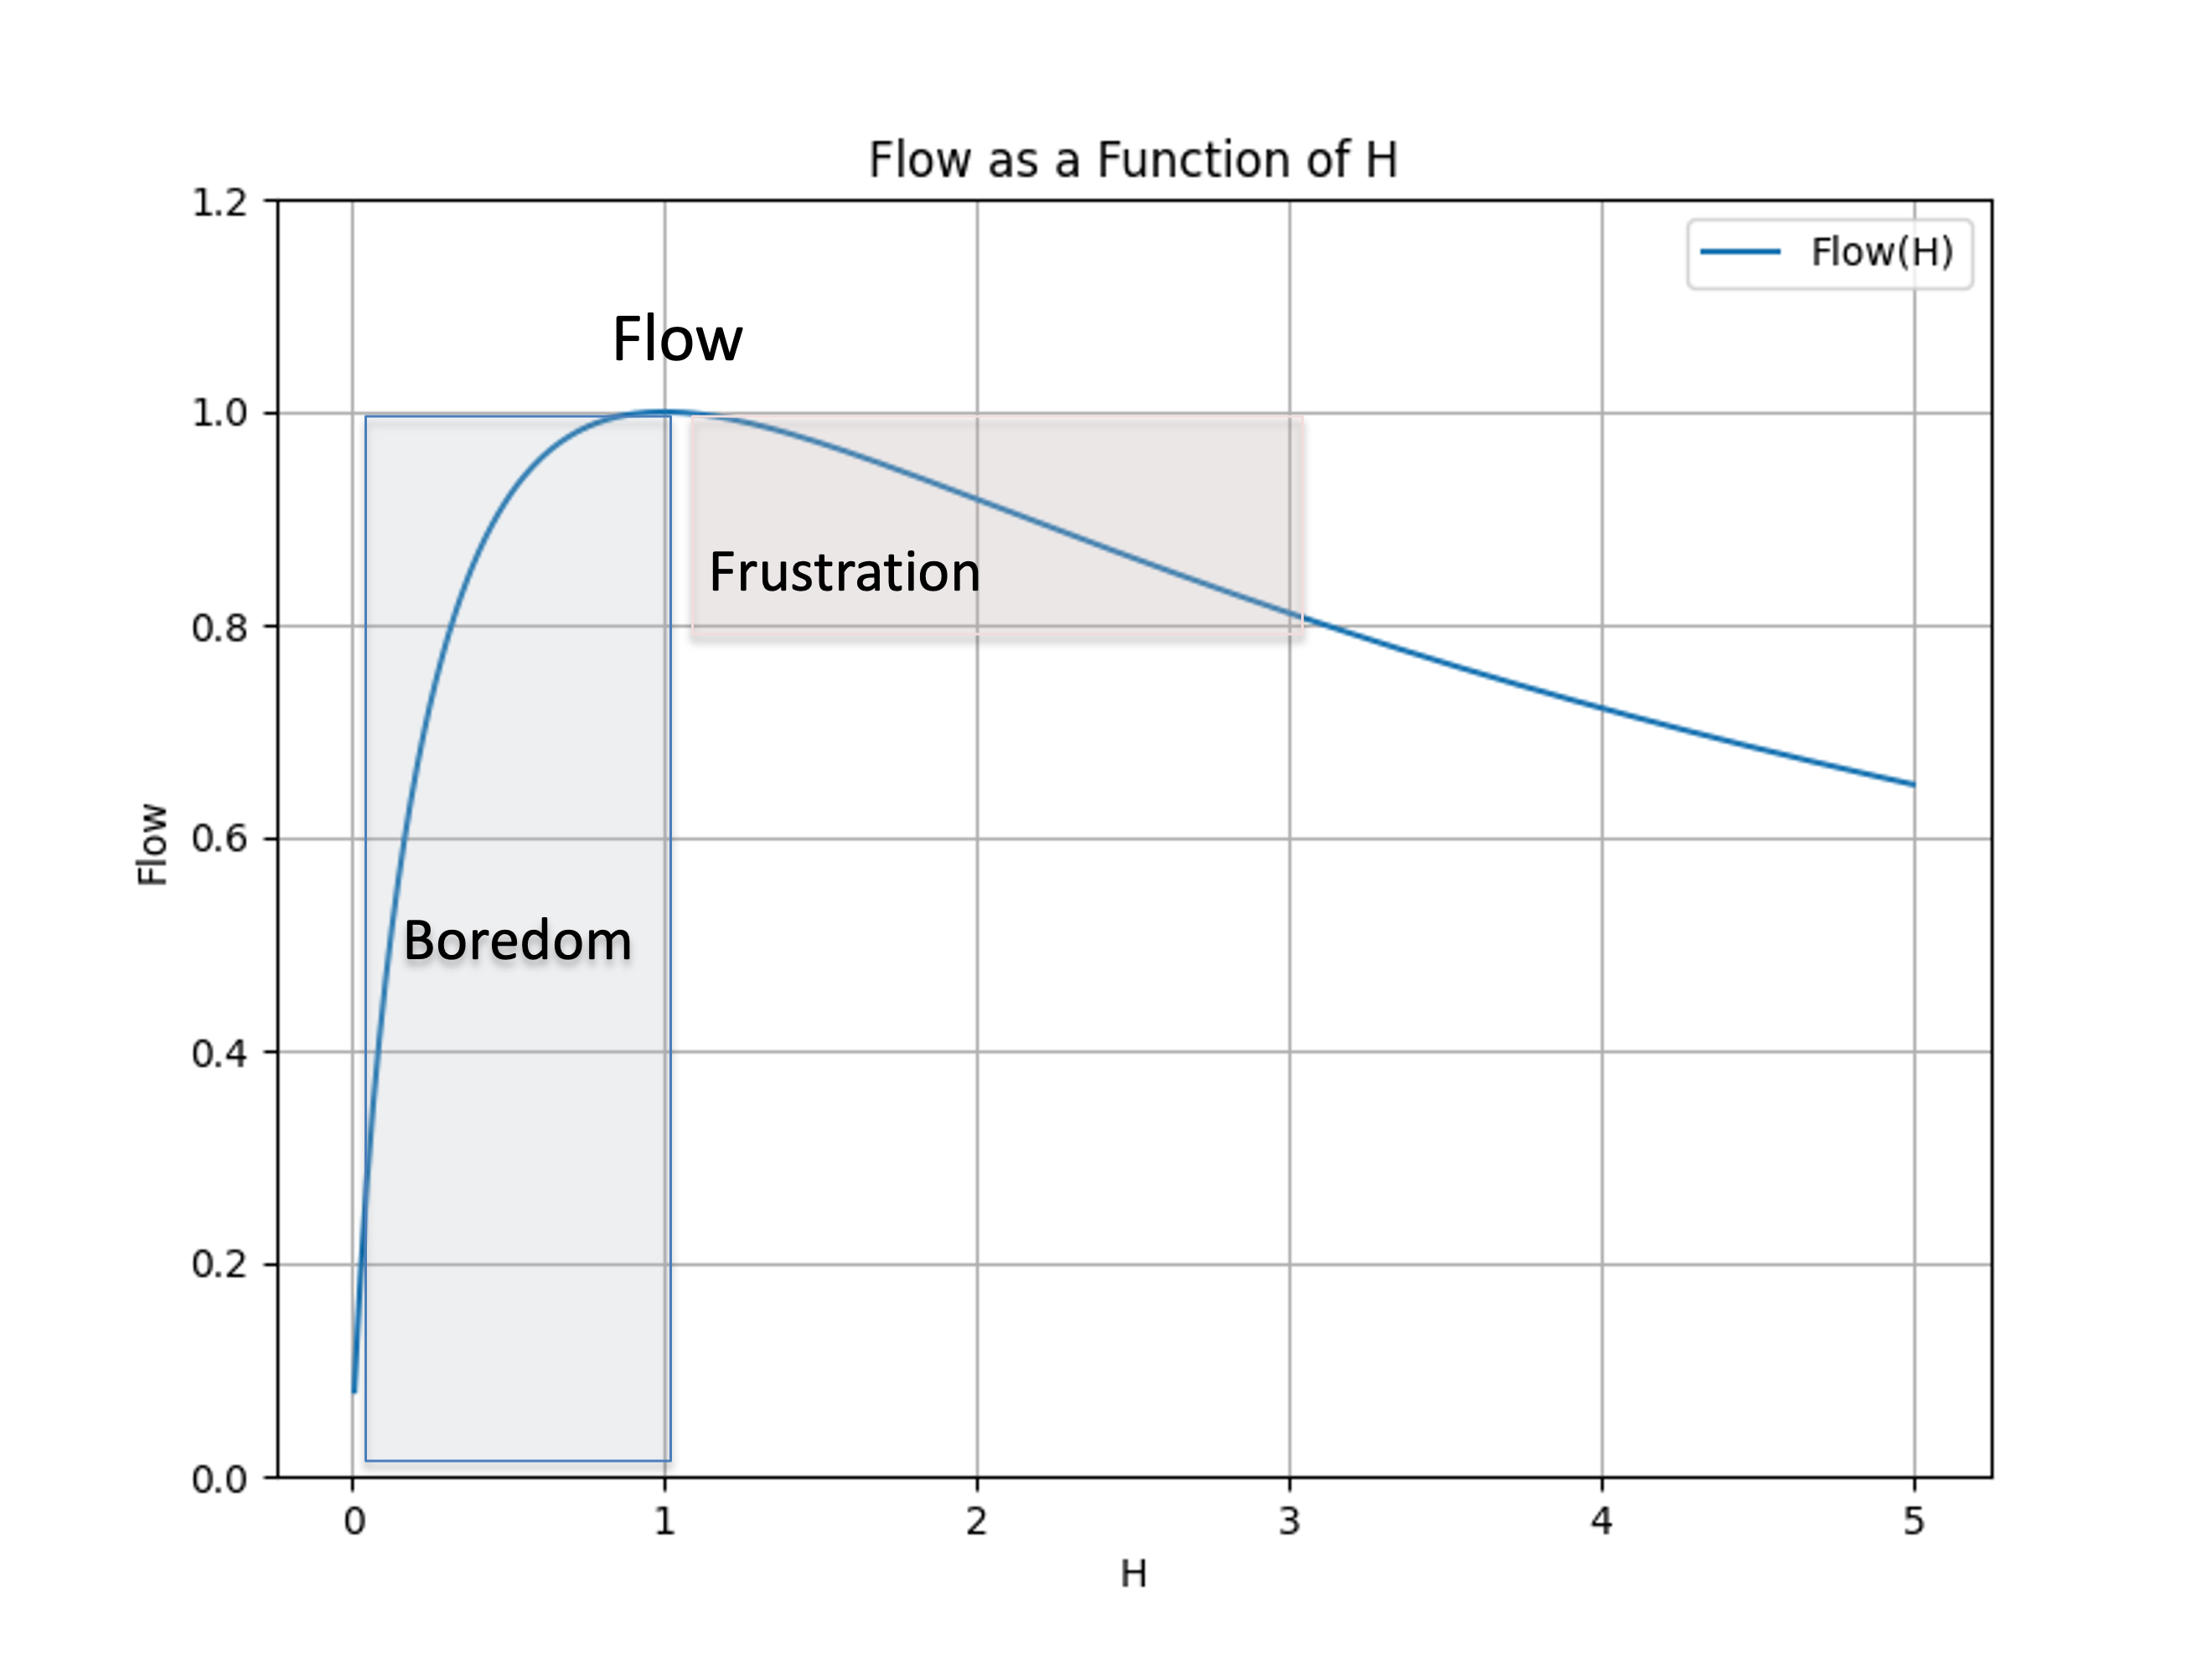
The below diagram shows you how the Flow as a function of H for H > 0.
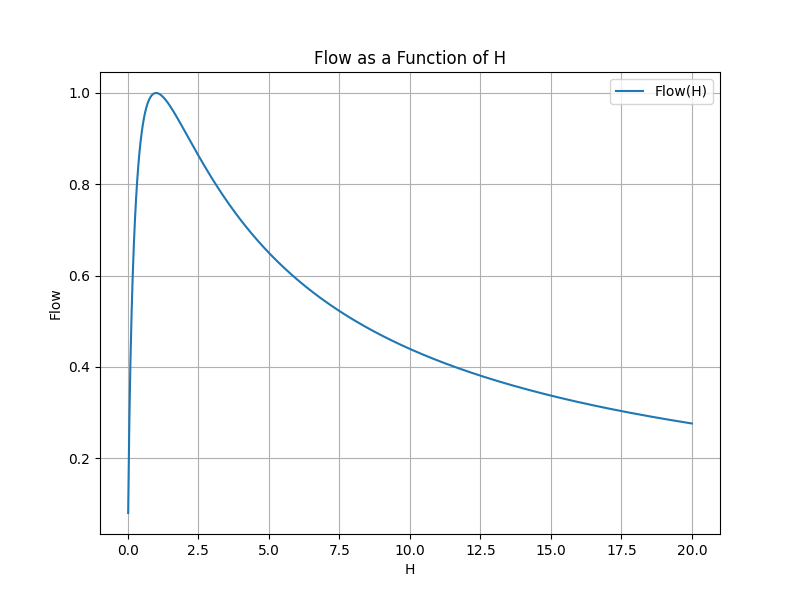
On the x-axis we have the H value ranging from 0 to 20. On the y-axis we have Flow value.
The curve is skewed to the right. The state of Flow is achieved at H=1 bit. To the left o thet Flow state there is a narrow range of H between 0 and 1, which is the state of Boredom. To the right of Flow there is a wide range of anxiety.
We see that there are many ways to be anxious and just a few ways to be bored or in the Flow.
Experiments
In order to validate our mathematical model of Flow we need to test it against existing experimental data.
A computational theory of the subjective experience of flow
Our model extends the Informational Theory of Flow as outlined in [29]. To confirm this, we must validate our mathematical model against their data. Fortunately, their dataset is publicly accessible, allowing us to use it. Below, we analyze each of their experiments through the lens of our mathematical model.
Participants engaged in two versions of a tile game (with the order of versions counterbalanced), each spanning 50 trials. For each participant and game version, they randomly selected pM(hit) from the set {.2, .3, .4, .5, .6, .7, .8}, and pEjM(jackpotjhit) from the set {.6, .7, .8, .9, 1}, ensuring that neither parameter would be the same across the two games. Following each game, participants evaluated their experience of flow.
In our analysis of Experiment 1, we specifically focused on cases where pEjM(jackpotjhit) = 1, for the following reasons:
- Their model suggests the task becomes most engaging when pM(hit) = 0.5 (with a binary outcome), if the outcome of means is perfectly informative of the end outcome i.e. pEjM(jackpotjhit) = 1. A 50% success rate indicates a well-balanced challenge, where the uncertainty of success necessitates both effort and skill for mastery, thereby enhancing engagement and motivation.
- Our mathematical model extends theirs to the lef (upstream) by considering only the process of selecting M.
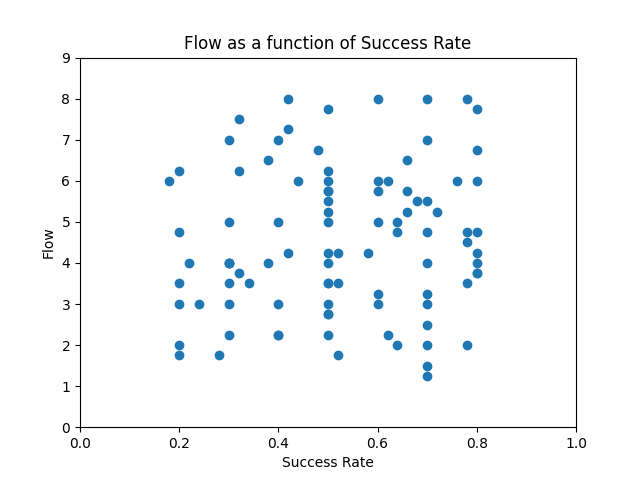
At first glance, there may appear to be no connection to our mathematical model, but a relation emerges upon careful consideration of the experiment's setup. Given that pM(hit) ranges from {.2, .3, .4, .5, .6, .7, .8} the intervals 0 < pM(hit) < 0.2 and 0.8 < pM(hit) < 1 were not examined. Our model posits that individuals are likely to experience anxiety in the 0 < pM(hit) < 0.2 range and boredom when 0.8 < pM(hit) < 1. It is noteworthy that [29] did not probe either anxiety or boredom, focusing instead on subjective experiences of Flow.
The figure below displays the experiment's results within the context of our model's Flow curve.
Although the fit is for illustrative purposes only, it demonstrates that the experiment indeed measured subjective levels of being in the state of Flow.
A similar fitting approach is documented in [16], where Figure 3 highlights the distribution of flow and enjoyment across various levels of skill-demand balance.
Let's now examine how the experiment's outcomes relate to Flow as a function of average information. This association is shown the figure below.
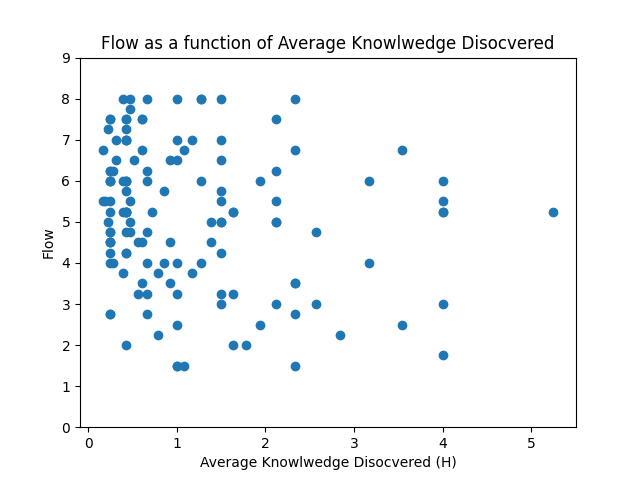
It's again important to note that the experiment did not address boredom and anxiety. This is evident in Fig. 7, where we have, for illustrative purposes, mapped the experiment's results onto the Flow(H) curve.
This analysis confirms that the experiment's findings align with our mathematical model.
The x-axis shows bits of information calculated using Eq. 1:
where N is the maximum possible number of hits, whihc is 50 in the experiment.
Flexible and Modular Brain Network Dynamics Characterize Flow Experiences During Media Use
Here we validate our mathematical model using data from the Experimental Procedure Behavioral Study[32].
Participants played Asteroid Impact, which is a point-and-click style video game where subjects use a cursor to collect crystal-shaped targets that are displayed at different locations while avoiding asteroids that bounce around the screen[33][34]. Game difficulty is manipulated by altering the number of targets a subject needs to collect, the number of objects to be avoided, and the rate at which these objects move. All random aspects of the game are removed; any differences in game experience are the result of player intervention. Asteroid Impact also features an adaptive mode where the game automatically increases or decreases in difficulty depending on player performance.
Participants were then randomly assigned to one of six orders where they completed each experimental condition (low-difficulty, high-difficulty, balanced-difficulty).
- Flow, Boredom, Frustration
- Flow, Frustration, Boredom
- Frustration, Boredom, Flow
- Frustration, Flow, Boredom
- Boredom, Flow, Frustration
- Boredom, Frustration, Flow
Each experimental condition lasted 240 seconds. At the end of each experimental condition, participants completed the self-reported flow and enjoyment measures.
Such a design draws directly from flow theory by assuming that task-related intrinsic reward is not driven by actual task outcomes (e.g., performance) but instead by the perception of a balance between task difficulty and individual ability[33]. Importantly, this assumption is corroborated by a large body of literature[1][2].
Secondary Task Reaction Time
In Asteroid Impact, a participant’s primary task is to collect targets (crystals) while preventing their spacecraft (mouse cursor) from being hit by flying asteroids. There is a secondary task, which is to press a keyboard key in response to an auditory or visual stimulus (probe). The probe was a semi-opaque red circle along with a tone (sine waveform, 440.0 Hz). Probes were shown equally in one of four game corners. A total of 68 probes were shown during each condition. Participants were told to respond to probes as quickly as possible by pressing the spacebar key using their nondominant hand. Secondary task reaction time (STRT) was calculated as the latency between probe onset time of a stimulus (trial/probe) and the moment when a subject responded with a key press.
There was an “endless” play-mode while also holding the number of asteroids (4) and targets (4) constant. The total number of targets they successfully collected was not considered in the experiment.
Results
The researchers established hypothesis (H2) which expected STRTs to show an inverted U-shaped pattern where STRTs will be longest when task difficulty matches ability and fastest when task difficulty doesn't match ability.
The study showed the predicted inverted-U shaped pattern of results. Secondary task reaction times were significantly longer in the flow compared to boredom conditions. However, STRTs were not significantly longer in the flow condition compared to the frustration condition. That means results show strong support for the flow > boredom comparison, but marginal support for the flow > frustration comparison.
The researchers' concluded that their hypothesis (H2) was partially supported. We think that conclusion stems from their implicit belief that the inverted-U curve needs to be symmetrical.
In the following, considering Eq.3 and Fig,3 , we will show their hypothesis H2 was fully supported.
Looking at the results through a Knowledge-centric lens
From a Knowledge-centric perspective we look at the experiment as follows:
- The subject needs to close 68 probes (trials).
- Collecting the crystals and avoiding the asteroids is considered cognitive load - thinking.
- The level of thinking required is manipulated by the three different modes of the game - Boredom, Flow, Frustration.
- If more thinking is required the STRTs will be longer. Less thinking means shorter STRTs. If there is a misalignment with that, then the person just refused to think and just hit the probe.
We need to convert STRT times into bits of information. For that we shall anchor on well researched natural constraints such as the capacity of cognitive control.
Cognitive control, also known as executive function, is a higher-level cognitive process that involves the ability to control and manage other cognitive processes that permit selection and prioritization of information processing in different cognitive domains to reach the capacity-limited conscious mind. Cognitive control coordinates thoughts and actions under uncertainty. It's like the "conductor" of the cognitive processes, orchestrating and managing how they work together. Information theory has been applied to cognitive control by studying the capacity of cognitive control in terms of the amount of information that can be processed or manipulated at any given time. Researchers found that the capacity of cognitive control is approximately 3 to 4 bits per second[35][36], That means cognitive control as a higher-level function has a remarkably low capacity.
On the other hand the time required for a person to press the spacebar, known as the reaction time, is studied to be between 150 and 300 ms[37].
In order to get a round value of maximum key press rate N of 100 000 symbols per 8 hours of work we pick the information rate to be R 3.47 bits per second. That means processing a bit of information lasts 0.288 seconds.
This means that if a STRT<=288 milliseconds there were zero bits of information needed to decide pressing the spacebar for a probe/trial. Below is a table representing the mapping between bits of information and STRTs:
| Bits of Information | Reaction Time (milliseconds) |
|---|---|
| 0 | 288 |
| 1 | 500 |
| 2 | 750 |
| 3 | 1000 |
| 4 | 1250 |
| 5 | 1500 |
This table is designed to reflect a more realistic increase in reaction times for processing up to 4 bits of information, staying within the bounds of the cognitive throughput of 3-4 bits per second.
The researchers found the below results for the association for STRTs and condition (Behavioral Study):
| Condition | STRT (milliseconds) Mean (Standard Deviation) |
|---|---|
| Boredom | 519.617 (117.597) |
| Flow | 556.629 (131.230) |
| Frustration | 526.227 (204.254) |
The results reported align with Eq.3 and Fig,3 because:
- The Flow state is at 1 bit (500 ms)
- Boredom state is to the left of Flow at less than 1 bit.
- Frustration state is to the right of Fow at more than 1 bit.
The researches' concern was that the difference in Bits (milliseconds) between Flow and boredom was much larger than between FLow and Frustration. That actually is to be expected according to our model.
If we look at Fig. 3 we see that all levels of Boredom are compressed in 1 bit of information. Real boredom is at 0, which is probably difficult to measure experimentally.
On the other hand a small deviation below 1 bit is considered Frustration.
We see that in two bits of information Frustration level changes only 20% down. In comparison, in just one bot of information Boredom can change 100% down.
That would explain the small difference the researchers found between STRT for Flow and Frustration, compared to Flow and Boredom.
Conclusion
In conclusion, the introduction of a novel mathematical model to quantify the Skill-Challenge Balance, rooted in information theory, represents a significant advancement in our understanding of Flow states, particularly within knowledge-intensive work environments such as software development. This model's unique approach to balancing perceived individual capabilities and task challenges through the concepts of mutual and conditional information provides a scientifically grounded method for identifying and assessing Flow states.
By establishing the Knowledge Discovery Efficiency (KEDE) as a key metric, this research offers a clear, quantifiable means to evaluate the alignment between a person's skills and the complexities of their tasks. The identification of an optimal KEDE value at 1/2 as the hallmark of Flow underscores the delicate balance required to maintain engagement and productivity without veering into anxiety or boredom.
The model advances the understanding of Flow in professional settings by providing a scientifically grounded method to assess the dynamic interplay between individual skills and task challenges, offering potential pathways to enhance workplace productivity and well-being.
Appendix
Calculating the Symbol Rate
The symbol rate refers to the number of symbols (letters) typed per time interval. Given that 27 symbols are typed over 37 time intervals (since typing a symbol and asking a binary question each take one time interval), the symbol rate R symbol is calculated as:
he symbol rate (symbols typed per time interval) for typing the word is approximately 0.73, meaning that, on average, about 73% of each time interval was dedicated to typing a symbol.
Calculating the Information Rate
The information rate, on the other hand, refers to the amount of information processed or communicated per unit of time. In the context of our scenario, it would relate to the number of binary questions asked (which represent gaining information to reduce uncertainty about what to type) per total time intervals. Since 10 binary questions were asked over the same 37 time intervals, the information rate R info would be:
The information rate (information gained per time interval, represented here by the binary questions asked) is approximately 0.27. This suggests that, on average, about 27% of each time interval was dedicated to gaining the information needed to reduce uncertainty about what to type next.
Knowledge Discovery Game
To practice measuring person happiness, you can try the Knowledge Discovery Game. This game simulates the knowledge discovery process, enabling you to evaluate the balance between person abilities and task complexity.
How to cite:
Bakardzhiev D.V. (2023) A mathematical theory of the state of Flow : A knowledge-centric approach https://docs.kedehub.io/kede/kede-flow.html
Works Cited
1. Csikszentmihalyi, M. 1990. Flow: the psychology of optimal experience. United States of America: Harper & Row.
2. Csikszentmihalyi, M 1975. Beyond Boredom and Anxiety: The Experience of Play in Work and Games. San Francisco: Jossey-Bass
3. Schaffer, O. 2013. Crafting Fun User Experiences: A Method to Facilitate Flow. Human Factors International Whitepaper. Retrieved from: https://scholar.google.com/scholar?cluster=9760324565241258858
4. Stamp, G. (1991), "WELLBEING AND STRESS AT WORK", Employee Counselling Today, Vol. 3 No. 3, pp. 3-9. https://doi.org/10.1108/13665629110140735
5. Csikszentmihalyi, M. & Csikszentmihalyi, I.S. (Eds) (1988). Optimal experience: Psychological studies of flow in consciousness. New York: Cambridge University.
6. Anderson, D.R., Crous, F. & Schepers, J.M. (1996). Flow and quality of work life in a diverse workforce. Journal of Industrial Psychology, 22 (3)13-20.
7. Lu, L. (1999). Work motivation, job stress and employees’ wellbeing. Journal of Applied Management Studies, 8 (11) 61-74.
8. Loubris, S., Crous, F & Schepers, J.M. (1995). Management by objectives in relation to optimal experience in the workplace. Journal of Industrial Psychology. 21 (2), 12-17.
9. Csikszentmihalyi, M. & Nakamura, J. (2010). Effortless Attention in Everyday Life: A Systematic Phenomenology . In Bruya, B. (Ed.), Effortless Attention. (pp. 179- 190). Cambridge, MA: MIT Press.
10. Keller, J., & Bless, H. 2008. Flow and regulatory compatibility: an experimental approach to the flow model of intrinsic motivation. Personality & Social Psychology Bulletin (34:2), pp. 196-209
11. Dochy, F., Segers, M., and Buehl, M. M. (1999). The relation between assessment practices and outcomes of studies: the case of research on prior knowledge. Rev. Educ. Res. 69, 145–186. doi: 10.3102/00346543069002145
12. Schmidt HK, Rothgangel M, Grube D. Prior knowledge in recalling arguments in bioethical dilemmas. Front Psychol. 2015 Sep 8;6:1292. doi: 10.3389/fpsyg.2015.01292. PMID: 26441702; PMCID: PMC4562264.
13. Keller J., Bless H., Blomann F., Kleinböhl D. Physiological aspects of flow experiences: Skills-demand-compatibility effects on heart rate variability and salivary cortisol. J. Exp. Soc. Psychol. 2011;47:849–852. doi: 10.1016/j.jesp.2011.02.004.
14. Shannon, C. E. (1948). A Mathematical Theory of Communication. Bell System Technical Journal. 1948;27(3):379-423. doi:10.1002/j.1538-7305.1948.tb01338.x
15. Harmat, L., de Manzano, €O., Theorell, T., H€ogman, L., Fischer, H., & Ull en, F. (2015). Physiological correlates of the flow experience during computer game playing. International Journal of Psychophysiology, 97(1), 1–7.
16. Baumann, N., L€urig, C., & Engeser, S. (2016). Flow and enjoyment beyond skill-demand balance: The role of game pacing curves and personality. Motivation and Emotion, 40(4), 507–519.
17. Engeser, S., & Rheinberg, F. (2008). Flow, performance and moderators of challenge-skill balance. Motivation and Emotion, 32(3), 158–172.
18. Keller, J., & Bless, H. (2008). Flow and regulatory compatibility: An experimental approach to the flow model of intrinsic motivation. Personality and Social Psychology Bulletin, 34(2), 196–209.
19. Keller, J., Bless, H., Blomann, F., & Kleinb€ohl, D. (2011). Physiological aspects of flow experiences: Skills-demand-compatibility effects on heart rate variability and salivary cortisol. Journal of Experimental Social Psychology, 47(4), 849–852.
20. Keller, J., Ringelhan, S., & Blomann, F. (2011). Does skills–demands compatibility result in intrinsic motivation? Experimental test of a basic notion proposed in the theory of flow-experiences. The Journal of Positive Psychology, 6(5), 408–417.
21. Kennedy, P., Miele, D. B., & Metcalfe, J. (2014). The cognitive antecedents and motivational consequences of the feeling of being in the zone. Consciousness and Cognition, 30, 48–61.
22. Tozman, T., Zhang, Y. Y., & Vollmeyer, R. (2017). Inverted Ushaped function between flow and cortisol release during chess play. Journal of Happiness Studies, 18(1), 247–268.
23. Abuhamdeh, S., & Csikszentmihalyi, M. (2012). The importance of challenge for the enjoyment of intrinsically motivated, goaldirected activities. Personality and Social Psychology Bulletin, 38(3), 317–330.
24. Jin, S. A. A. (2012). “Toward integrative models of flow”: Effects of performance, skill, challenge, playfulness, and presence on flow in video games. Journal of Broadcasting & Electronic Media, 56(2), 169–186.
25. Løvoll, H. S., & Vittersø, J. (2014). Can balance be boring? A critique of the “challenges should match skills” hypotheses in flow theory. Social Indicators Research, 115(1), 117–136.
26. Moneta, G. B., & Csikszentmihalyi, M. (1996). The effect of perceived challenges and skills on the quality of subjective experience. Journal of Personality, 64(2), 275–310.
27. Vuorre, M., & Metcalfe, J. (2016). The relation between the sense of agency and the experience of flow. Consciousness and Cognition, 43, 133–142.
28. Wilson, R.C., Shenhav, A., Straccia, M. et al. The Eighty Five Percent Rule for optimal learning. Nat Commun 10, 4646 (2019). https://doi.org/10.1038/s41467-019-12552-4
29. Melnikoff, D., Stillman, P. E., & Carlson, R. W. (2022). A Computational Theory of the Subjective Experience of Flow. https://doi.org/10.1038/s41467-022-29742-2
30. Bakardzhiev, D., Vitanov, N.K. (2025). KEDE (KnowledgE Discovery Efficiency): A Measure for Quantification of the Productivity of Knowledge Workers. In: Georgiev, I., Kostadinov, H., Lilkova, E. (eds) Advanced Computing in Industrial Mathematics. BGSIAM 2022. Studies in Computational Intelligence, vol 641. Springer, Cham. https://doi.org/10.1007/978-3-031-76786-9_3
31. Chambon, V., & Haggard, P. (2013). Premotor or Ideomotor: How Does the Experience of Action Come About?. Action science: Foundations of an emerging discipline, 359.
32. Huskey, R., Keene, J., Wilcox, S., Gong, X., Adams, R., & Najera, C. J. (2023). Flexible and Modular Brain Network Dynamics Characterize Flow Experiences During Media Use: A Functional Magnetic Resonance Imaging Study.
33. Huskey, R., Craighead, B., Miller, M. B., & Weber, R. (2018). Does Intrinsic Reward Motivate Cognitive Control? A Naturalistic-fMRI Study Based on the Synchronization Theory of Flow. Cognitive, Affective, and Behavioral Neuroscience, 18(5), 902-924. doi: 10.3758/s13415-018-0612-6
34. Asteroid Impact
35. Wu, T., Dufford, A. J., Mackie, M. A., Egan, L. J., & Fan, J. (2016). The Capacity of Cognitive Control Estimated from a Perceptual Decision Making Task. Scientific Reports, 6, 34025.
36. Guan, Q., Wang, J., Chen, Y., Liu, Y., & He, H. (2021). Beyond information rate, the capacity of cognitive control predicts response criteria in perceptual decision-making. Brain and cognition, 154, 105788. https://doi.org/10.1016/j.bandc.2021.105788
37. Jain, A., Bansal, R., Kumar, A., & Singh, K. D. (2015). A comparative study of visual and auditory reaction times on the basis of gender and physical activity levels of medical first year students. International journal of applied & basic medical research, 5(2), 124–127. https://doi.org/10.4103/2229-516X.157168
Getting started


