How to Measure Developer Cognitive Load
A knowledge-centric approach.
Related Articles
Key takeaways
- Cognitive load refers to the total amount of mental effort required for a task.
- To measure cognitive load, we quantify how many options a software developer must consider and remember to successfully complete a task. This encompasses the number of work items, their interrelations, and the range of alternatives.
- Knowledge Discovery Efficiency (KEDE) aims to enhance software development practices by focusing on the knowledge that developers lacked before beginning a task. This knowledge gap directly influences developer's experience, impacting their happiness and productivity.
- Using KEDE, we can quantify in bits of information the cognitive load a software developer experienced while working.
What is Cognitive load?
Cognitive load refers to the total amount of mental effort required for a task, such as software development[6]. Rooted in cognitive psychology, this concept is closely related to cognitive control, the processing capacity of the conscious mind, and working memory capacity.
The processing capacity of the conscious mind refers to the amount of mental resources that are available to process and understand information. While a great deal occurs below the threshold of our awareness, and this has an impact on how we feel and what our life is going to be like, in order for something to become encoded as part of your experience, you need to have paid conscious attention to it[9].
Working memory, often referred to as the "mental scratchpad", is a cognitive system that allows individuals to temporarily store and manipulate information in their minds. It plays an important role in a variety of mental tasks, including problem-solving, decision-making, and learning.
In 1956, cognitive psychologist George Miller proposed that the number of items humans can actively hold in their conscious awareness at once is limited to about seven[4]. However, more recent research suggests that the limit may be closer to four or five items[8]. This has been interpreted to mean that the human brain can hold about 2 to 3 bits of information in working memory at a time, where each bit represents a binary decision.
The precise limit is determined by each individual's memory capacity, with activity from low-capacity individuals reaching this plateau sooner than that from high-capacity individuals[5]. Cognitive capacity is directly related to cognitive ability[6][7].
The cognitive load can increase significantly when individuals are presented with a large number of options, a phenomenon known as "choice overload" or the "paradox of choice."[11]. This leads to hindered decision-making and a reduced likelihood of selecting rational and objective options[2][3].
Measuring Cognitive Load
"The more possibilities we are confronted with, the more perplexed and challenged we are likely to be.” ~ Aurelian Craiutu, Faces of Moderation
To quantify how a large number of options affects cognitive load, we can consider the "search space" of options contributing to the "perplexity" of the decision task. The larger the search space, the more cognitive resources are required to make a decision.
Perplexity, commonly used in natural language processing and machine learning, refers to the uncertainty or unpredictability of a model's output. In a broader sense, perplexity can be understood as a measure of the complexity, difficulty, uncertainty, or unpredictability of a problem or task. A person might be in a state of perplexity when trying to solve a difficult puzzle or find an object in a large search space. A more complex or difficult task might have a greater number of possible states or options to consider, which might increase the feeling of uncertainty or confusion.
Perplexity might be thought of as the average number of potential solutions or answers that are available within a particular domain.
To quantify perplexity, we need to know how many options a software developer must consider and remember to successfully complete a task. This can be challenging, if not impossible, since it involves understanding the individual's thought process!
However, we can measure the knowledge discovered after completing the work. This knowledge equals the difference between the prior knowledge a software developer had and the knowledge required to develop the work item.
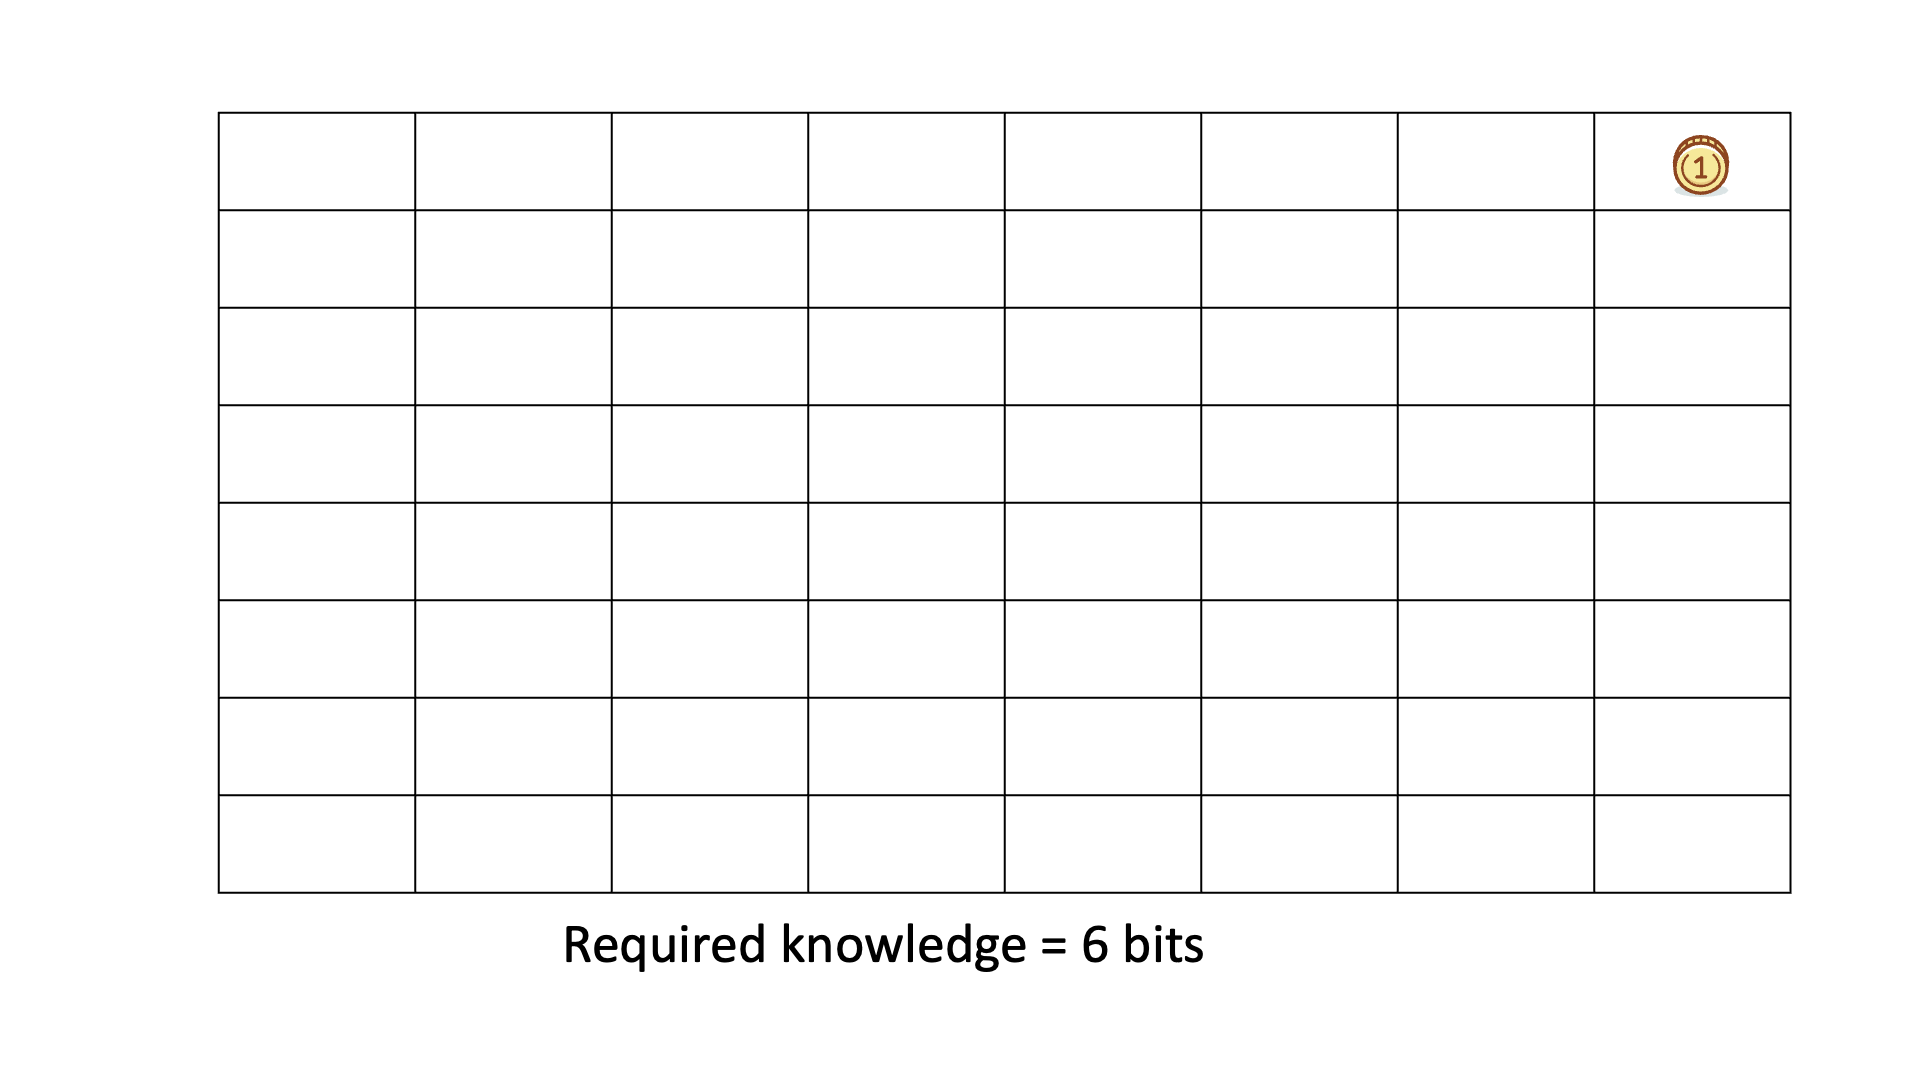
Let's look back at the game where we searched for a gold coin in a number of boxes. The number of boxes is the size of the search space. Hence if we know the number of questions asked H we can calculate the number of boxes:
That is what information theory calls “perplexity”. It is good to point out that perplexity cannot be zero. At the minimum it can be one.
Below is an animated example of calculating perplexity when we search for a gold coin hidden in 1 of 64 boxes.
Knowledge Discovery Efficiency (KEDE) is a measure for understanding the knowledge gap that a software developer needs to bridge in order to successfully complete a task. It quantifies the knowledge that was lacking before the developer began their task - this is the knowledge that they needed to acquire. This knowledge gap is of utmost importance, as it directly influences the developer's experience, impacting their happiness and productivity. KEDE values can be anywhere from 0 to 100. A KEDE near 0 implies situations where the knowledge gap is enormous, like when creating completely new knowledge - think Albert Einstein or pioneering startups like Paypal. A KEDE value near 100 signifies situations where there's virtually no knowledge gap, as if we're looking at an omniscient entity. An expert full-time software developer, who mostly applies prior knowledge but also creates new knowledge when required, would have a KEDE of about 20. The less knowledge to be discovered the lower the perplexity for the human involved.
Taking into consideration how KEDE correlates with perplexity, we can say that::
For instance, if a knowledge worker has KEDE=100, it means she had to find a coin in only one box.
This situation reflects a perplexity of 1, indicating there was only one possible answer to the question: "Where is the gold coin?" This is the minimum value.
However, if a knowledge worker has KEDE=20, it implies she had to find a coin among 16 boxes, indicating a tolerable perplexity level.
But if a knowledge worker had KEDE=1, equivalent to answering 99 binary questions, it means she had to find a coin among approximately 6.3x1029 boxes!
To contextualize, there are an estimated 1022 to 1024 stars in the Universe[1]. The number of boxes was significantly greater than the number of stars in the Universe! We can infer that the software developer faced an exceedingly high level of perplexity.
Recall that when we have n equally sized boxes the average number of questions needed to find the coin location is:
Thus, by using KEDE, we can quantify in bits of information the cognitive load a software developer experienced while working.
Practical examples of how to measure cognitive load
Assessing a developer's cognitive load involves examining it over time. The following diagram depicts a developer's weekly cognitive Load over a selected period across all projects.
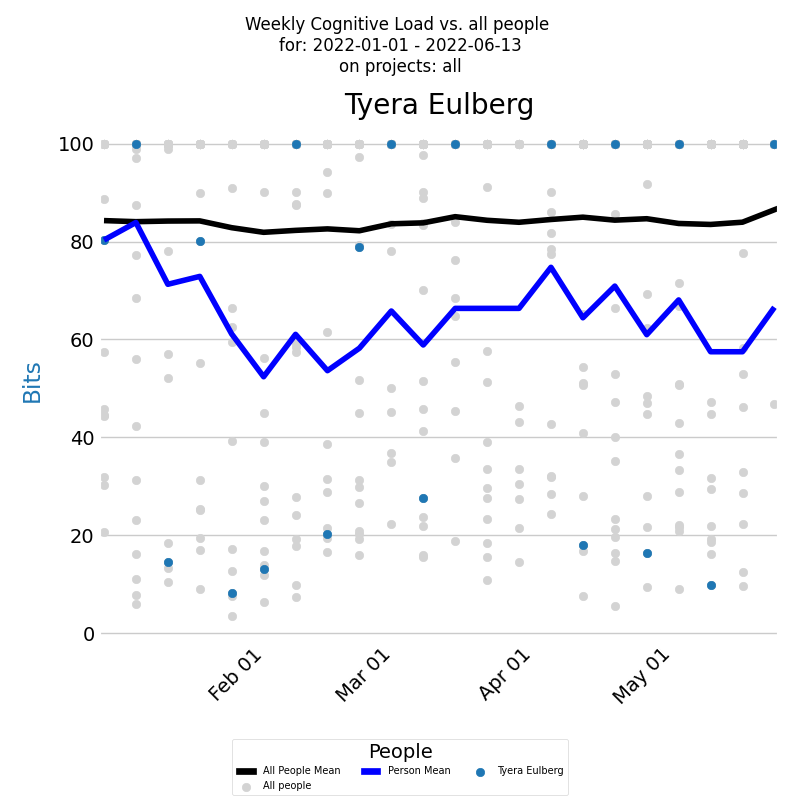
The x-axis shows the week weeks, and the y-axis denotes weekly cognitive Load values. The blue dot for each week represents a developer's cognitive Load. The dark blue line signifies a developer's average weekly cognitive Load. Comparisons with the company average can be made by examining cognitive Load for all contributing developers during this period, depicted by light gray dots. The black line signifies these developers' average weekly cognitive Load.
Examining the frequency distribution of a developer's averaged cognitive Load over time can be informative. A histogram, as shown below, can illustrate this distribution.
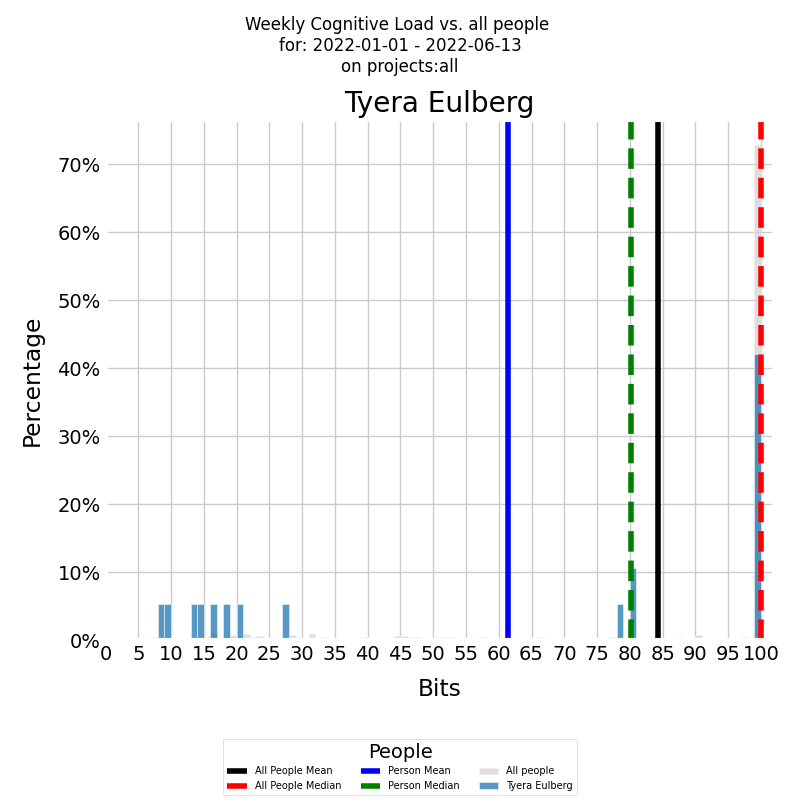
The x-axis displays the weekly KEDE, while the y-axis shows the frequency of each specific value. The colored histogram represents the developer's cumulative cognitive Load. The blue vertical line denotes the developer's average weekly cognitive Load for the selected period, while the green dashed line indicates the median weekly cognitive Load.
Both diagrams show that there were weeks, with a KEDE=10, when the selected developer experienced a cognitive load equivalent to searching in just 512 boxes. However, the developer's capability typically ranged between 2 and 4. This suggests that their cognitive load was akin to searching through approximately 16,777,216 boxes. Even though this cognitive load is considerable, it's still much lower compared to the average load within the company, where KEDE=1 corresponds to a number of boxes that exceeds the total number of stars in the Universe! Furthermore, the company's median cognitive Load is less than 0.5, indicating that half of the time, the cognitive load was intolerable!
As an initial measure, it would be beneficial to examine why the selected developer has a significantly better work experience than the rest of the company. Directly asking the developer could be a good approach, but for a deeper understanding of a developer's knowledge discovery efficiency, one should analyze its distribution across various projects. The diagram below shows a stacked bar chart of the developer's weekly efficiency divided by projects during a selected period.
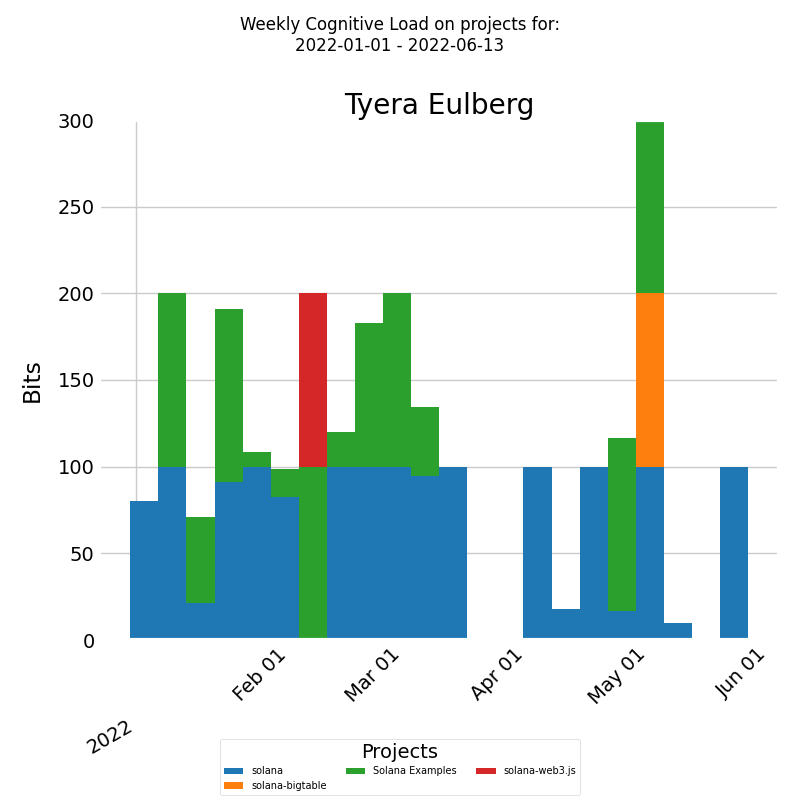
The x-axis denotes week dates and the y-axis indicates weekly cognitive Load. Each bar represents a week's cognitive Load for the developer, divided into segments according to the proportion of weekly cognitive Load for each project.
For this specific developer, their cognitive load appears to remain constant, regardless of the project. As a result, it may be necessary to conduct a comprehensive examination of the company as a whole to pinpoint patterns or trends affecting their job satisfaction.
In response, we recommend that the company's leadership investigate the factors contributing to such extreme cognitive loads for the average developer. Based on my experience as an engineering manager, these factors could include insufficient training, prolonged feedback loops, unclear requirements, etc.
Works Cited
1. How many stars are there in the Universe? (n.d.). Retrieved January 11, 2022, from https://www.esa.int/Science_Exploration/Space_Science/Herschel/How_many_stars_are_there_in_the_Universe
2. Besedeš, T., Deck, C., Sarangi, S., & Shor, M. (2015). Reducing choice overload without reducing choices. Review of Economics and Statistics, 97(4), 793-802.
3. Deck, C., & Jahedi, S. (2015). The effect of cognitive load on economic decision making: A survey and new experiments. European Economic Review, 78, 97-119.
5. Miller, G. A. The magical number seven, plus or minus two: some limits on our capacity for processing information. Psychol Rev 63, 81 (1956).
6. Vogel EK, Machizawa MG. Neural activity predicts individual differences in visual working memory capacity. Nature. 2004 Apr 15;428(6984):748-51. doi: 10.1038/nature02447. PMID: 15085132.
7. Fukuda K, Vogel E, Mayr U, Awh E. Quantity, not quality: the relationship between fluid intelligence and working memory capacity. Psychon Bull Rev. 2010 Oct;17(5):673-9. doi: 10.3758/17.5.673. PMID: 21037165; PMCID: PMC3050565.
8. Unsworth N, Fukuda K, Awh E, Vogel EK. Working memory and fluid intelligence: capacity, attention control, and secondary memory retrieval. Cogn Psychol. 2014 Jun;71:1-26. doi: 10.1016/j.cogpsych.2014.01.003. Epub 2014 Feb 14. PMID: 24531497; PMCID: PMC4484859.
9. Cowan, N. (2001). The magical number 4 in short-term memory: A reconsideration of mental storage capacity. Behavioral and Brain Sciences, 24(1), 87-114. doi:10.1017/S0140525X01003922
10. Levitin, D. J. (2015). The Organized Mind: Thinking Straight in the Age of Information Overload (Illustrated edition). Dutton.
“120 bits per second This estimate derives independently from Csikszentmihalyi (2007) and the Bell Labs engineer Robert Lucky, who made an independent estimate that regardless of the modality, the cortex cannot take in more than 50 bits/second—within an order of magnitude of Csikszentmihalyi’s. Csikszentmihalyi explains his estimate: “As George Miller and others have suggested, we can process 5–7 bits of information in one apperception; each apperception takes at least 1/15th of a second; hence 7 × 15=105 bits/second. Nusbaum has calculated that understanding verbal material takes on the average 60 bits/second.”
11. Schwartz, B., & Schwartz, B. (2004). The paradox of choice: Why more is less.
How to cite:
Bakardzhiev D.V. (2023) How to measure developer cognitive load? https://docs.kedehub.io/kede/kede-on-developer-cognitive-load.html
Getting started


