Understanding a Project's Complexity
A knowledge-centric approach.
Abstract
"All software is simply a representation of knowledge and it is the acquisition of this knowledge that is the real activity of software development." ~ Phillip Glen Armour [1]
In this article we explore how to estimate project complexity using a knowledge-centric approach. This guide is designed to assist managers in assessing the complexity of their software development projects at various levels of precision. This understanding can enhance project management, leading to improved project outcomes.
We begin by understanding project complexity at a low precision level. This approach provides a high-level overview of the project's complexity without focusing on granular details.
Next, we'll delve into medium precision estimation. Here, we determine the number of work items in Quadrants 1, 2, 3, and 4 of the Complexity Profile (CP). We then calculate the percentage of work items in each quadrant by dividing the number of work items in each quadrant by the total number of work items. This method offers a more detailed insight into project complexity, balancing between detail and overview.
Moving on to high precision complexity estimation, we consider not only the number of work items in each quadrant but also the bits of missing information for each work item. This comprehensive understanding allows us to comprehend the distribution of missing information in the project. The percentage for each quadrant is then calculated by dividing the bits in each quadrant by the total amount of bits for the project. This level of precision employs methods such as Contextualization and Categorization and utilizes the Complexity Profile (CP).
Finally, we'll learn the importance of continuously understanding project complexity. We acknowledge that project complexity is not a static attribute and can evolve over time. This continuous understanding allows teams to adapt and adjust their strategies as the project progresses, fostering more successful outcomes.
Understanding project complexity - Low Precision
To understand the complexity of a new project at a very high level with low precision, follow these steps:
-
Gather client-owned factor information:
- Analyze requirements: Review and understand the project requirements, scope, and objectives. Identify the number of requirements, their intricacy, and potential for change. Assess the clarity and stability of the requirements.
- Evaluate client collaboration: Consider the type of client you are working with and their impact on project complexity. Factors such as client size, industry, communication style, and decision-making process can influence complexity.
-
Assess capability-owned factors:
- Assess team structure: Evaluate the individual knowledge, skills, and expertise of team members, as well as the interdependence between teams or groups possessing specific information required for a project to progress, can influence the amount of knowledge that needs to be acquired during a project.
- Assess technology expertise: Determine the level of expertise your team has with the algorithms, technologies, tools, and frameworks to be used in the project. Consider the learning curve associated with new technologies and the potential impact on project complexity.
- Assess Code Base expertise: If the project involves working with an existing code base or starting from scratch, consider the impact of the team's familiarity with the code base and the potential risks and challenges associated with it, such as technical debt, outdated dependencies, or a lack of proper documentation.
- Evaluate domain expertise: Assess your team's knowledge and experience in the project's domain or industry. Identify potential knowledge gaps that may need to be filled to successfully complete the project.
- Review development process: Determine the development process (e.g., Agile, Waterfall) to be used for the project and consider how it may impact project complexity. When it comes to discovering missing information, Agile and Waterfall development processes handle this aspect differently.
Based on the gathered information and analysis, estimate the overall complexity of the project, taking into account both client-owned and capability-owned factors.
One of the quadrants is the whole area, for example:
- Quadrant 1 (Knowledge to be discovered on what to do): (1) 100%
- Quadrant 2 (Knowledge to be discovered on how to do it): (0) 0%
- Quadrant 3 (Knowledge to be discovered on what to do and how to do it): (0) 0%
- Quadrant 4 (Prior knowledge on what to do and how to do it): (0) 0%
Use this understanding to plan and manage the project effectively, considering the unique challenges and opportunities that may arise from its complexity level.
Understanding Project Complexity - Medium Precision
For this case, we'll need to determine the number of work items in Quadrants 1, 2, 3, and 4. Then, we can calculate the percentage for each quadrant by dividing the number of work items in each quadrant by the total work items.
To assess the complexity of a new project:
- We start by setting zero in each of the quadrants.
- Break the new project into several major components.
- For each component, estimate its overall complexity, taking into account both client-owned and capability-owned factors.
- Add a number to the respective quadrant based on the complexity assessment. For instance, if the first component belongs to Quadrant 1 (Knowledge to be discovered on what to do), then add 1 the to number there. Don't change the numbers in the rest of the quadrants.
- Repeat the process for all the project's components.
Now, we know the distribution of missing information in the project. Then, we can calculate the percentage for each quadrant by dividing the number of work items in each quadrant by the total work items.
In the end, each quadrant will be assigned a number representing the number of components assigned to it. For example, a project consists of 10 work items:
- Quadrant 1 (Knowledge to be discovered on what to do): (2/10) 20%
- Quadrant 2 (Knowledge to be discovered on how to do it): (3/10) 30%
- Quadrant 3 (Knowledge to be discovered on what to do and how to do it): (2/10) 20%
- Quadrant 4 (Prior knowledge on what to do and how to do it): (3/10) 30%
Forecasting Project Complexity
Randomized Branch Sampling (RBS) is a multi-stage unequal probability sampling method originally designed for efficiently forecasting the total number of fruits in a tree canopy. In the context of software development, RBS can be applied to estimate the missing information at the beginning of a project by mapping a product backlog to a branching system. The project scope is divided into epics, which are further broken down into user stories. The RBS method leverages conditional selection probabilities and unbiased estimators to estimate the total missing information in bits for the project.
The application of RBS for forecasting missing information in bits in a new software project offers a unique approach explained in detail here.
Understanding project complexity - High Precision
For this case, we'll need to determine not only the number of work items in Quadrants 1, 2, 3, and 4, but also the bits of information for each work item. In fact, we know the distribution of missing information in the project. Then, we can calculate the percentage for each quadrant by dividing the bits in each quadrant by the total amount of bits for the project.
Contextualization
This contains substantial material from Cynefin Training programmes and Dave Snowden's blog posts. The author acknowledges that use, and further that his use of that material are his own and should not be considered as being endorsed by theCynefinCompany or Dave Snowden.
"Without context, words and actions have no meaning at all. This is true not only of human communication in words but also of all communication..." ~ Gregory Bateson
Our project is a system composed by the people, who will deliver and the people, who define what to be delivered. We shall call the former group Capability and the latter group Client. Capability is represented by the delivering organization's knowledge, skills and experience. The Client is responsible for defining "what to do". The Capability is responsible for defining "how to do the what".
Even though Client and Capability are joined to successfully finish the project, they come from different contexts. Our first task is to establish a shared project context that will have meaning for both Client and Capability. For that we use the Cynefin framework[2]. We create two contextualized Cynefin frameworks - one for the Client and another for the Capability.
Then, both Client and Capability get together to create the complete Cynefin framework for the project from the two contextualized Cynefin frameworks. The goal is to combine the two perspectives into one that we can use operationally. This exercise will also identify perplexity across all the axes we can think of, and help us figure out just how perplexed we are as a system (jointly Client and Capability).
Cynefin is a phenomenological framework, meaning that what we care most about is how people perceive and make sense of situations in order to make decisions[5]. If we allow reality, knowledge and perception to separate wildly everything becomes totally inauthentic. In order to get better alignment inside the system that is our project what we need is to increase the friction between perception, knowledge and reality. They will never be fully aligned but at the same time the misalignment never gets too far[3].
In order to enable sense-making in every unique context the Cynefin framework is created anew. That is called contextualization . In categorization the framework precedes the data. In contextualization the data precedes the framework[4]. The value of a contextualized Cynefin framework is that it provides a unique shared language which reflects the context of the project. This language the Client and the Capability can use to discuss perspectives and possible actions.
We will create two contextualized Cynefin frameworks - one for the Client and another for the Capability. Each group works separately in a sequence. The Client is first and then the Capability follows. This can be done in person or online - but must be done socially.
Client perspective
Client is responsible for defining "what to do." That is needed for each of the user stories to be delivered.
The first thing we need when creating a contextualized Cynefin framework is to write down a list of all the user stories to be delivered. Each user story needs to have a number like 1, 2, ... etc. Then write each user story number on hexagon cards.
Then we describe to the participants the three Cynefin domains - Clear, Complicated, Complex. Client's perplexity about the nature of the requirements defines the Cynefin domains for the Client's context. The labels are about “what” are the user stories that need to be delivered. We will use only three cases:
- Clear. The client knows exactly what they need. They have it already defined. There are no alternatives. It requires zero questions to be asked. No perplexity at all.
- Complicated. The client has a few ideas about what they need. They'll need some expert analysis in order to select one alternative and define it. There are up to 16 alternative and it requires at least 1 and up to 4 questions asked in a row, in sequence, linearly. Perplexity is like they have to find a coin in 16 boxes.
-
Complex.
The client has just a vague idea about what they need.
They'll have to explore many
alternatives before arriving at a definition.
They don't know what they don't know i.e. there are unknown unknowns.
Perplexity is daunting because one of the two holds:
- It requires: at least 5 and up to 99 questions asked, but not in a row, not in sequence and non-linearly. In this case perplexity is too much because of such a big search space.
- They don't know what questions to ask at all!
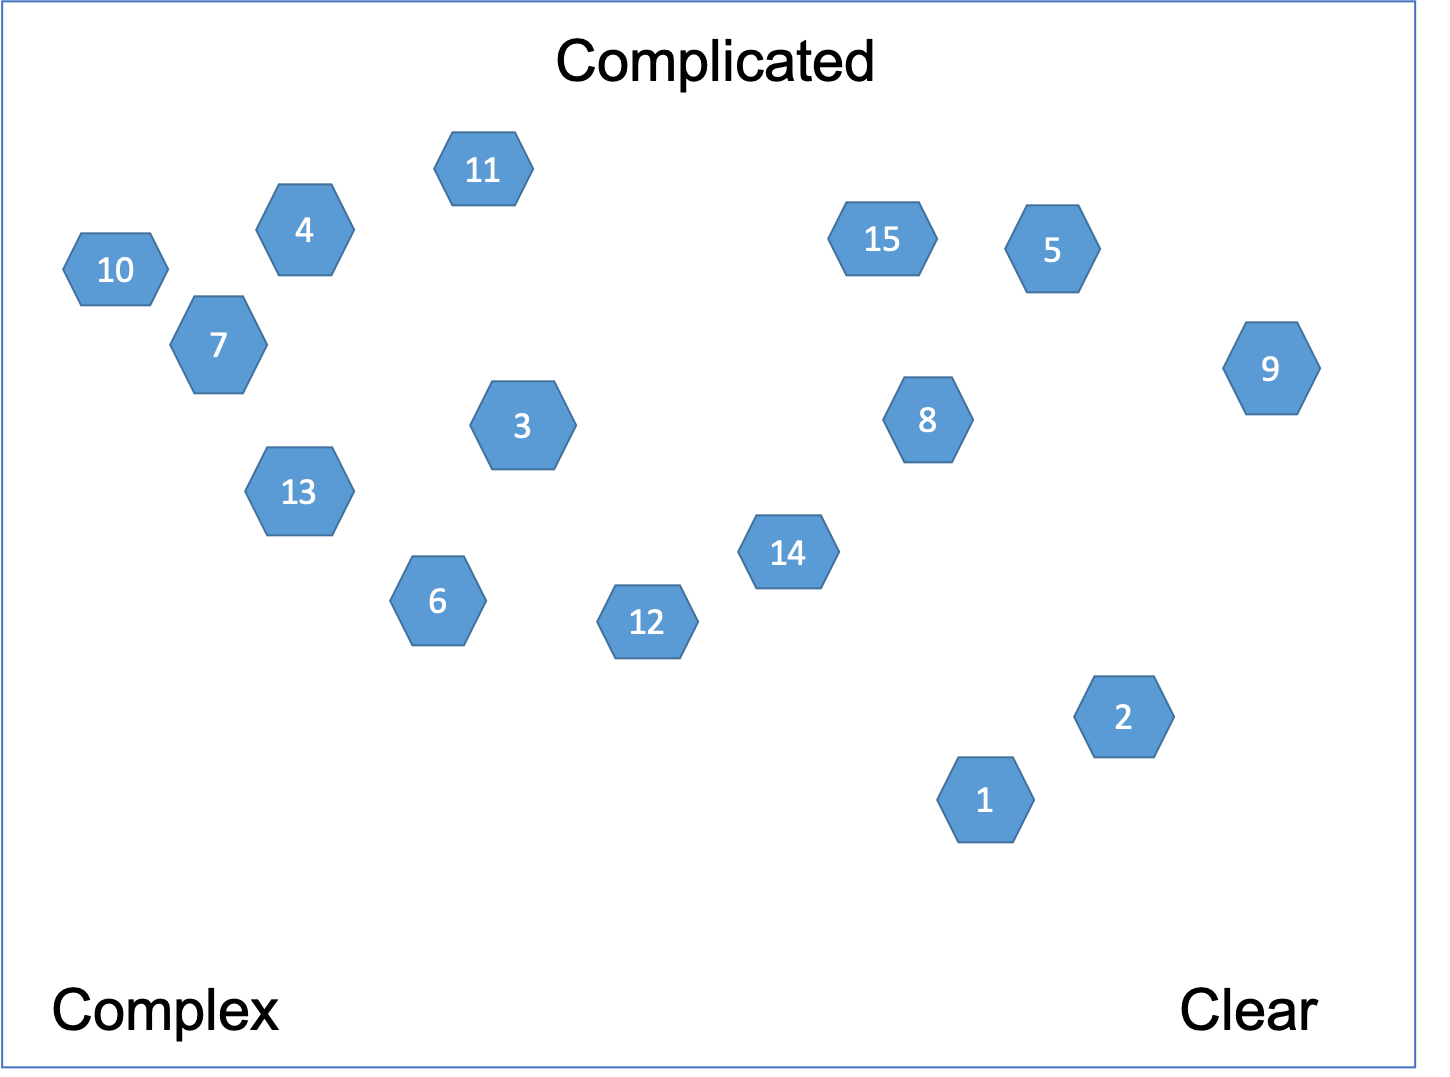
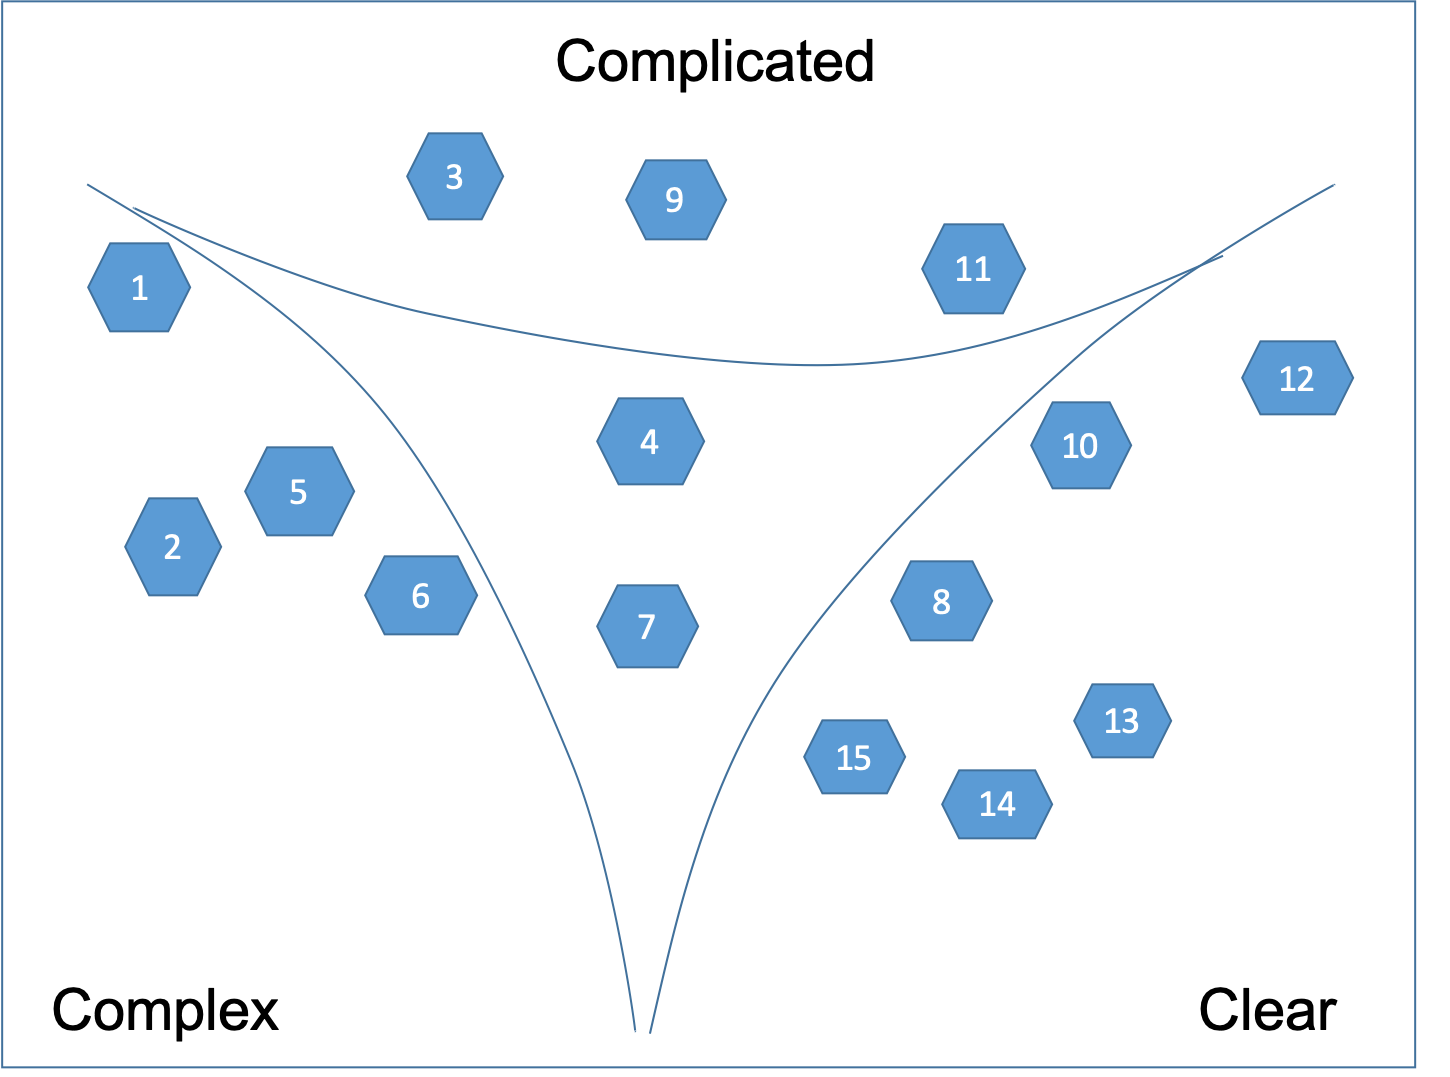
We draw those labels in the corners on a large flip chart as presented on Figure 1. Each of the user stories will be positioned relative to each corner of the overall Cynefin space - without boundaries.
Then we find three cards that fit at the extremes and place one card in each corner. We talk about the extremes in the context of the overall purpose of the project. Some caution is in order - we never give people an example from their own data of what should be in each of the three corners when we are doing this! We realize that people watch what the facilitator is doing and assume a huge amount of intention. If we want to emphasize we pick an example that has nothing to do with their data.
At this point we should have three cards in the three corners of our flip chart. Then we select one of the remaining cards at random and place it as if it has elastic bounds to the three corners. Is it more like this, or that or close to the middle? Again it's a group discussion.
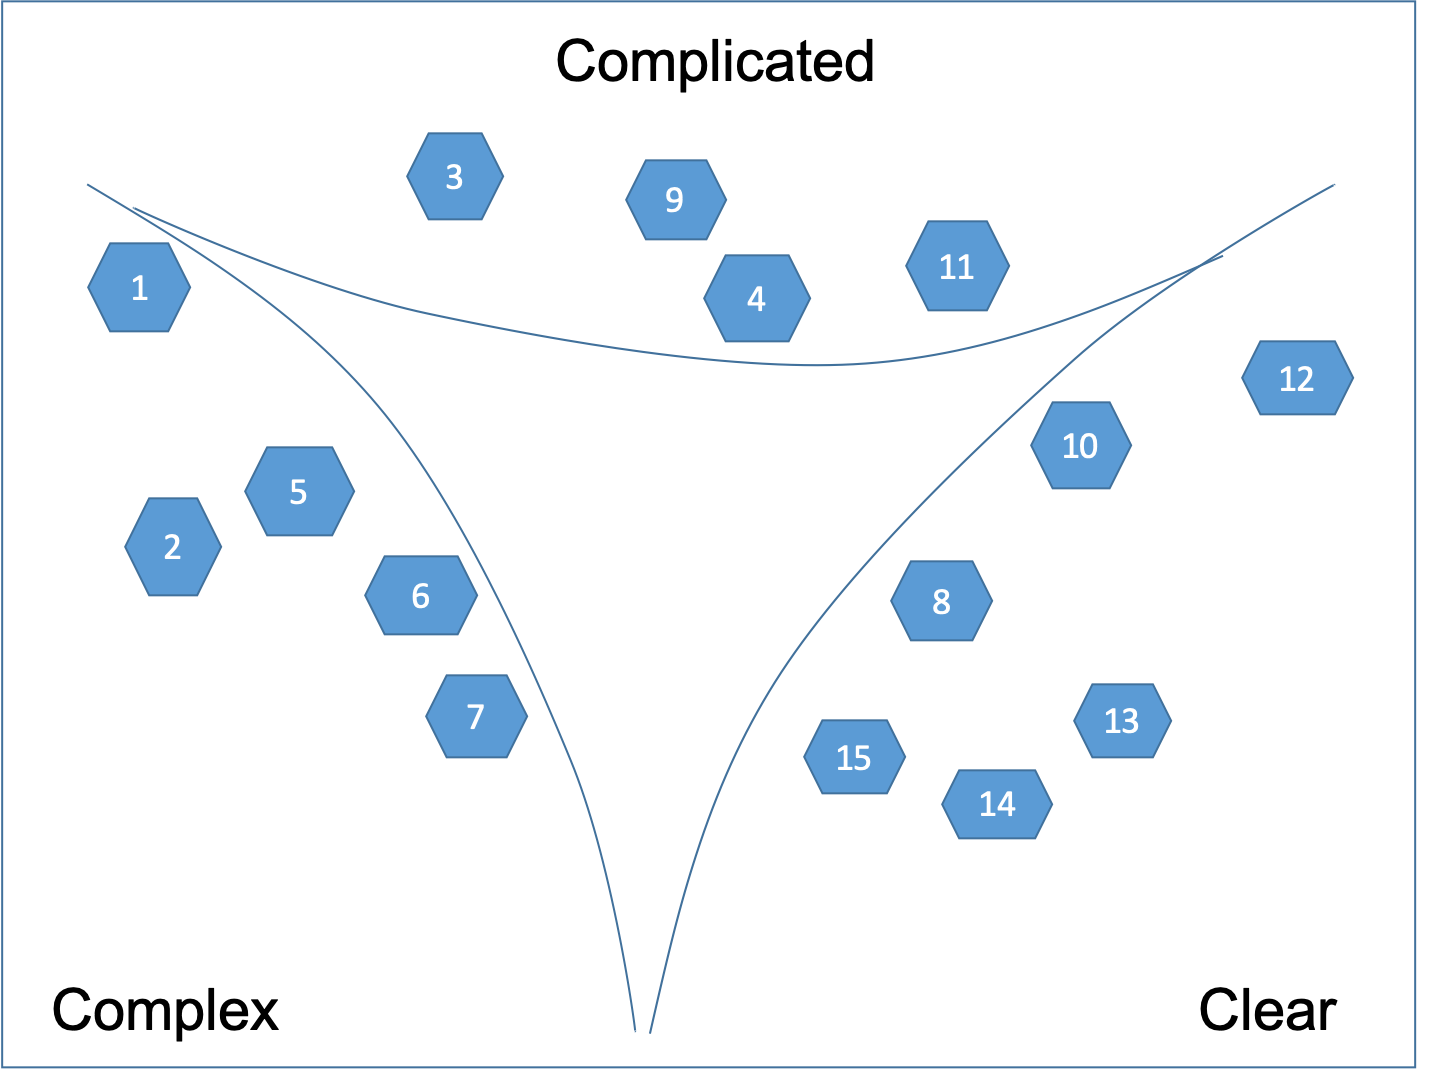
Next step is to loop through all the user stories on the cards. We take another card at random. We place it against the three corners but also to the one we just put down. After that, keep going with the rest of the cards as presented on Figure 1.
Clusters are allowed to form but are not required. Discussion is encouraged while placing the cards. The facilitator is allowed to stop people from not placing a card and saying: “These are the problems we know about them” . People should say: “These are the problems - frankly we are not yet clear about them”. We let people decide for themselves what's in and what's out of a domain.
After the initial placement - we are never allowed to move a card by itself, but only by breaking it down into cards and moving the new cards.
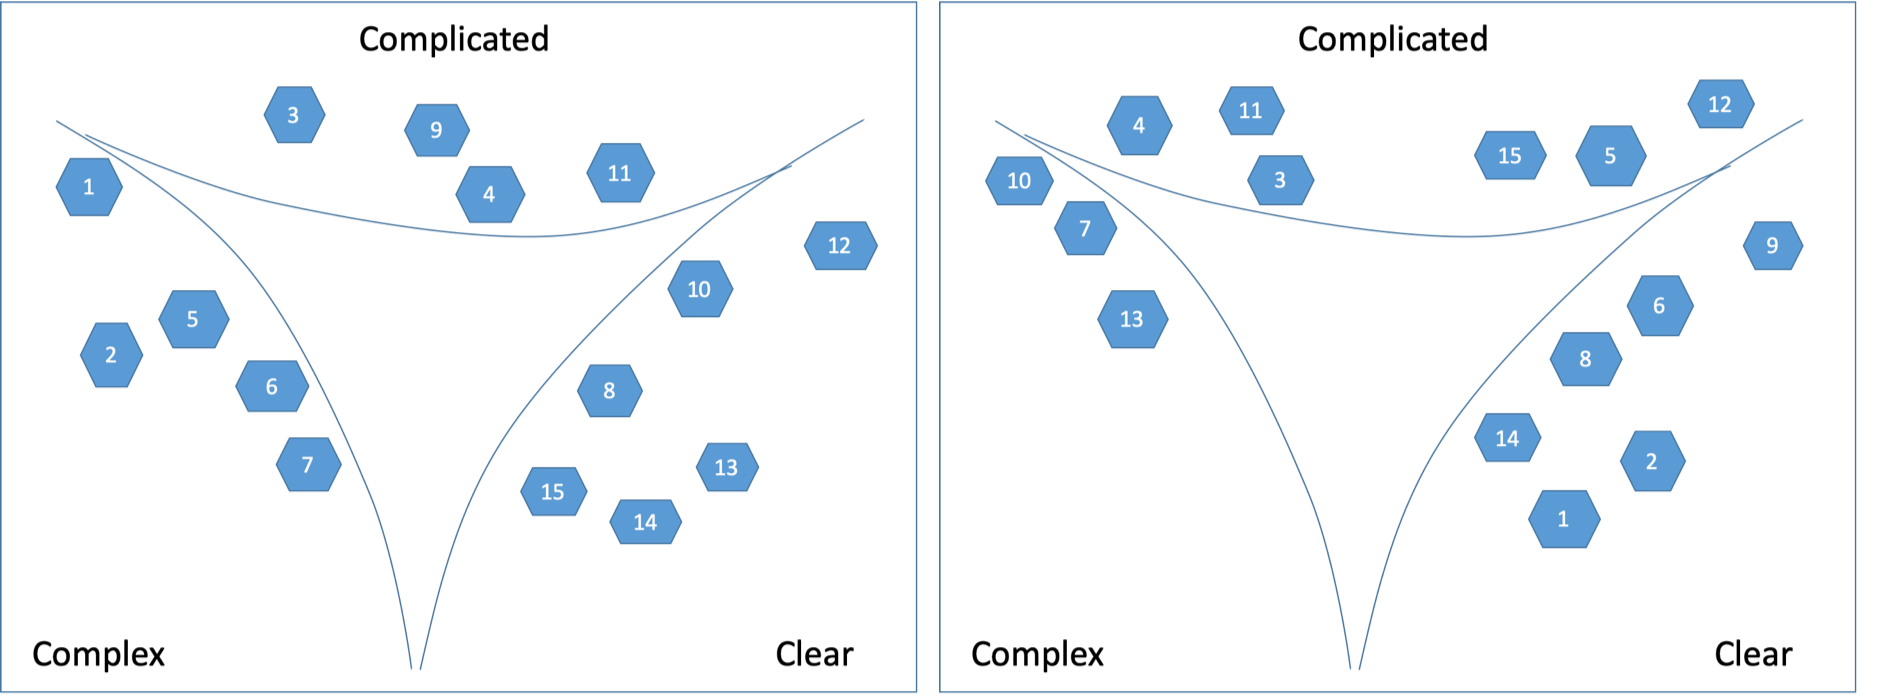
The next step is to define the boundaries as shown on Figure 2.
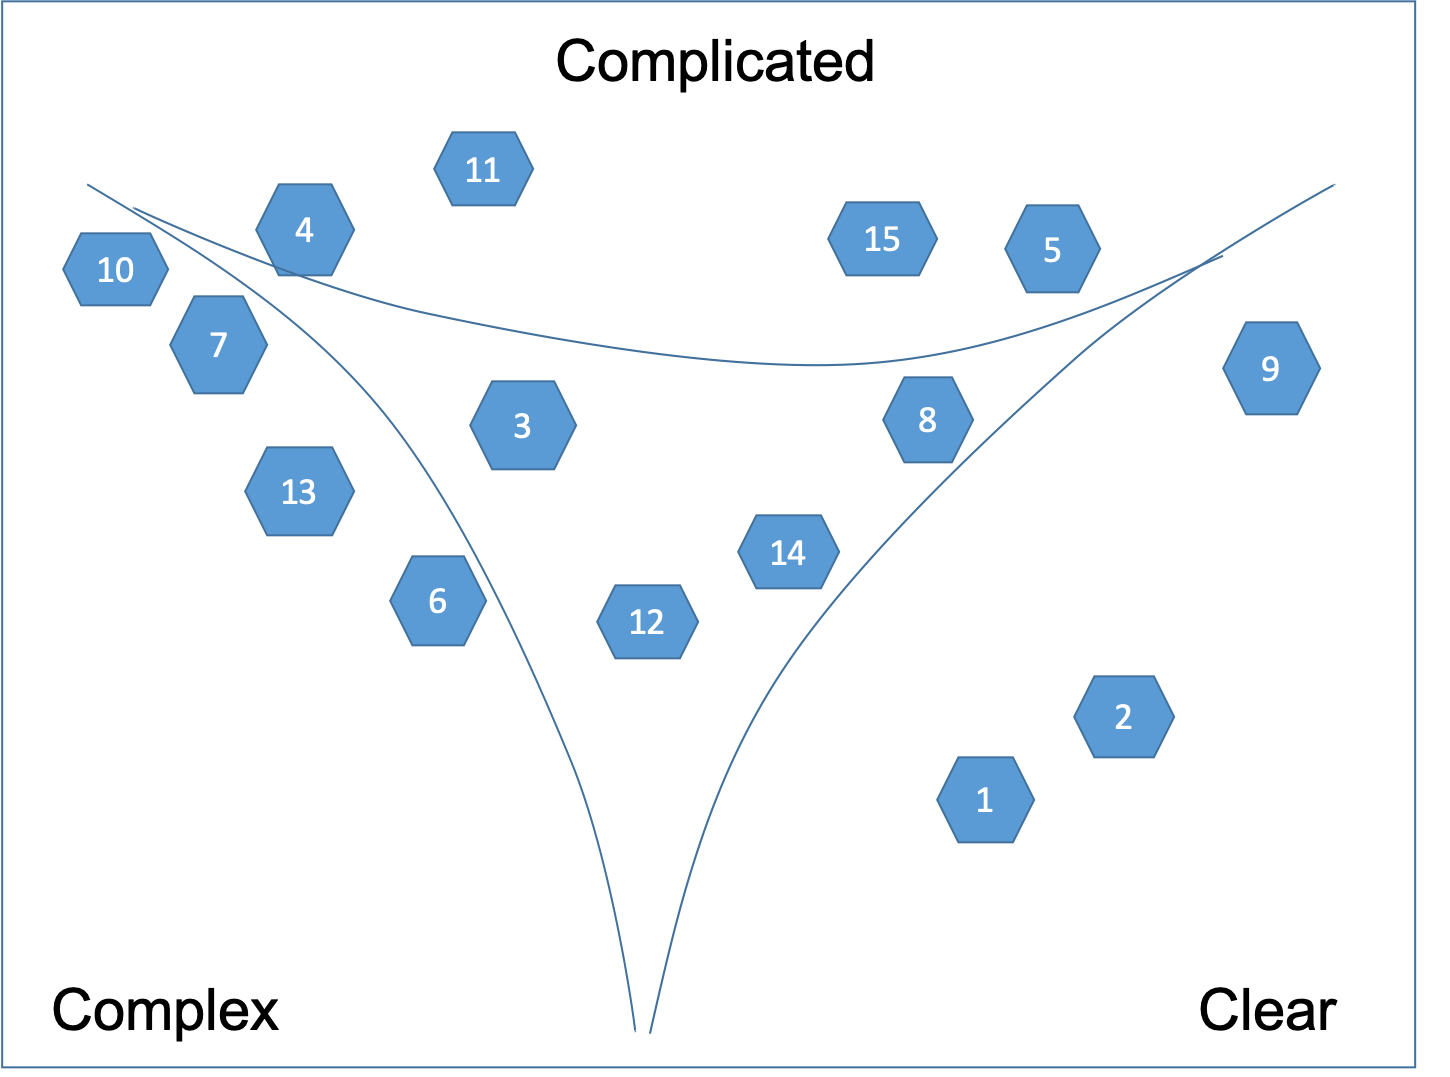
When all cards are placed, lines are drawn between the user stories that are clearly in one domain leaving a central area of disorder. Then the lines are “pulled in” to make the distinctions between domains clearer. If a story is in the central area of disorder or it lies on a line it is split into two or more user stories that can be moved to a particular domain. This process involves discussion as consensus must be reached. By defining the boundaries, we are not pushing people into categorisation! After the contextualization we can move into categorization. We want to have categorization but what we don't want is to have that pre-defined. If people want to do premature categorization we can remind them that's not what they should be doing.
Cards can stay at a boundary but not in the central space. The central space is Confused and we want to get rid of it over time, while we learn more about the nature of what we put in there. Eventually we want to be able to take action and what is in the Confused domain is not actionable.
Typically, the cards that end up in the middle - it's a problem of granularity. The user story on the card is too big - part of it may be complex and another part clear. That's why we can't tell what kind of a problem it really is.
We take those cards in the middle of the flip chart and break it up into multiple new cards. The goal is each of the new cards to fit in one of the three corners. By reducing the granularity of the users stories we allow requirements and needs to combine and recombine more readily to create more sustainable and resilient solutions. The result is shown on Figure 3.
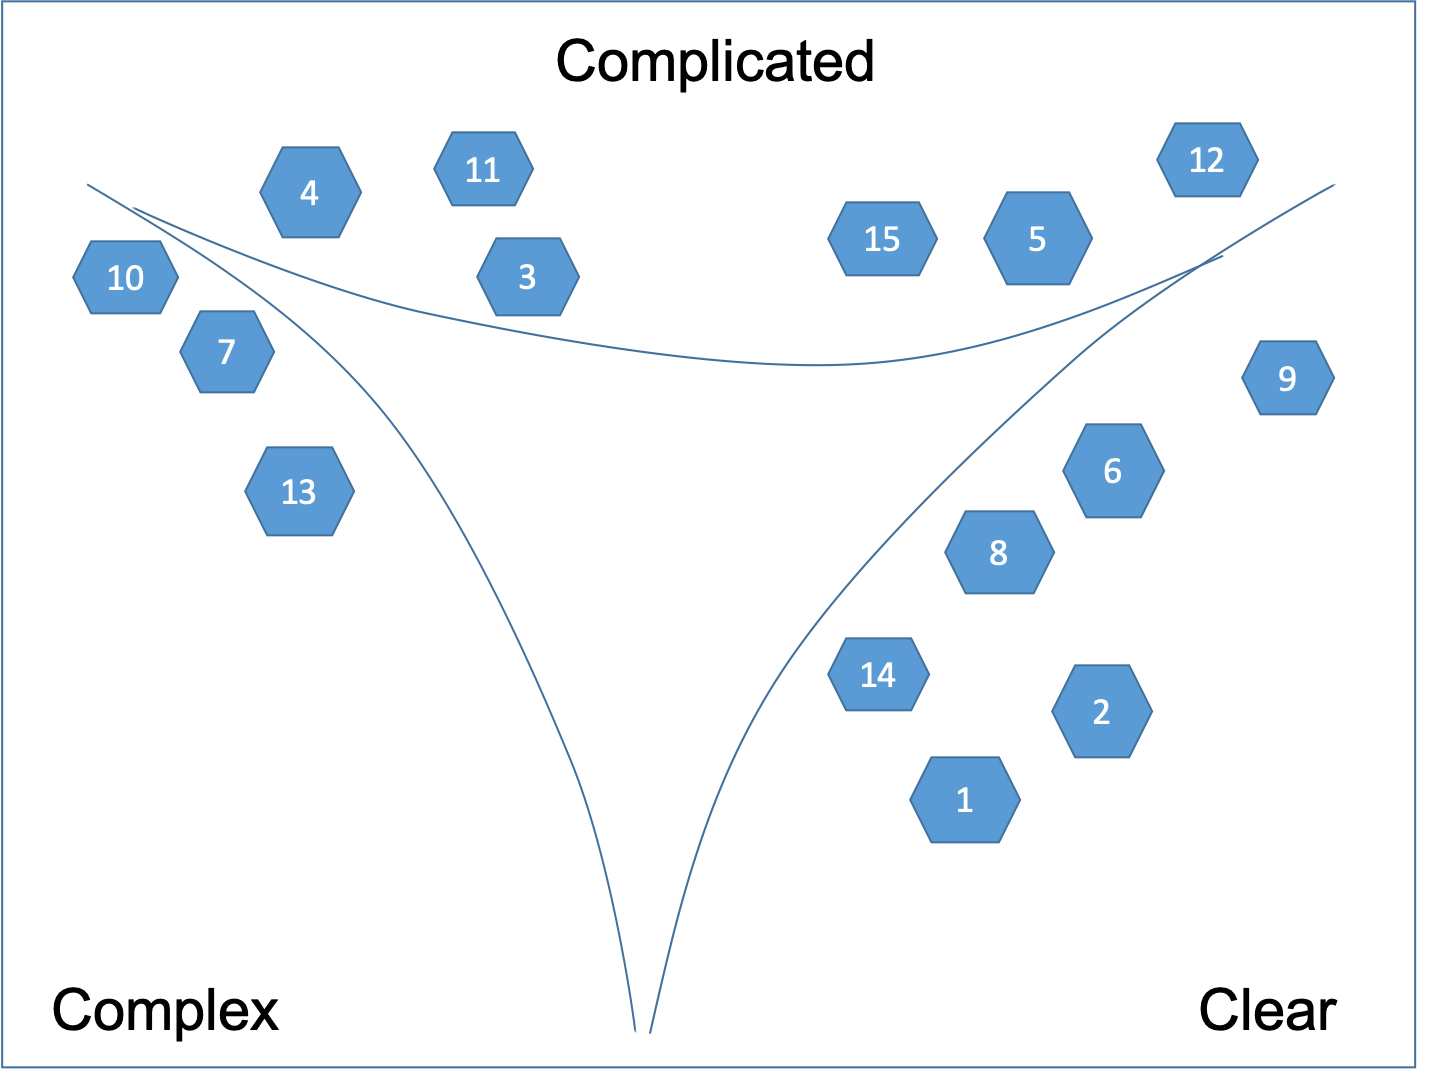
This is a two stage emergence. We are breaking things down, then recombining them again in a different way, then repeating that process. This is designed to break entrained thinking, detect new patterns and gain new perspective and insight.
Capability perspective
Next is to contextualize the same set of user stories but this time from Capability perspective. This time the labels will be different. They are focused on “how” to deliver the "what".
The perplexity about if our development capability would match the requirements defines the Cynefin domains for the Capability's context. Again three cases:
- Clear. They have all the knowledge and skills required to do the job. There are no alternative ways to do it. It requires zero questions to be asked. No perplexity at all.
- Complicated. They have the knowledge and skills required to do the job, but there are up to 16 alternative ways to do it. It requires at least 1 and up to 4 questions asked in a row, in sequence, linearly. As experts they'll research and analyze the alternatives. Perplexity is like they have to find a coin in 16 boxes.
-
Complex.
They have a vague idea about how to do what the client requested.
They'll have to explore many
alternatives before arriving at a solution.
They don't know what they don't know i.e. there are unknown unknowns.
Perplexity is daunting because one of the two holds:
- It requires: at least 5 and up to 99 questions asked, but not in a row, not in sequence and non-linearly. In this case perplexity is too much because of such a big search space.
- They haven't done it before and they'll need to build knowledge and skills. They don't know what they don't know i.e. there are unknown unknowns. They don't know what questions to ask at all!
Again we place the cards according to the three corners as shown on Figure 4.
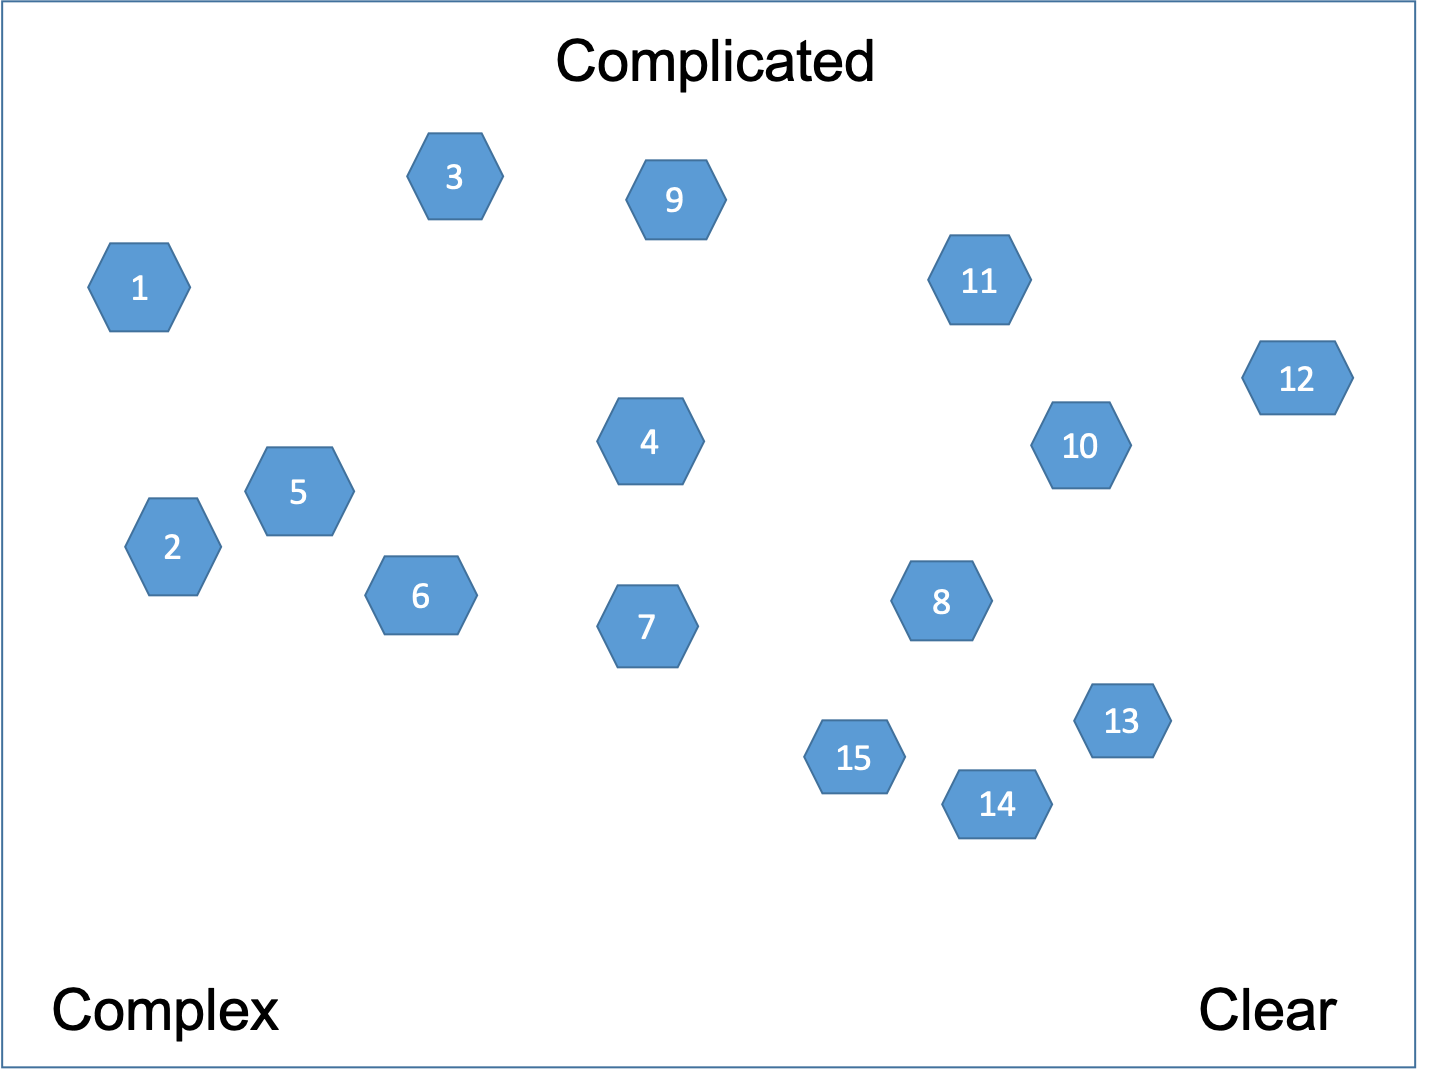
Here the case may be that we are not able to tell if we have the capability to deliver a user story simply because the user story itself is not clear enough from a Client perspective. This makes it complex from a Capability perspective as well. As a general heuristic we need to be conservative and pessimistic. That means if a user story is between Clear and Complicated then we put it in the Complicated corner.
After the initial placement - we are never allowed to move a card by itself, but only by breaking it down into cards and moving the new cards.
Then we draw the boundaries as shown on Figure 5.
Then we break down the user stories in the central Confused state, which are too big as shown on Figure 6.
Eventually, as shown on Figure 7, a Cynefin framework is created anew for each of the Capability and Client contexts.
Categorization
Both Client and Capability get together to create the complete Cynefin framework for the project from the two contextualized Cynefin instances. We will use the complete Cynefin framework for categorisation in the unique context of the project. The goal is to combine the two perspectives into one that we can use operationally.
The complete Cynefin framework will be contextualized to the environment and operations of our project. It will provide a new shared language with which both Client and Capability can discuss situations, perspectives and possible actions. It can be used to talk about interpretations of current conditions based on gathered data, to evaluate strategic interventions, and to constructively manage conflict and bring about consensus, without removing conflict [2].
We will make use of the Ashby Space, which is a conceptual framework inspired by W. Ross Ashby’s Law of Requisite Variety, developed to understand complex adaptive systems, particularly in the context of organizational knowledge and strategic decision-making[6]. It visualizes how variety in the environment and variety in the system’s internal capabilities (i.e., knowledge, strategies, structures) interact. Each point in this space represents a configuration of a system relative to its environment. In particular, we will apply a conceptual alternative where the Ashby Space is drawn with both axes reversed, running from High to Low. We do that because it:
- Fits the Cynefin where fragility or collapse visually trend toward the bottom-right.
- Matches risk matrices that grow more dangerous towards the bottom-right.
- Visually intuitive if you're analyzing organizational vulnerability or failure modes.
Here is how we do that. First we create a space with horizontal and vertical axes as presented on Figure 8. On the horizontal axis we have the level of perplexity from Capability perspective. On the vertical axis we have the level of perplexity from the Client perspective. The level of perplexity maps to the three Cynefin domains - Clear, Complicated and Complex. The Chaos domain is also present on the diagram. It is the point 0, where both Capability and Client feel maximum perplexity (no constraints).

In order to make the diagram tidy we will put “O” for Clear, “A” for Complicated and “C” for Complex. The result is presented on Figure 9. "O" stands for Obvious, which is like Clear. "A" stands for Analysis, which is what Complicated user stories need to become Clear. .

We match the user stories from each Cynefin instance indexed by their complexity profile. We do so by taking each of the user stories and placing them in the respective cell from the complexity profile.
The rules are as follows:
- If a user story is part of a Complex domain either from client or from capability perspective, it is considered Complex.
- If a user story is part of a Complicated domain either from client or from capability perspective, it is Complicated.
- Clear are only user stories which are Clear in both perspectives.
When estimating project complexity, the bits of missing information from both the Client and Capability perspectives represent separate dimensions of knowledge that need to be acquired during the project. Therefore, they should be added together to get the total bits of missing information for the project.
Here a question is usually raised: why we need the CP, why don't we just place the user stories in a table as below:
| User Story | Capability Context | Client Context | Complexity profile | Place |
|---|---|---|---|---|
|
#1 |
Complex | Clear | Complex | CO |
|
… |
… | … | … | … |
|
#5 |
Complex | Complicated | Complex | CA |
|
… |
… | … | … | … |
|
#14 |
Clear | Clear | Clear | OO |
|
#15 |
Clear | Complicated | Complicated | CA |
We don't use only the table above because we want to show the movement inside the complexity profile. That means to make complex things complicated and the complicated things clear.
Instead we use the Complexity Profile (CP) as presented on the figure below.
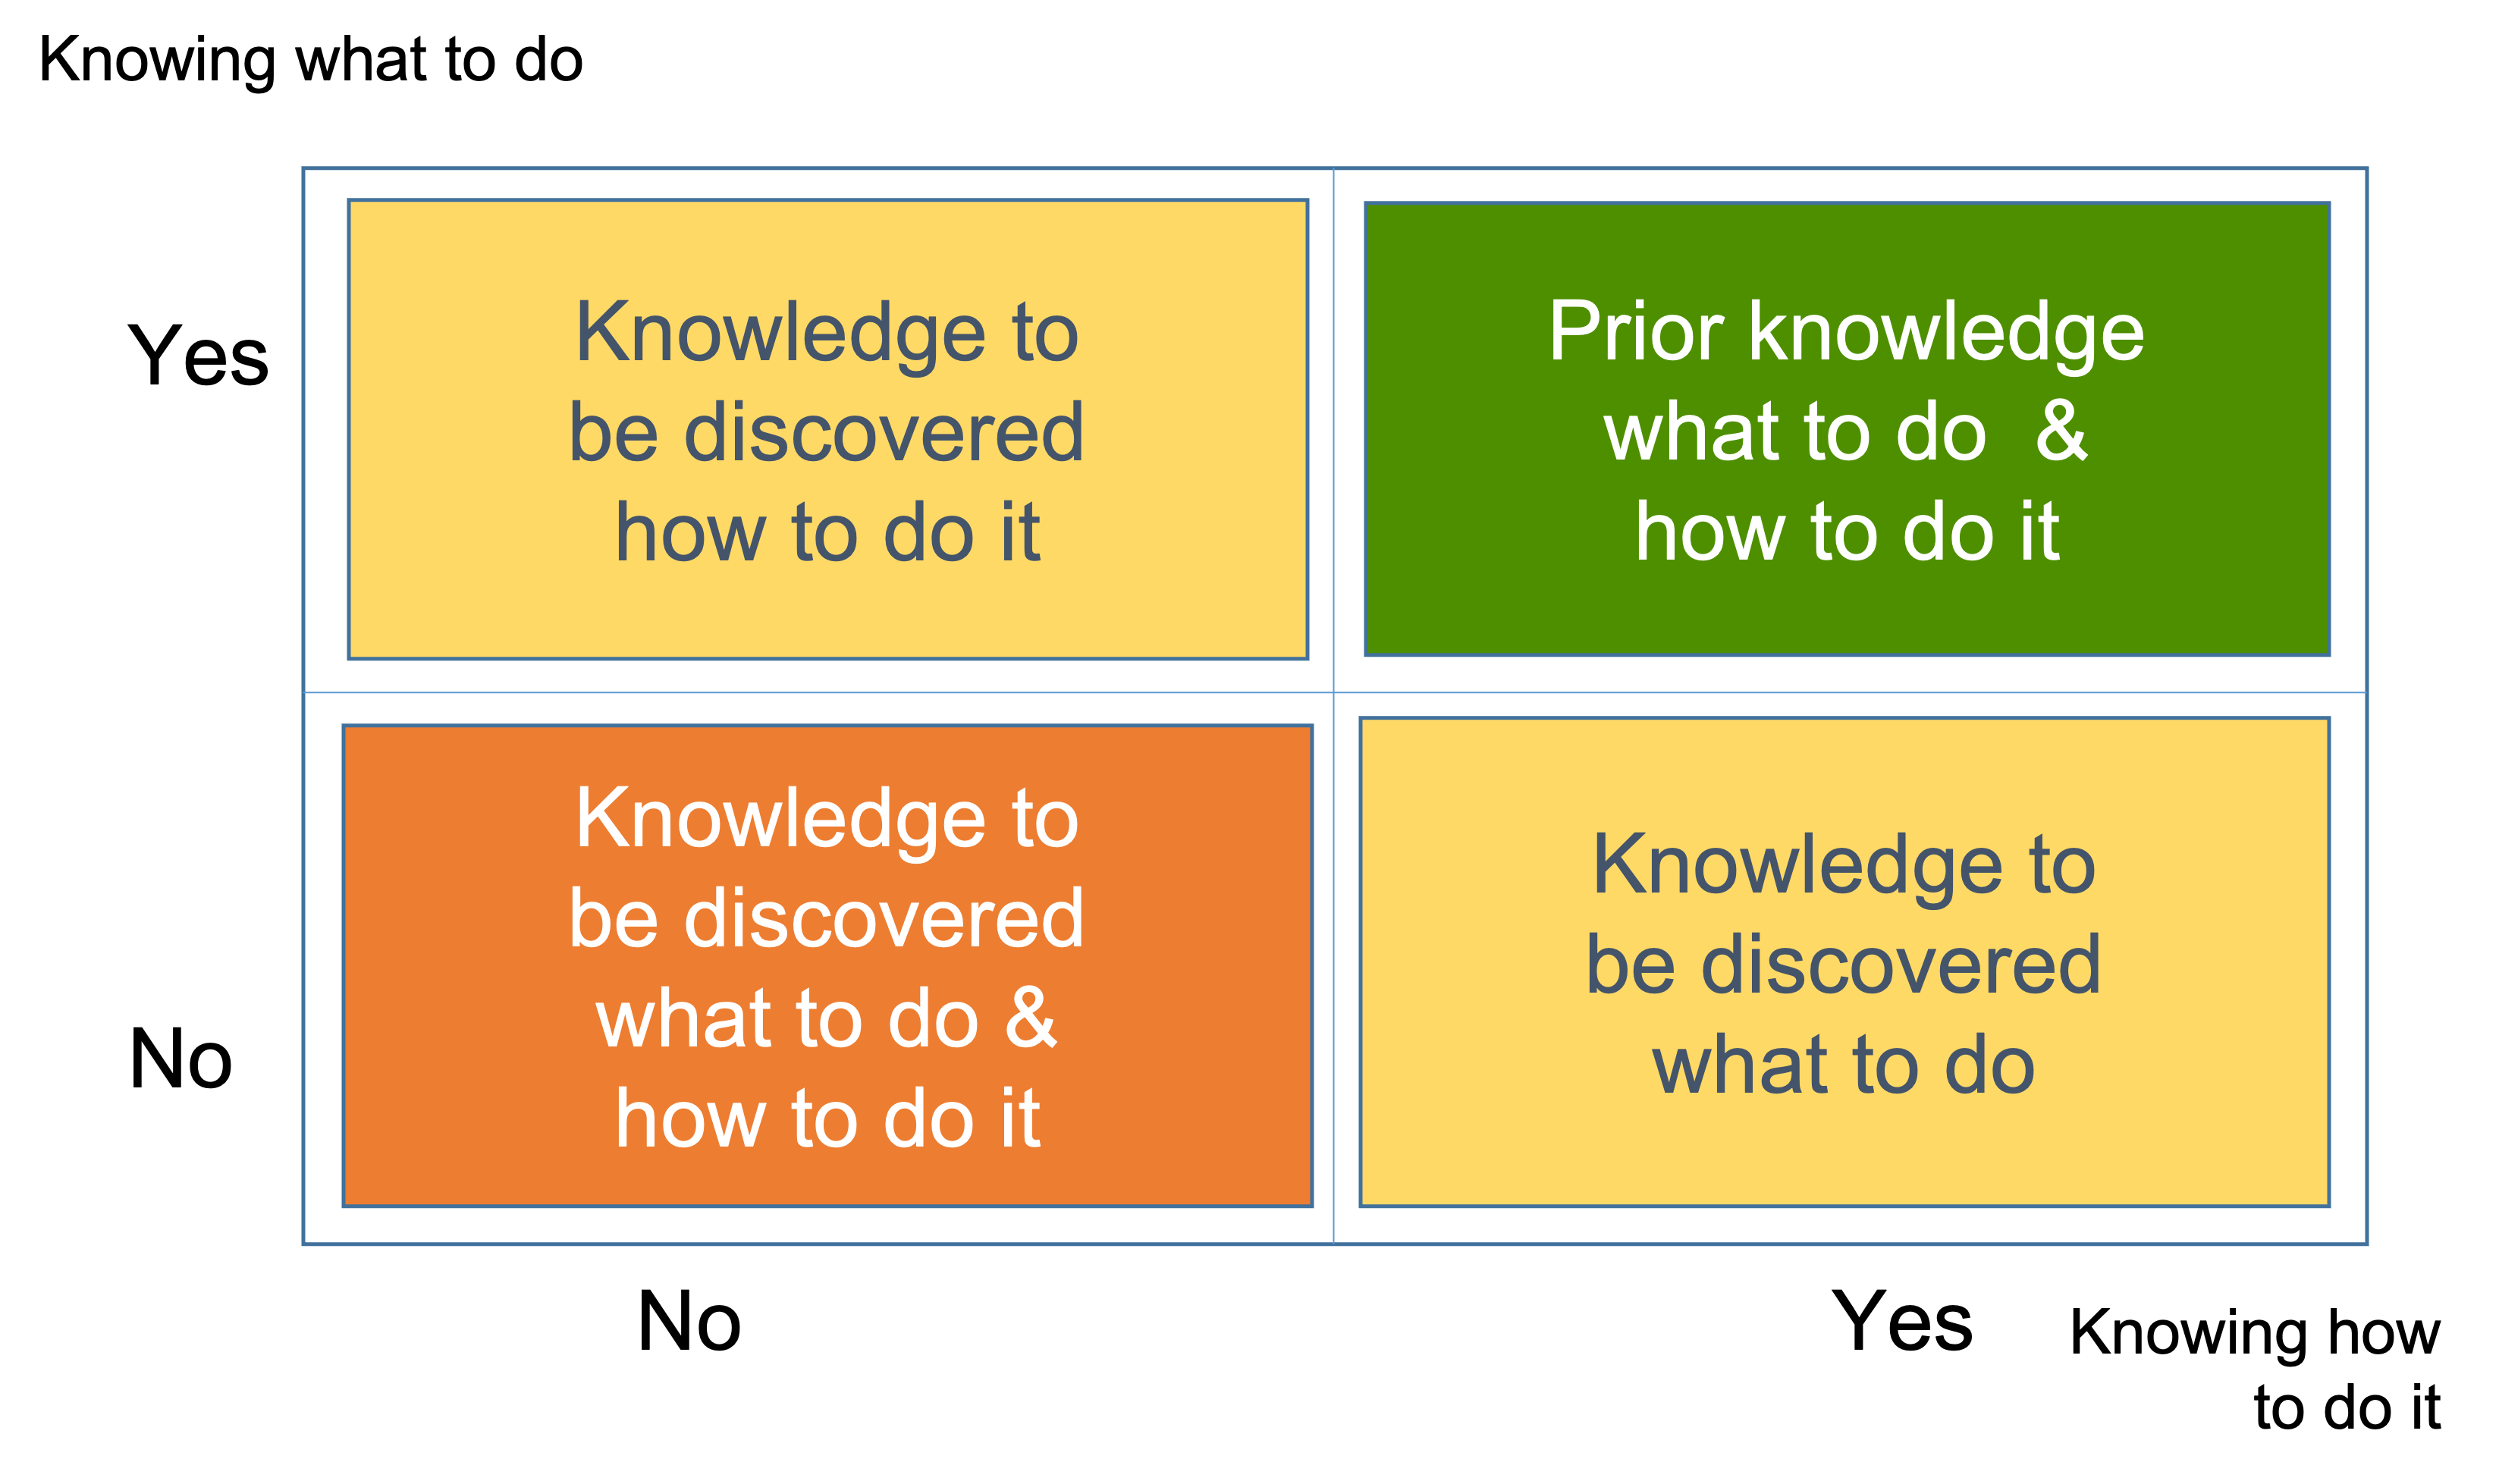
We need to split the yellow and orange boxes based on the number of alternatives. That will make the number of boxes nine instead of four and give us the operational Complexity Profile (CP) of our project as presented on Figure 11. It represents the perplexity of both Capability and Client about the user stories.
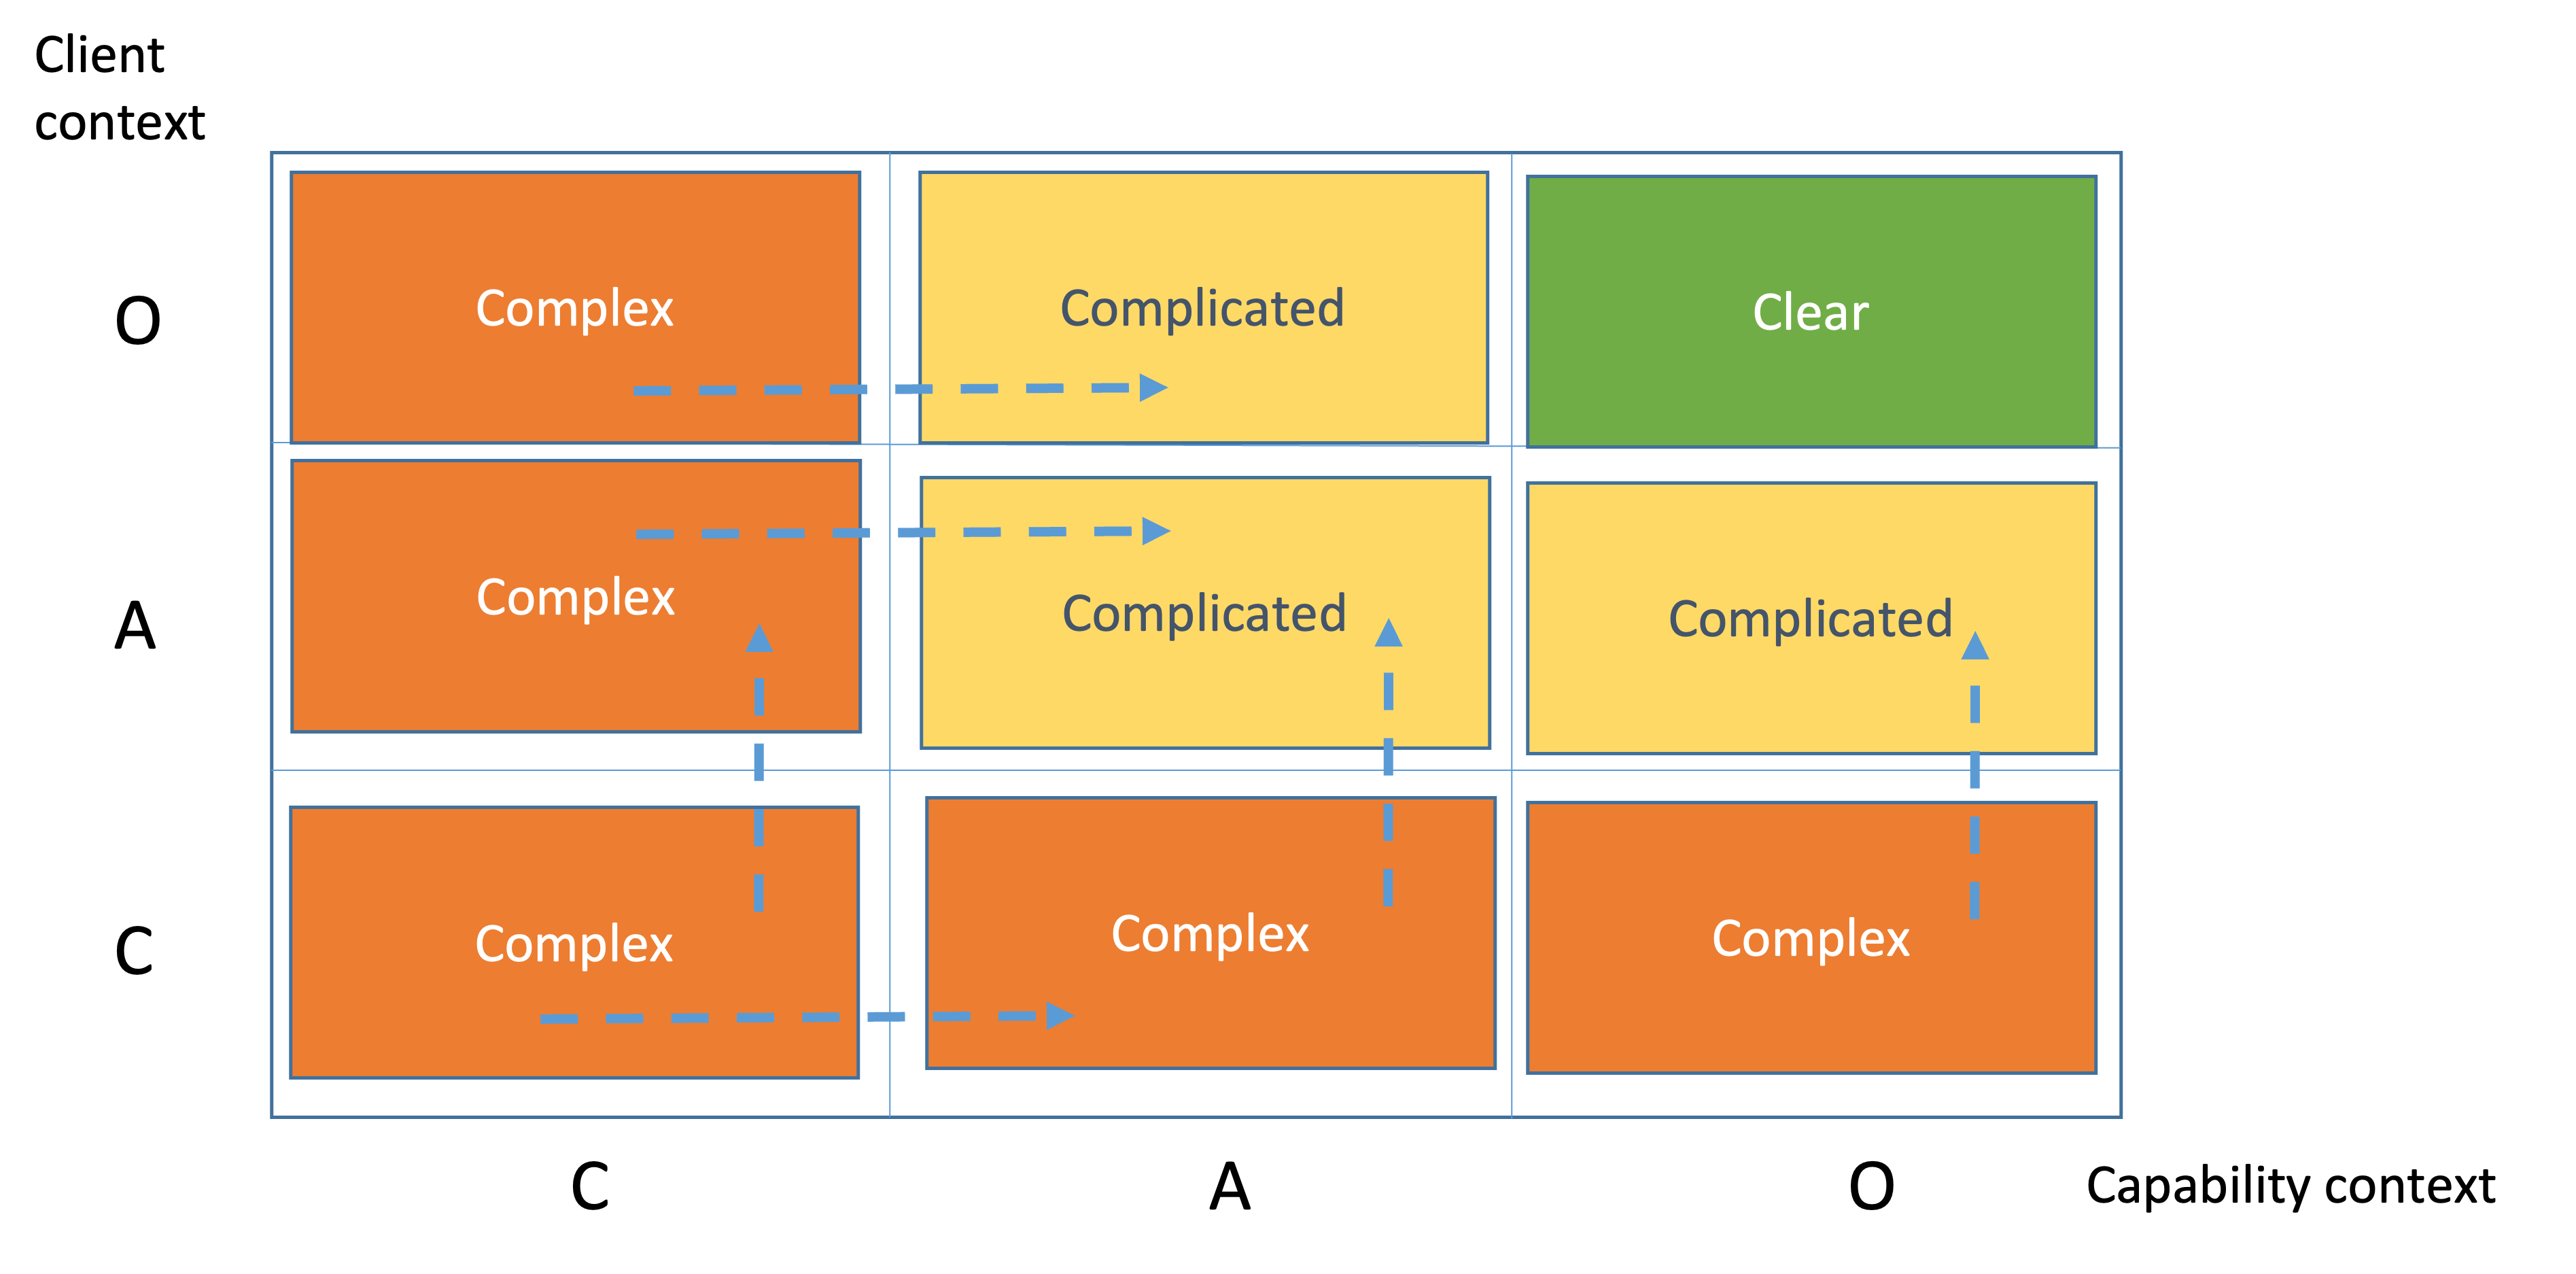
An operational complexity profile is a maneuverable space. Each movement is a clarification. Clarification is a knowledge discovery process. All possible movements between domains are presented here.
Continuous understanding project complexity
In an Agile project management approach, the steps to understand and manage complexity need to be executed iteratively because Agile emphasizes flexibility, adaptability, and continuous improvement. Agile projects are characterized by incremental development, iterative planning, and frequent reassessments of project requirements and goals. This dynamic environment necessitates the regular evaluation and adjustment of project complexity factors. Here's how the steps can be adapted for iterative execution in Agile project management:
-
Iterative gathering of client-owned factors:
- Continuously refine and update requirements, scope, and objectives as the project progresses and new insights are gained from client feedback and evolving needs.
- Maintain open and frequent communication with the client to ensure alignment and adapt to any changes in their size, industry, communication style, or decision-making process.
-
Iterative assessment of capability-owned factors:
- Review and adjust team structure as needed throughout the project, considering factors like role changes, skill development, or resource allocation adjustments.
- Assess and improve technology and domain expertise by providing training, sharing knowledge, and learning from experience gained during the project.
- Adapt the development process as necessary based on project feedback, lessons learned, and evolving requirements.
- Continuously evaluate and improve code base expertise, learning from project experiences and addressing any challenges or technical debt that arises.
- Iterative analysis of interdependencies: Regularly review the relationships between the factors and their potential impact on the project's complexity, and adjust plans accordingly.
- Iterative understanding of complexity: Continuously reassess the project's complexity based on updated information and analysis, and make adjustments as needed.
- Iterative adjustment and planning: Incorporate feedback and learning from each iteration into the project plan, adjusting resources, goals, and strategies to better manage complexity and ensure project success.
Appendix
Considering the combination of possibilities
When estimating project complexity, the bits of missing information from both the Client and Capability perspectives represent separate dimensions of knowledge that need to be acquired during the project. Therefore, they should be added together to get the total bits of missing information for the project.
In the context of information theory, "bits" are a measure of uncertainty or missing knowledge. If there are 3 bits of missing knowledge from the Client perspective and 3 bits from the Capability perspective, this would mean there's a total of 6 bits of missing knowledge for the project. This is because each bit represents a separate piece of knowledge that needs to be discovered, and these pieces of knowledge are additive.
Here is a more detailed explanatio why we need to add the missing information. When we're considering the combination of possibilities from two independent random variables, the total number of possibilities indeed multiplies, not adds. This is a fundamental principle in probability theory.
Suppose we represent the Client and Capability as two random variables, X and Y respectively. If X has 8 possible states and Y also has 8 possible states, we need to consider the total combinations of X and Y. Assuming X and Y are independent, each state of X can occur with each state of Y, leading to 8*8=64 possible combined states.
Now, when we convert these possible states into bits (assuming a uniform distribution), we use the formula for entropy (which in the case of a uniform distribution simplifies to the logarithm base 2 of the number of states). So, for X or Y alone, log2(8) = 3 bits. But for the combined system of X and Y, log2(64) = 6 bits.
Therefore, while estimating the complexity, the total bits of information in the combined system is the sum of the bits of information in the individual systems. This is because the number of possible states multiplies, reflecting the increased complexity when considering the two systems together. This approach is grounded in probability theory and provides a more accurate understanding of the project's complexity.
It's important to note that this sum provides an overall measure of project complexity, but it does not give information about where the complexity is coming from. For that, we would need to look at the individual contributions from the Client and Capability perspectives.
Works Cited
1. Armour, P.G. (2003). The Laws of Software Process, Auerbach
2. Bakardzhiev, D. (2016). Adaptable or Predictable? Strive for Both - Be Predictably Adaptable! InfoQ. https://www.infoq.com/articles/predictably-adaptable/
3. D. Snowden (2019), Cynefin & perception, https://thecynefin.co/cynefin-perception/
4. Kant, S.-L. (2014). The Distinction and Relationship between Ontology and Epistemology: Does It Matter?. Politikon: The IAPSS Journal of Political Science, 24, 68-85. https://doi.org/10.22151/politikon.24.4
5. Kurtz, C. F., & Snowden, D. J. (2003). The new dynamics of strategy: Sense-making in a complex and complicated world. IBM SYSTEMS JOURNAL, 42(3), 22.
6. Boisot, M. and McKelvey, B. (2011). “Ashby’s Law of Requisite Variety: A Complexity Perspective.” In P. Allen, S. Maguire, and B. McKelvey (eds), Handbook of Complexity and Management, London: Sage, 279–98.
How to cite:
Bakardzhiev D.V. (2023) Understanding a Project's Complexity. https://docs.kedehub.io/kede-manage/kede-understand-a-projects-complexity.html.html
Getting started


