Solana Capability Analysis
Using the scientifically backed and patented metric - Knowledge Discovery Efficiency (KEDE)
Motivation
The dominant companies of the day grow mostly using not physical but intangible assets, such as intellectual property, brand equity and human capital. Investors face difficulties at incorporating intangible assets into their analysis of companies' value. Measuring human capital utilization can help investors value this intangible asset, which plays an increasingly crucial role in the modern economy.
At the same time the global availability of talent is decreasing and its cost is increasing constantly. That puts companies under pressure to deliver ever more with their current levels of human capital. However the human capital is useless if not utilized. Efficiency is the order of the day and of tomorrow. Having a benchmark about what efficient use of human capabilities is will help executives compare with the other companies globally.
As explained here software developers apply knowledge in order to deliver outcomes. If they don't have the knowledge needed they have to discover it. Prior knowledge is the easiest and the fastest to discover - it is in the head, one just applies it. In other words, when prior knowledge is applied then there is the most efficient knowledge discovery. The more prior knowledge was applied for achieving the desired outcome the more capable a software development process is.
KEDEHub allows us to measure the development capability of a company using the scientifically backed and patented metric - Knowledge Discovery Efficiency (KEDE).
The company we will look into is Solana [1], which is the first Web-Scale Blockchain protocol and represents a true innovation. With its publicly available historical data, from the white paper to the present day, Solana serves as an excellent case study for evaluating the efficiency of innovative software development organizations.
The purpose of this report is twofold:
- To set a benchmark for the efficiency of innovative software development organizations. This benchmark will serve as a minimum standard for all other companies that develop software. Unless they match the level of innovation demonstrated by Solana, they should aim to be several times more efficient.
- To demonstrate how the utilization of human capital, a valuable but intangible resource, can be measured and compared to revenue numbers.
Solana is a layer-one blockchain network that can implement smart contracts. It is billed as the solution to the scaling issues of Bitcoin and Ethereum. Solana is the fastest blockchain in the world and the fastest growing ecosystem in crypto, with over 400 projects spanning DeFi, NFTs, Web3 and more. Two years after its founding in July 2019, Solana was able to land $20 million in a Series A funding round led by Multicoin Capital. On June 9, 2021 Solana announced it has raised over $314 million of new funding in a private token sale led by Andreessen Horowitz and Polychain Capital, to be used to further its technology in the decentralized finance (DeFi) arena.
By examining Solana's performance, we can gain insight into the key factors that contribute to the success of innovative software development organizations.
Data Analysis and Primary Findings
This analysis starts with the Overall capability where are the main results and findings. Then we continue with the detailed findings per time period as follows:
- Start through Version 0 The interesting bits for this period are the prototype Loom of what was to become Solana and the work on the white paper.
- From V0 to V0.6 (Multinode testnet)
- From V0.6 to v0.13 (Grandview). The interesting bist here is the comparison of the two most active projects between them and with the rest.
- From v0.13 to Solana 1.0
- From V1.0 to V1.6
- From V1.6 to Mainnet - v1.9.24
The important details and the methodology are presented in Appendix A. At the end we conclude with a few words of caution.
Overall capability
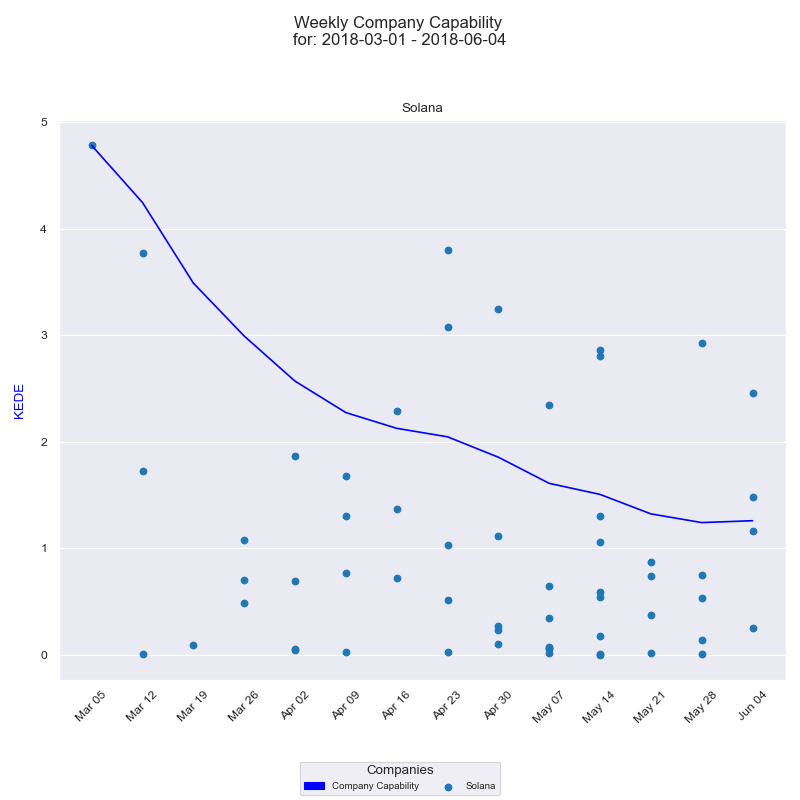
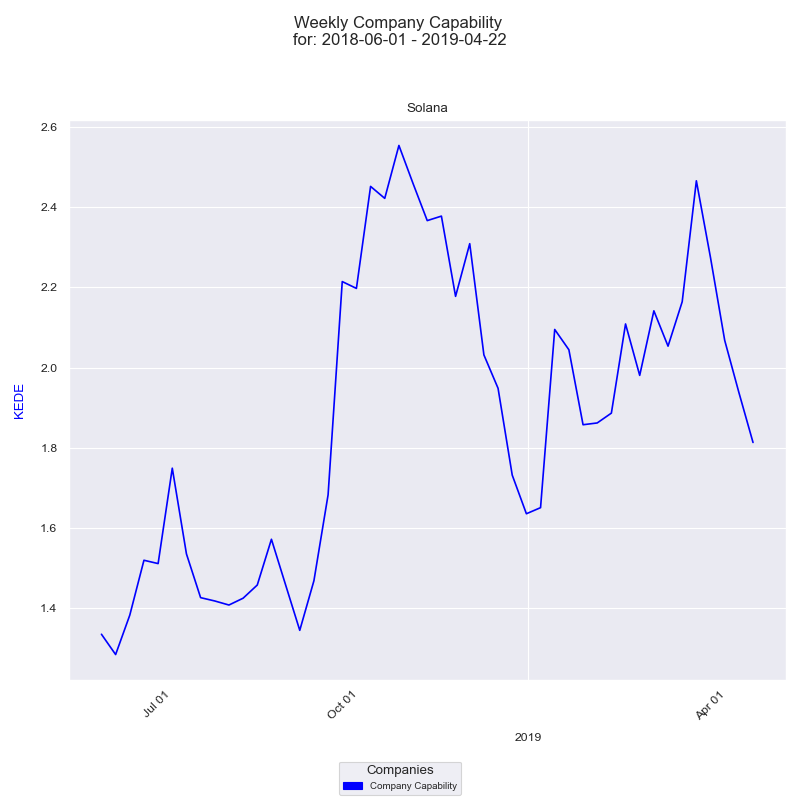
Solana started on October 30th, 2017 when Anatoly Yakovenko [11] started the work on what was to become Solana[3]. and ends in May 2022 when Solana has a Market Cap of $13.2B. Below is a time-series diagram of Solana development capability for the whole life of the company.
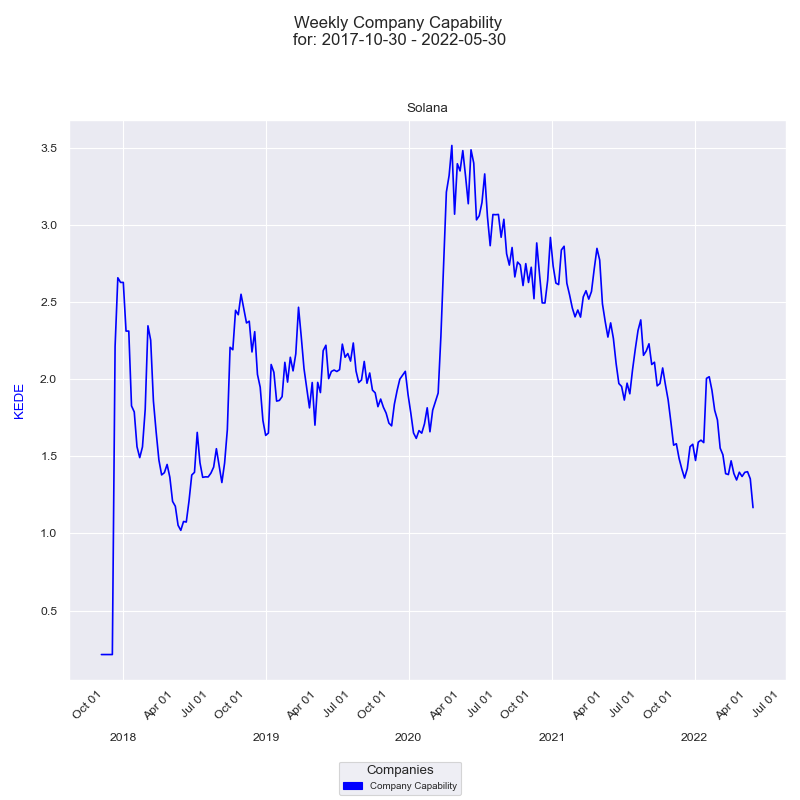
On the diagram above we have presented Knowledge Discovery Efficiency (KEDE) for each of the developers who contributed to Solana. On the x-axis we have the quarter dates. On the y-axis we have Weekly KEDE values. The dark blue line is the average weekly KEDE for all developers calculated by EWMA.
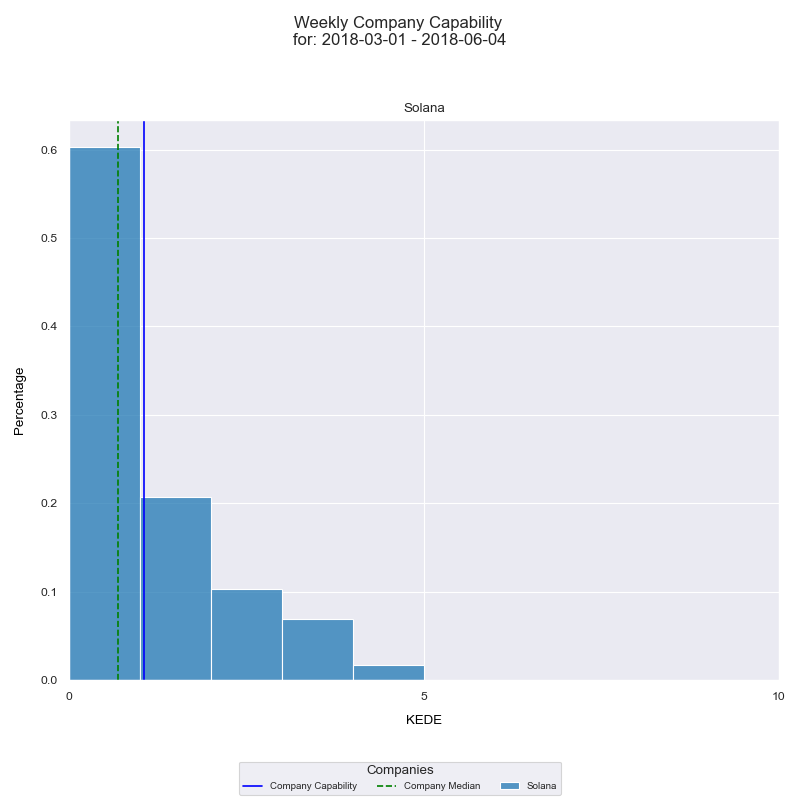
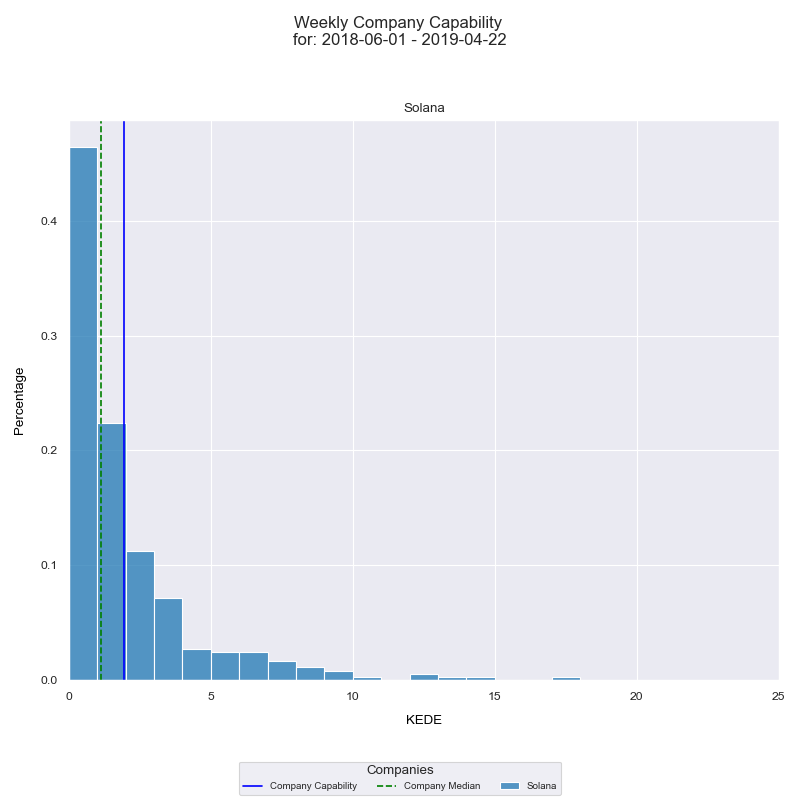
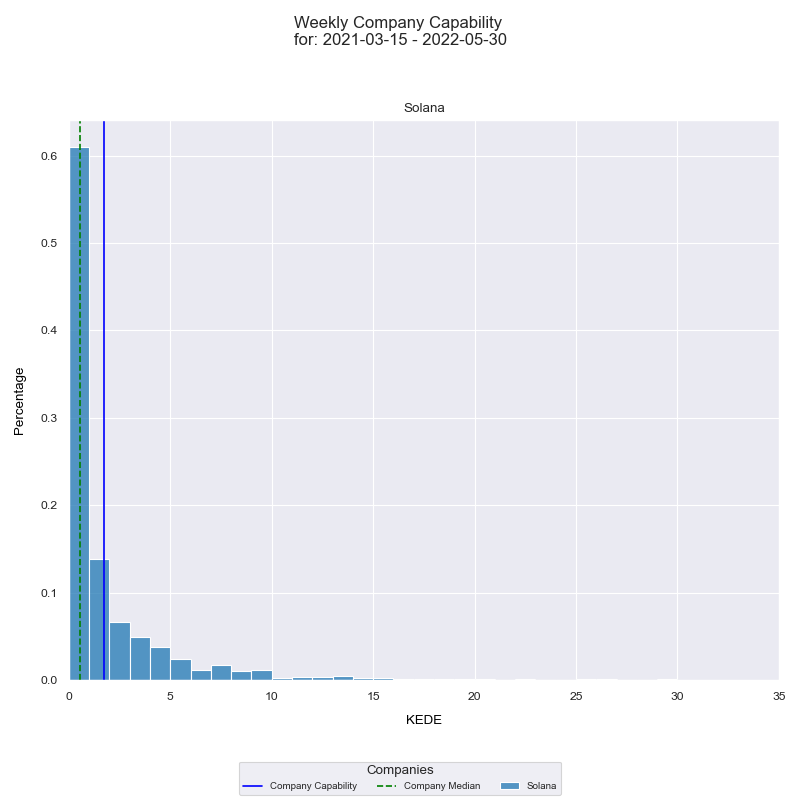
Along with the time series of Solana capability it's very useful to see a histogram.of the underlying frequency distribution. A frequency distribution shows how often each different value in a set of data occurs. The diagram below presents a histogram of aggregated Weekly KEDE values for the whole life of Solana.
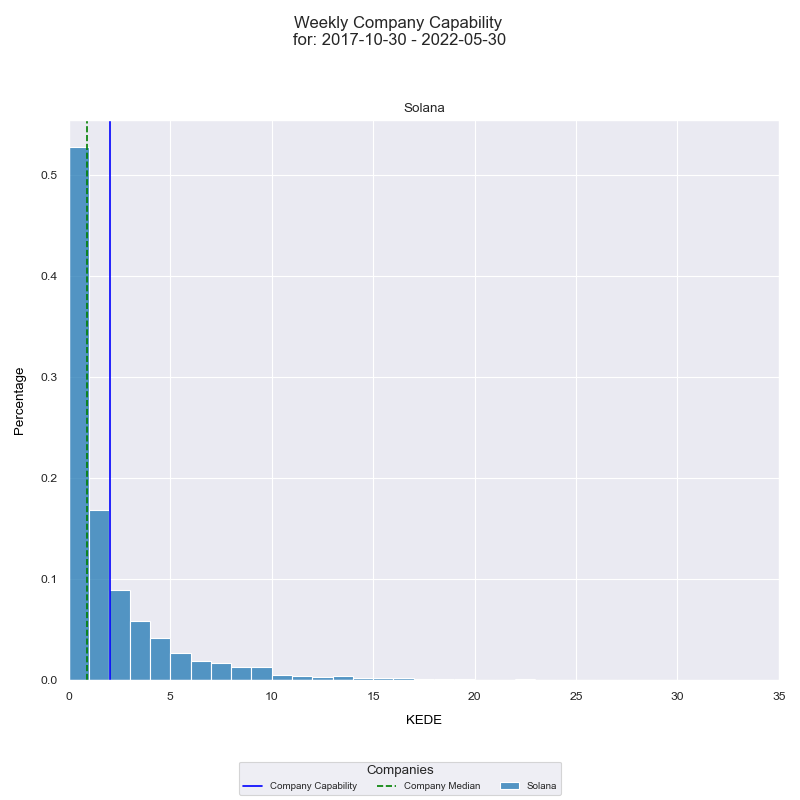
On the x-axis we have the Weekly KEDE. On the y-axis we have the percentage of each particular value. The blue vertical line is the average weekly KEDE for all Solana developers for the selected period. The average values are calculated by arithmetic mean. The median Weekly KEDE for the selected period is presented by the green vertical dashed line.
We also take a look at the impact company size has had on the efficient utilization of its human capital. Below is a time series diagram of the impact company size has had on the development capability for the whole history of Solana.
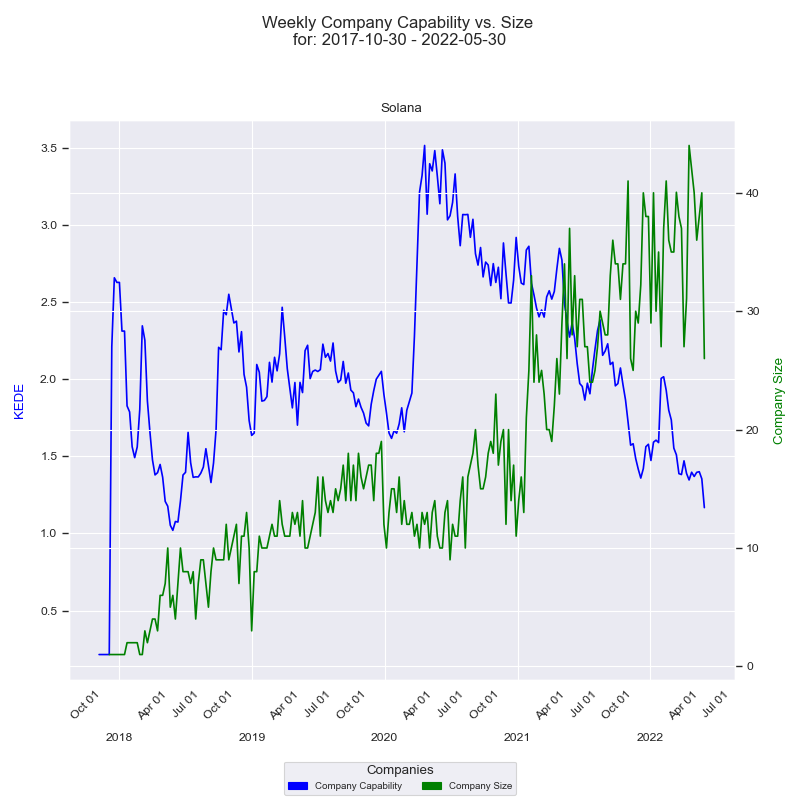
On the x-axis we have the quarter dates. Then we have two y-axises - one for the capability and one for the size of the company. Capability axis is to the left and is in Weekly KEDE values. How capability changes through time is presented by the dark blue line calculated using EWMA. Each point of the blue line is the average Weekly KEDE for all the developers who contributed in that week. Company size axis is to the right and is the number of developers who contributed to any of Solana projects in a given week. How company size changed through time is presented by the green line. Each point of the green line is the number of developers who contributed in a given week. How the diagram is constructed is explained here. For the full details on what impact company size has had on the development capability for the whole history of Solana look here.
Discussion
As explained here KEDE has values between 0 and 100. As such KEDE of 2 is not spectacular. However it properly reflects the true innovative nature of the product Solana is developing: That means Solana developers needed to discover a ton of new knowledge in many domains. The main knowledge gaps as we understood are:
- Solana is developed on Rust. Rust is not the most popular programming language. Most probably the majority of the team members were just like Anatoly - learning Rust by using it.
-
Solana has 8 key innovations that are way different and look very promising as compared to other blockchains[13].
- Proof of History (POH)— a clock before consensus;
- Tower BFT — a PoH-optimized version of PBFT;
- Turbine — a block propagation protocol;
- Gulf Stream — Mempool-less transaction forwarding protocol;
- Sealevel — Parallel smart contracts run-time;
- Pipelining — a Transaction Processing Unit for validation optimization
- Cloudbreak — Horizontally-Scaled Accounts Database; and
- Archivers — Distributed ledger storage
As visible on the time-series Weekly KEDE fluctuates through the period of four and a half years. Up to the first quarter of 2020 capability was more or less stable. After that we see a peak and after that a continuous and steady decline. That means the internal organization at Solana was somewhat stable up to a point and collapsed afterwards. When we compare capability with the company size it is obvious that the constant increase in headcount has been having a negative effect.
One would expect that a core team working with the same technology solving the same problems would gain new knowledge and skills through time. That would have manifested itself in increasing KEDE. It looks like the Solana team needs to look at improving the way knowledge is acquired and shared. Ideas on how to improve the capability of their human capital are presented here.
Start through Version 0
Solana was conceived on Oct 30th, 2017 when Anatoly Yakovenko [11] started the white paper on what was to become Solana[3]. In the white paper Anatoly solved the problem of getting computers that don't trust each other to agree on time. Anatoly's development began in a private codebase "loom" and was implemented in the C programming language.
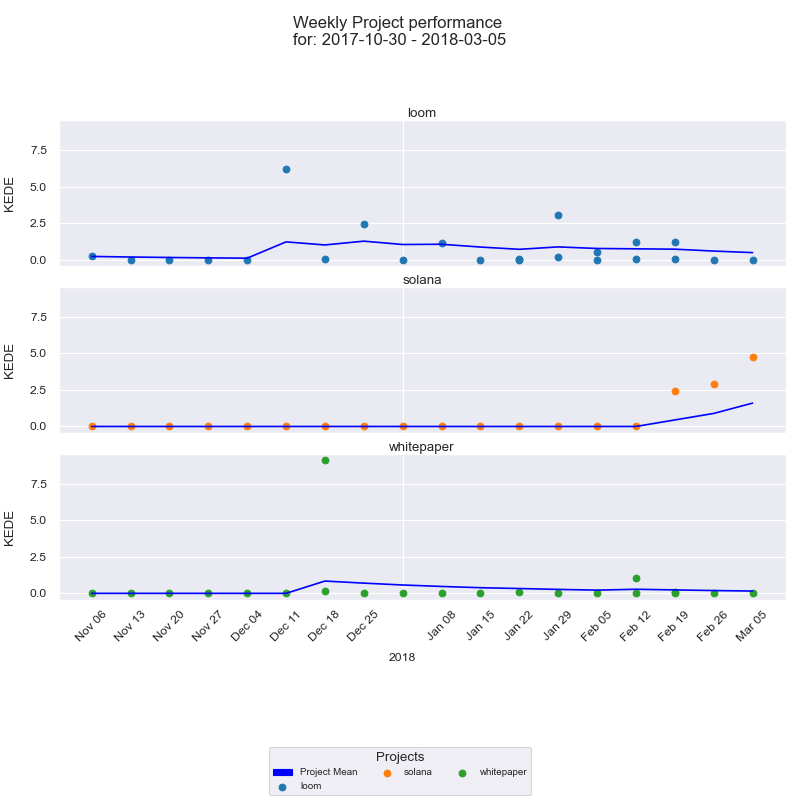
Below is the Weekly KEDE time-series diagram for Solana as a whole.
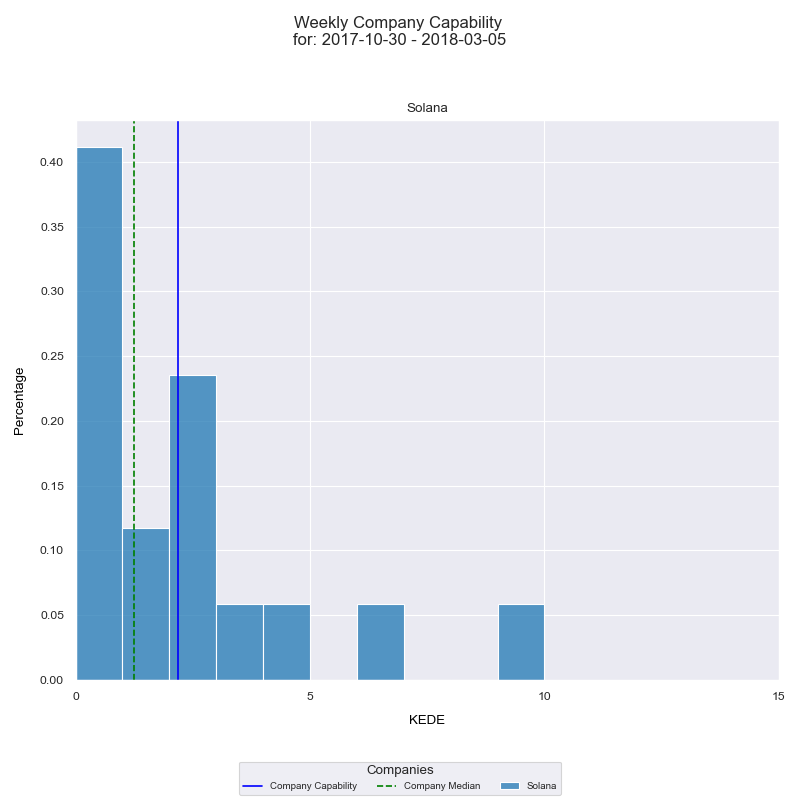
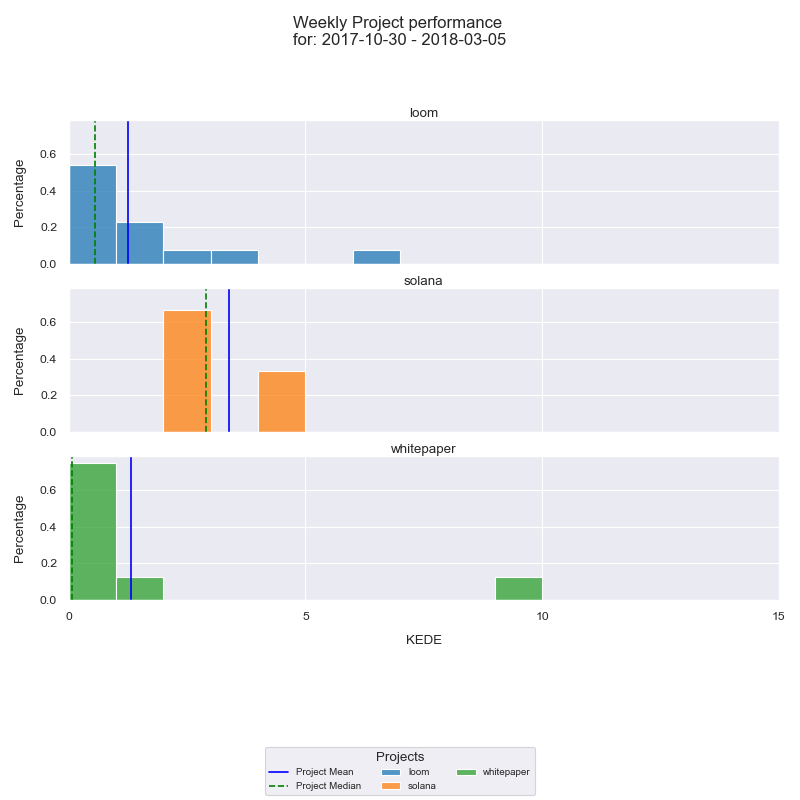
And the Weekly KEDE histogram for Solana as a whole.
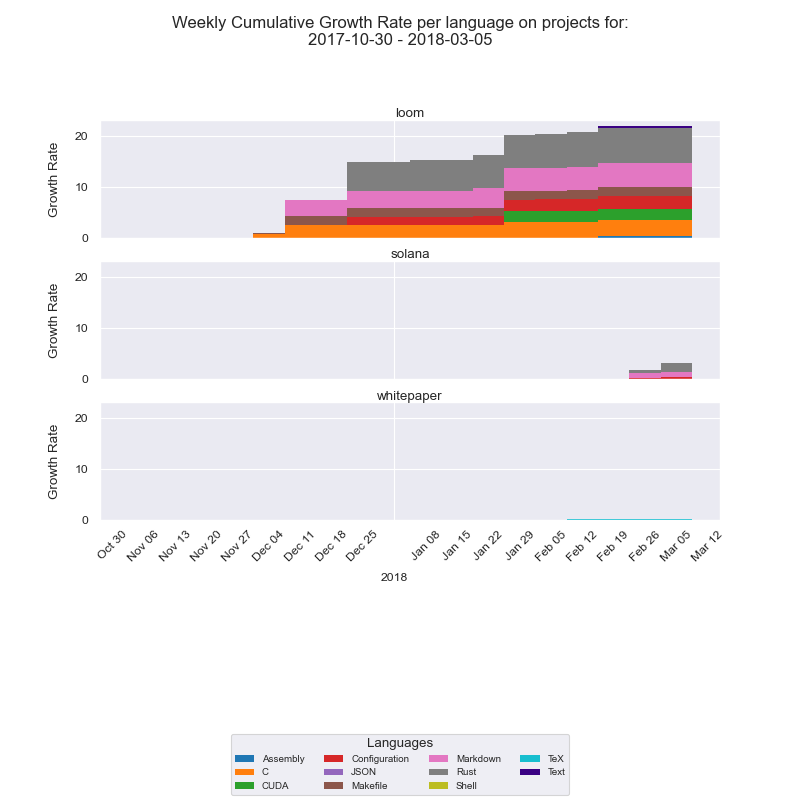
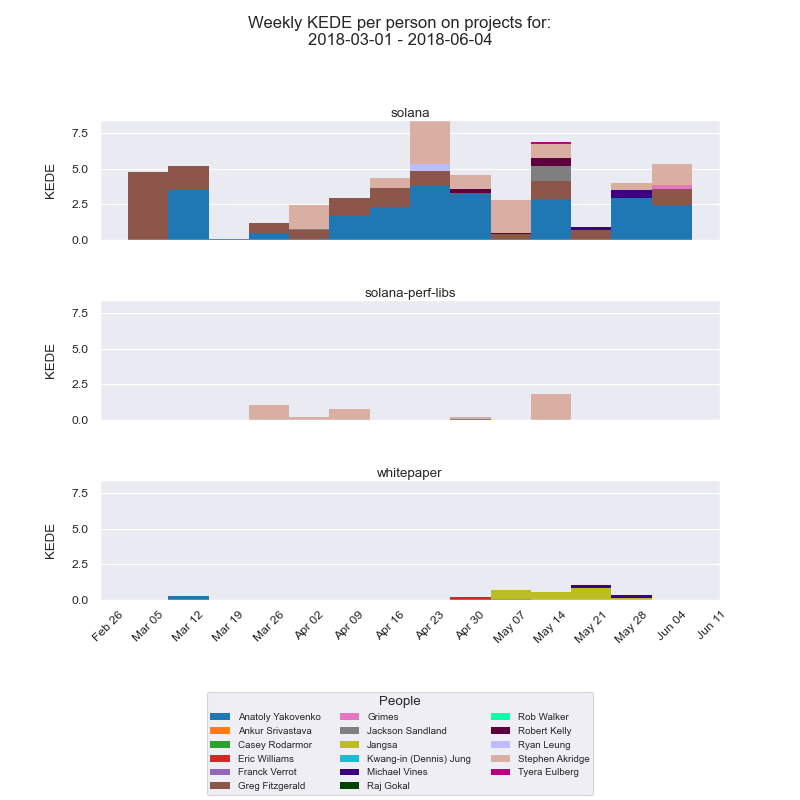
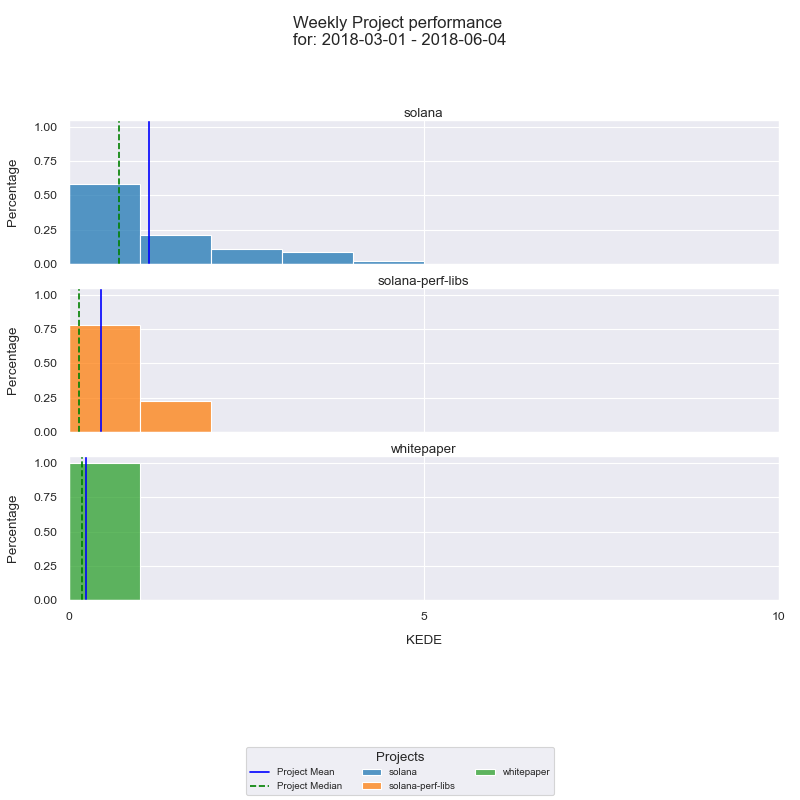
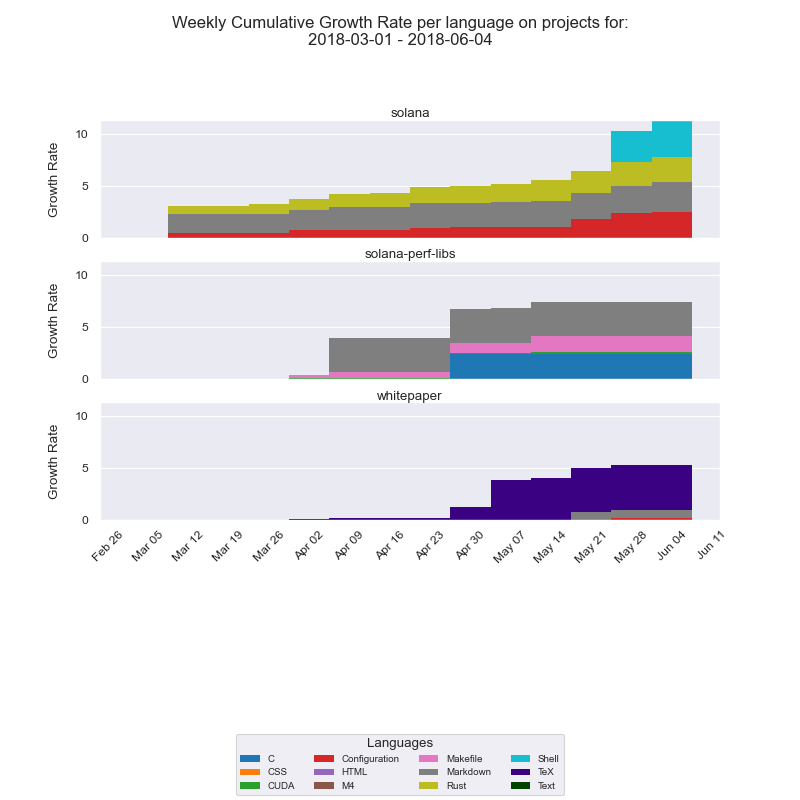
Below are the bar charts for all active projects from November 2017 through the release of Solana V0 (testnet).
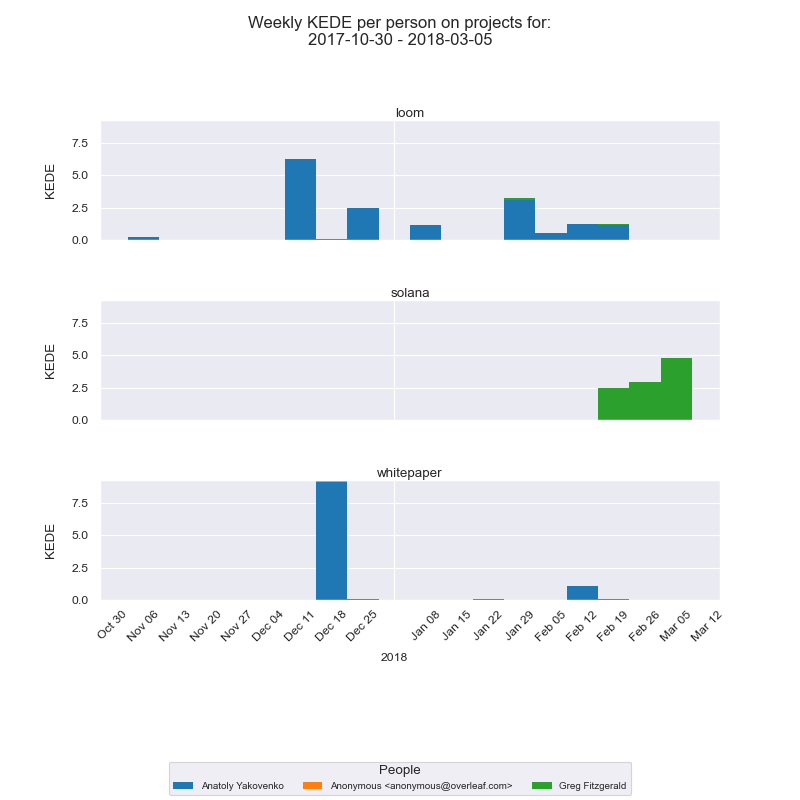
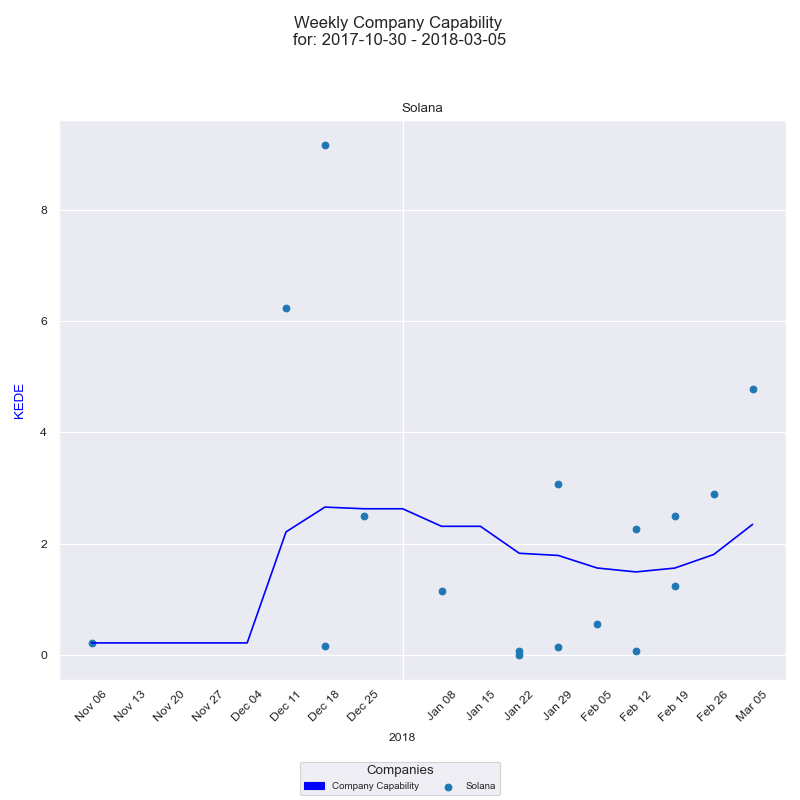
As visible on the diagram above there was no activity in the Loom project after the initial spike. Then in December 2017 Anatoly started producing code. That coincided with the first commit of his work on the whitepaper[10] describing Proof of History, a technique for keeping time between computers that do not trust one another [7]. In mid February 2018 the white paper was at version v0.8.8. In two weeks on March 1st Greg Fitzgerald[14] released Solana V0 (testnet).
The time-series is not very informative because of the huge gaps in inactivity for each of the three projects.
The histogram represents a Weekly KEDE between 1.5 and 2.5 for the three projects.
Language usage
Initially loom was developed in C language. Then Rust was added as the language of choice. A lot of configuration work was also done. And the documentation in TeX.
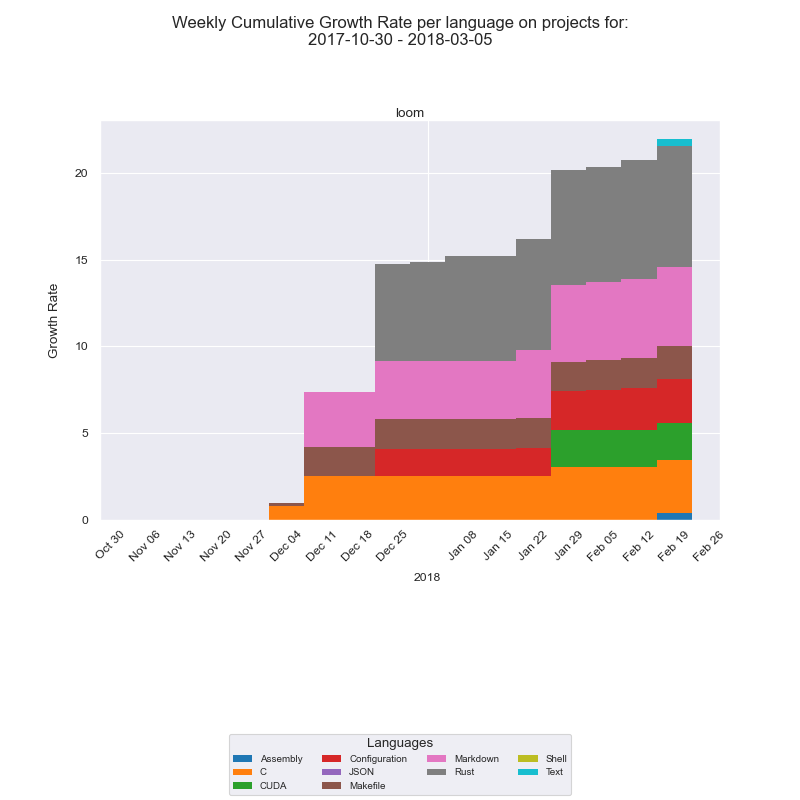
Loom
Below is the Weekly KEDE presented as a stacked bar chart for the 4 months period from 30 October 2017 until March 2018.
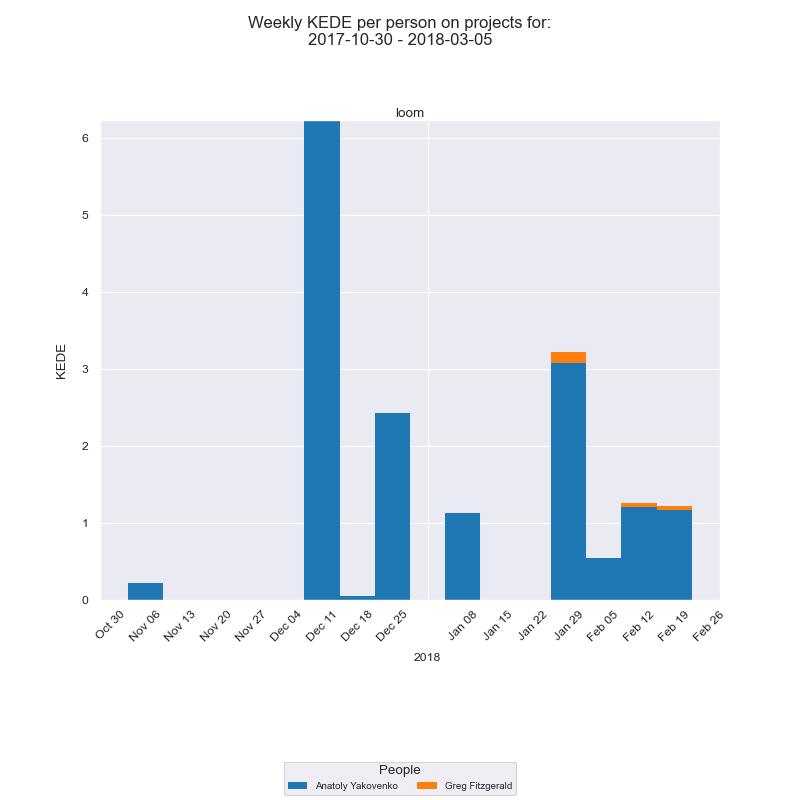
We can see two developers worked during the selected period and what was their relative contribution.
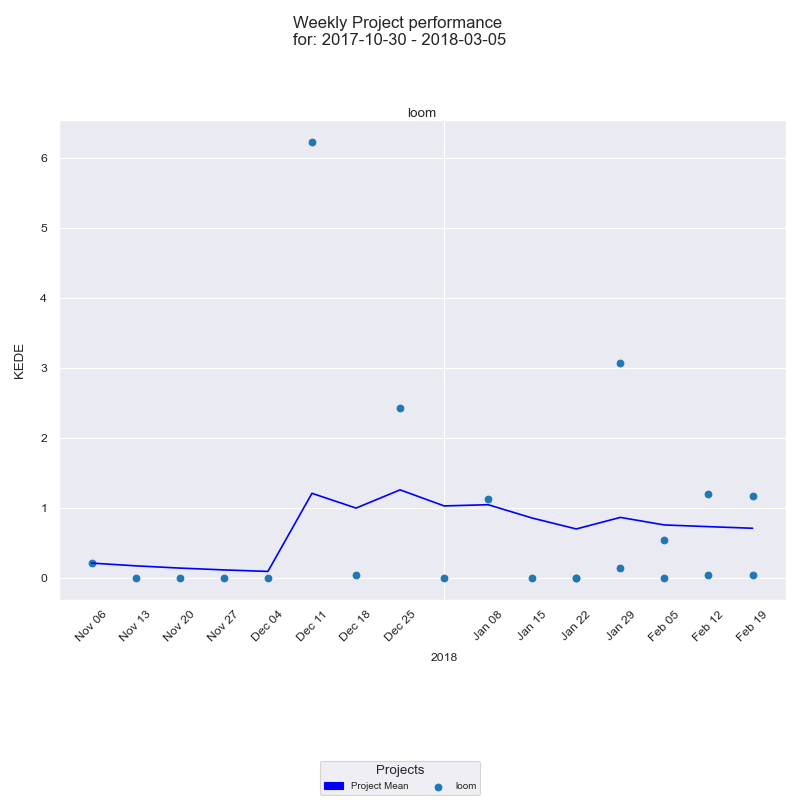
The time-series.
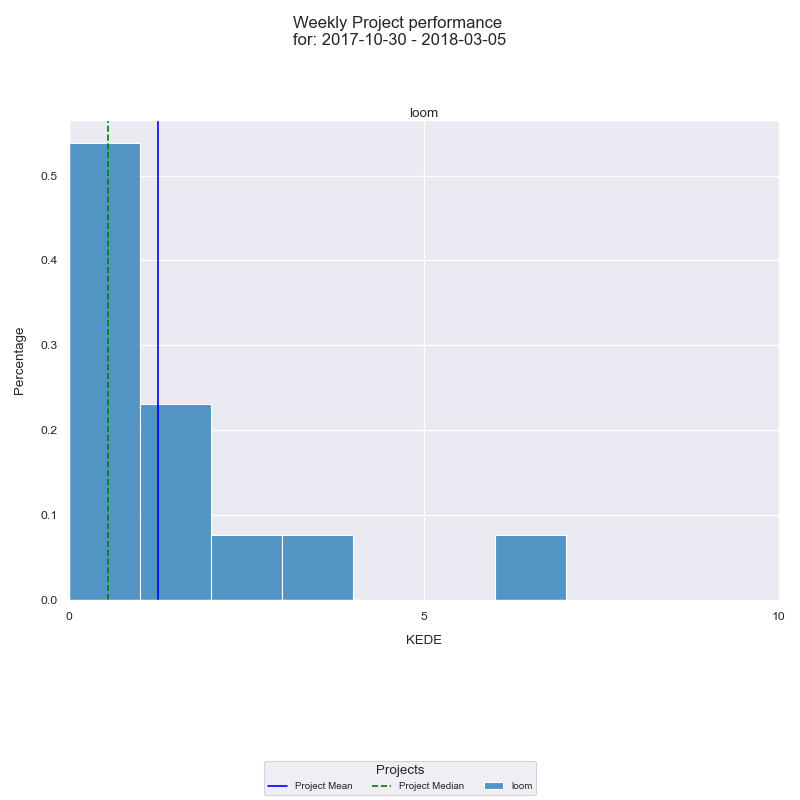
The histogram with Weekly KEDE of a bit more than 1.
Templates
Templates excluded from KEDE calculations are:
Language usage
Initially loom was developed in C language. Greg encouraged Anatoly to reimplement the project in the Rust programming language. Anatoly gave it a shot and just two weeks later, had migrated his entire codebase to Rust.
The white paper
As we see Anatoly worked on it in parallel with his work on "loom". First week of December 2017 is a peek in KEDE. This time though, that is not a case of a "template" copy&paste like with the Intel article. If we look at the committed text we can conclude that Anatoly worked through November 2017 and committed the result in one go.
Again, the initial peek in Weekly KEDE for Loom was due to a template usage. The initial peek for Whitepaper was not a template usage, but all the work Anatoly did in November 2017.
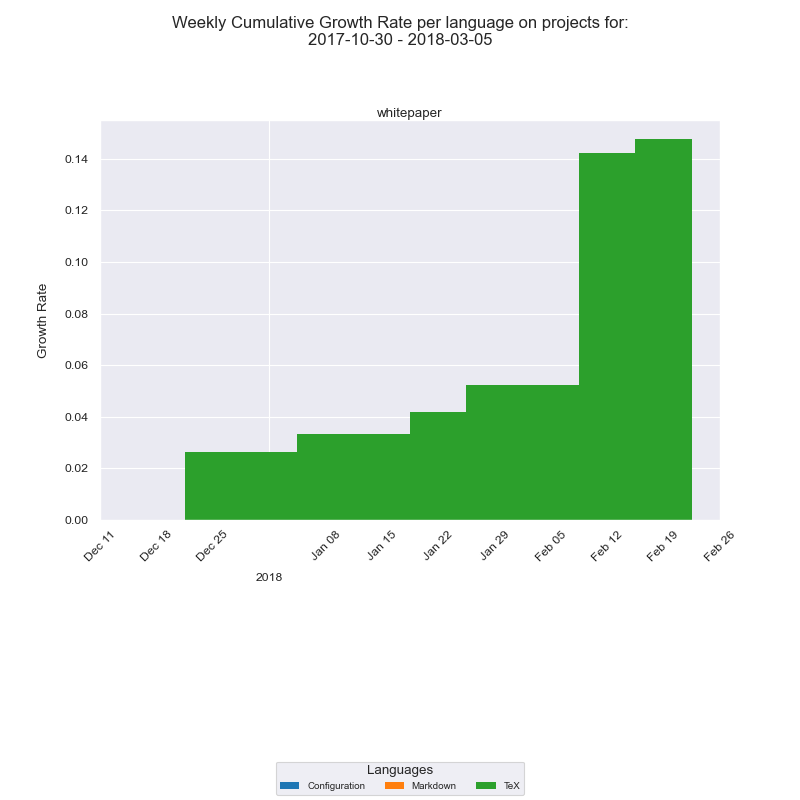
Below is the stacked-bar chart for the project "whitepaper".
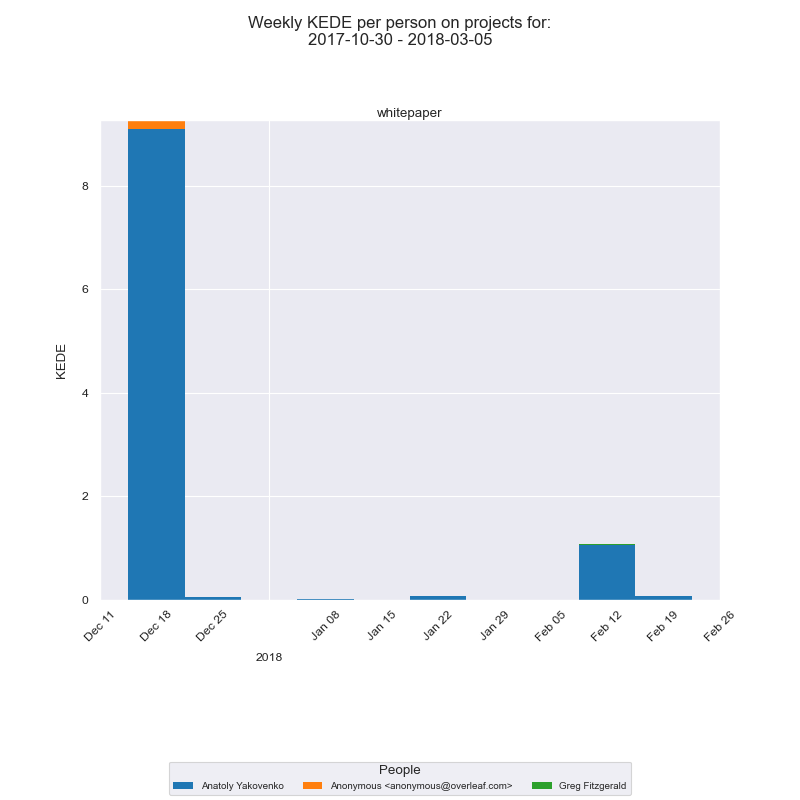
It is interesting to see the Weekly KEDE trend because the article was not C language code but TeX. Tex is actually text with some formatting.
The histogram shows a similar to "loom" Weekly KEDE.
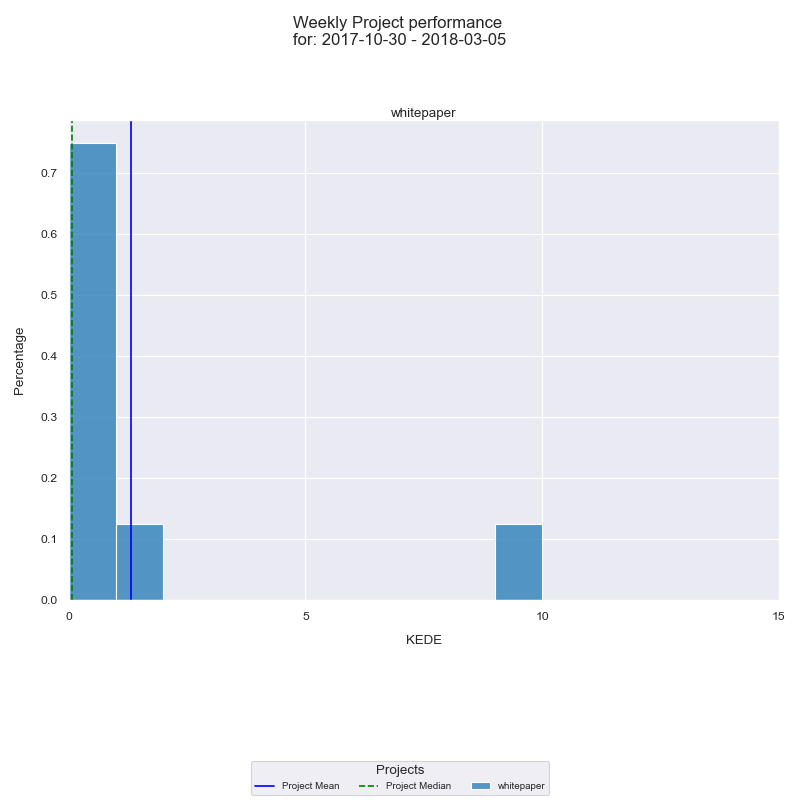
That is expected, because we can safely assume Anatoly did the C implementation based on the white paper and he changed the whitepaper based on its C-language code. That means the knowledge discovered was one and the same. Its application just took two distinct forms - an article and a software program.
Language usage
As we see below TeX was the language used for the white paper.
Solana
Greg started his won implementation of the Solana white paper. This time the language of choice was Rust.
Below is how the stacked-bar chart for Solana looks like when Daily KEDE is aggregated into Weekly KEDE.
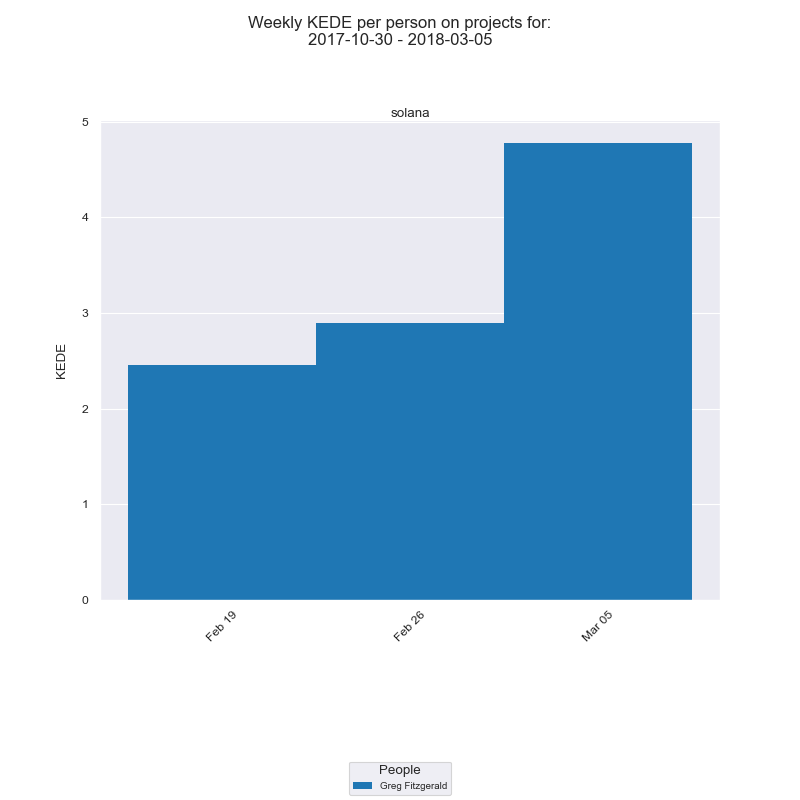
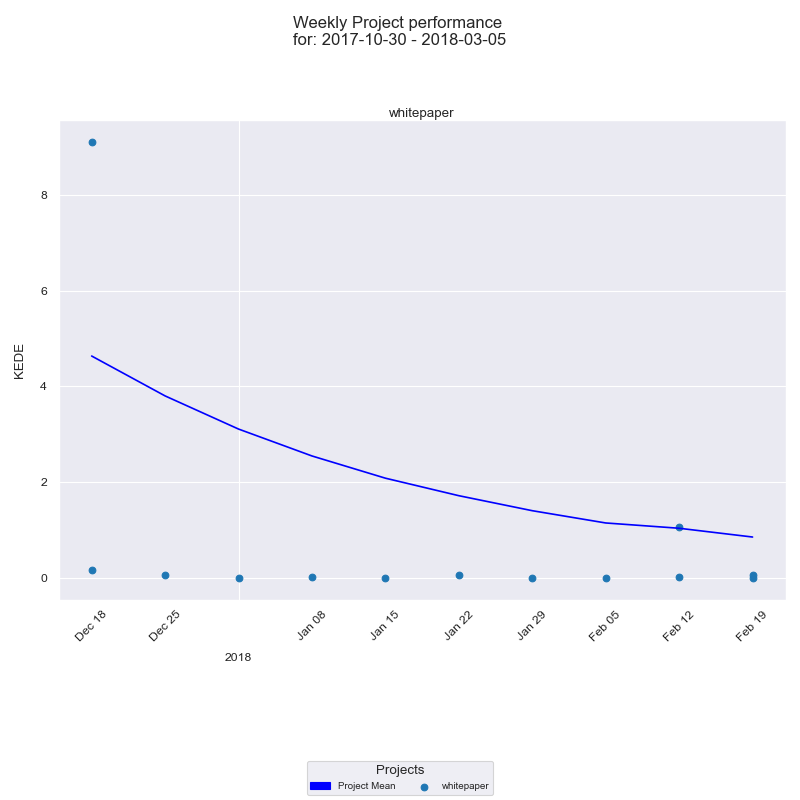
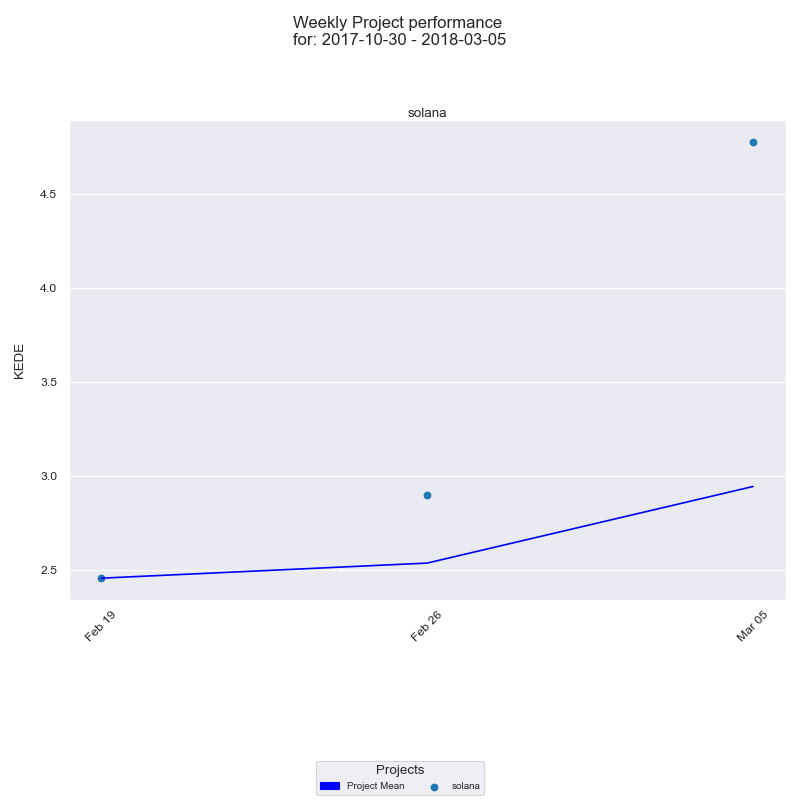
And the time-series.
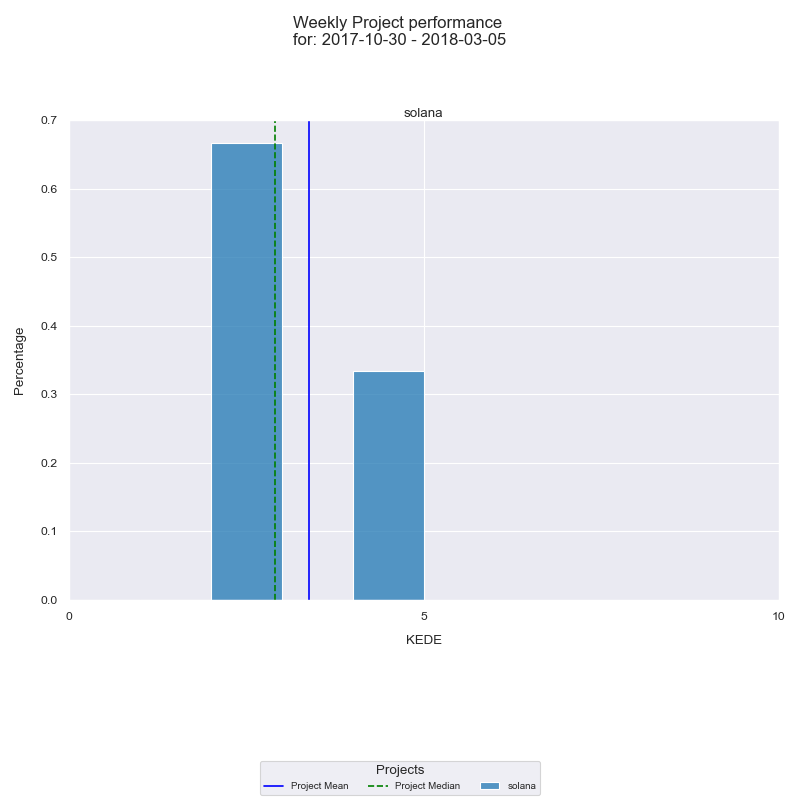
Now we can look at the histogram for Weekly KEDE for the selected period.
From V0 to V0.6 (Multinode testnet)
Anatoly recruited Greg, Stephen Akridge[15] and three others to co-found a company, then called Loom.
Initially the project was published to GitHub under the name Silk in the loomprotocol organization. Around the same time, Ethereum-based project Loom Network sprung up and many people were confused about whether they were the same project. The Loom team decided it would rebrand. They chose the name Solana, a nod to a small beach town North of San Diego called Solana Beach. On March 28th of 2018, the team created the Solana GitHub organization and renamed Greg's prototype Silk to Solana.
They hired Rob Walker, former Senior Director of Engineering at Qualcomm. Also got 2 other new full-time hires, as well as 3 part-timers and some volunteers from the growing Solana community.
In June of 2018, the team scaled up the technology to run on cloud-based networks and delivered v0.6.0 on June 2nd 2018.
Below is the Weekly KEDE time-series diagram for Solana as a whole.
And the Weekly KEDE histogram for Solana as a whole.
Below are the stacked-bar charts for all active projects the Solana team worked on during the period.
We can see below the same data as time series.
The histogram presents a similar Weekly KEDE for all three projects.
Language usage
The languages used are presented below.
Templates
Templates excluded from KEDE calculations are:
- The beginning of Japanese translation due to most of it a pasted original English text.
From V0.6 to v0.13 (Grandview)
On July 19th, 2018 the team published a 50-node, permissioned, public testnet consistently supporting bursts of 250,000 transactions per second. In a later release in November of 2018, called v0.10 Pillbox, the team published a permissioned testnet running 150 nodes on a gigabit network and demonstrated soak tests processing an average of 200 thousand transactions per second with bursts over 500 thousand [2].
On April 17th 2019 the team delivered Grandview v0.13.0 (Multi-region, multi-cloud testnet).
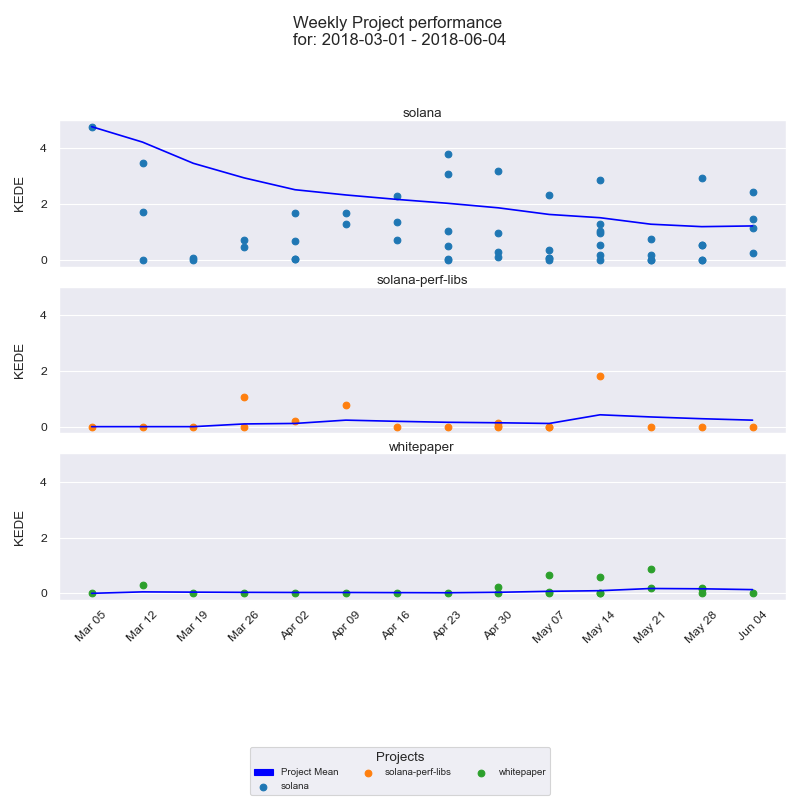
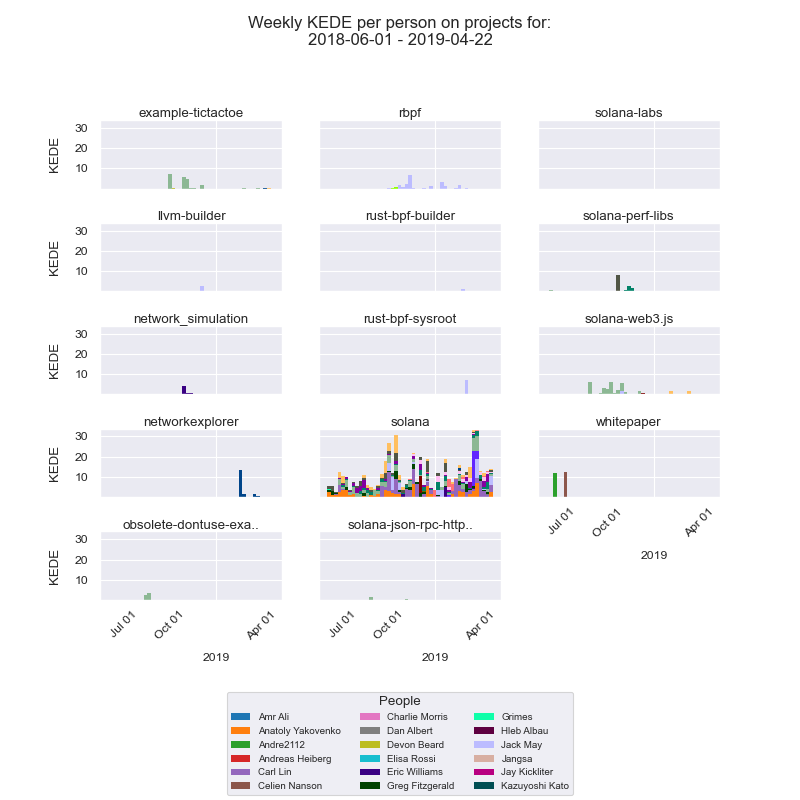
Below is the time-series for all active projects the Solana team worked on during the period.
And here is the histogram for the same period.
The histogram presents the Weekly KEDE for each of the active projects.
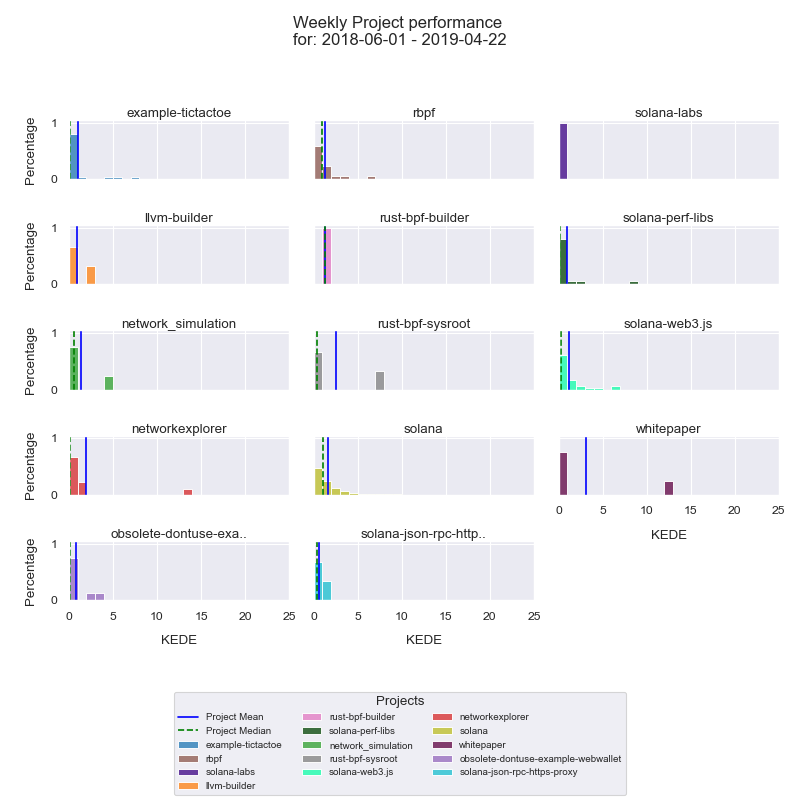
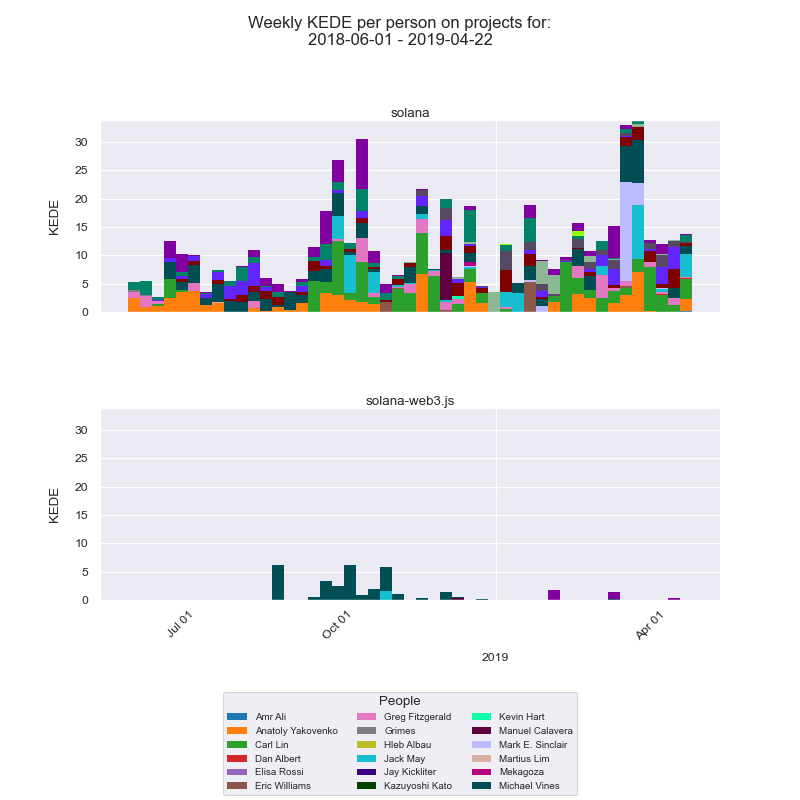
Below are the stacked-bar charts for each of the active projects the Solana team worked on during the period.
Compare most active projects for the period
Let's see the Weekly KEDE for the two most active projects compared to the rest of Solana projects.
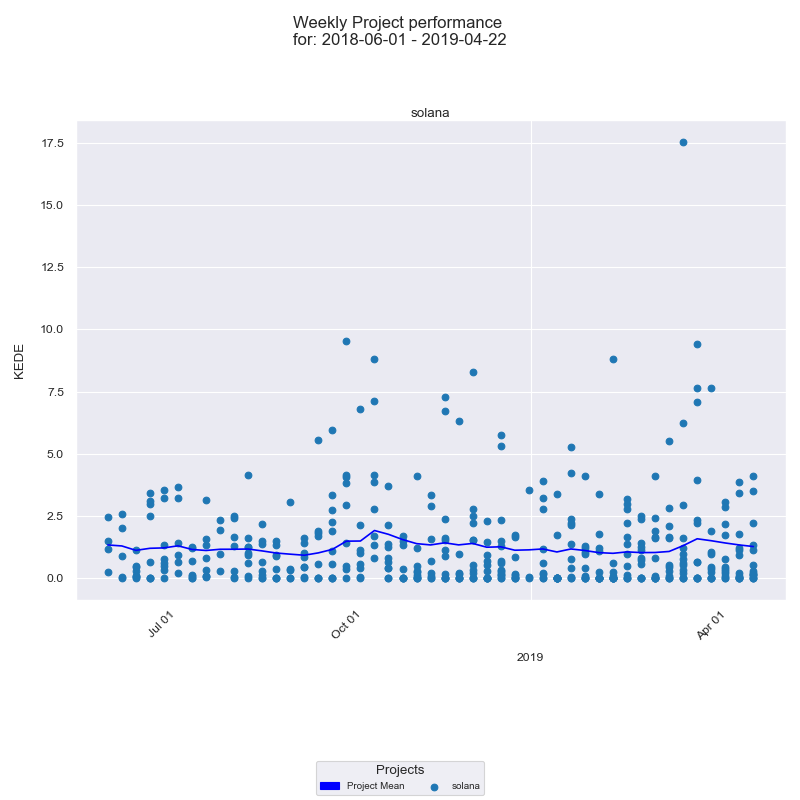
Below is the time series diagram.
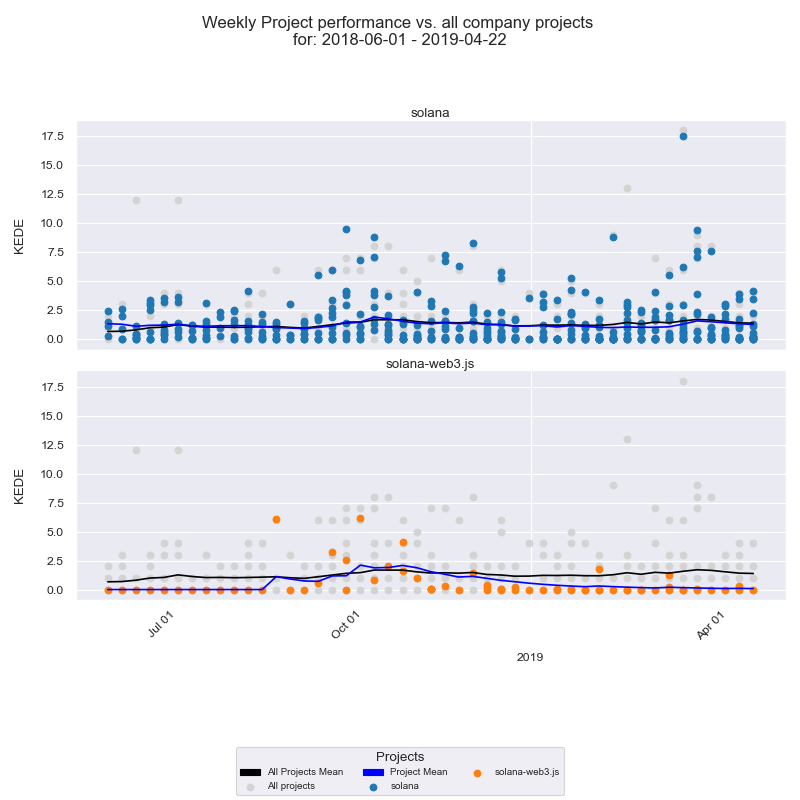
The two projects "solana" and "solana-web3.js" are with blue and orange dots. The rest of Solana projects are with gray dots. We can tell that most of the outliers are either blue or orange.
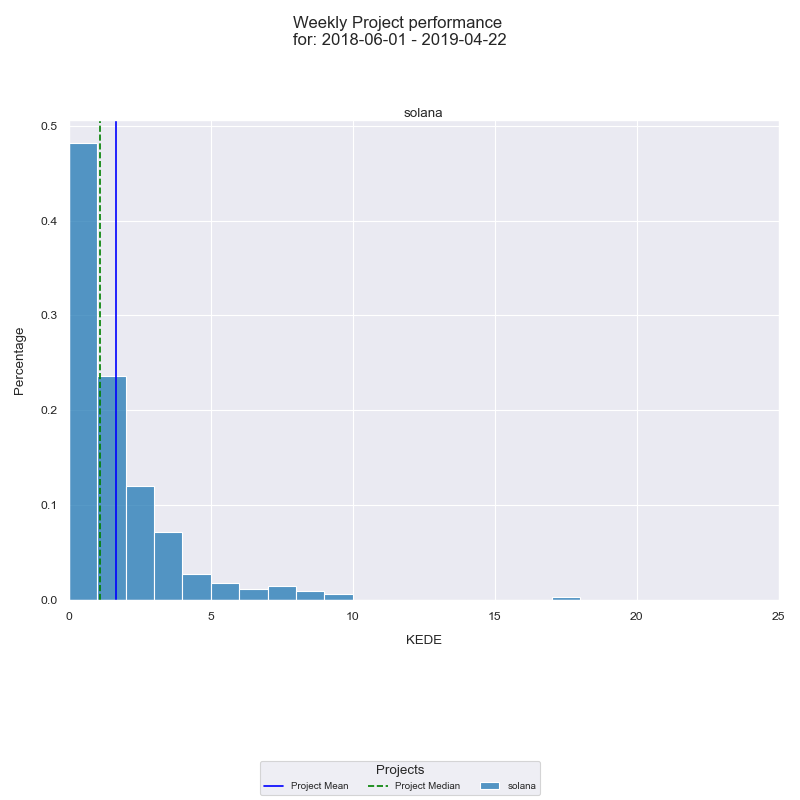
And the histogram for "solana" and "solana-web3.js" is below.
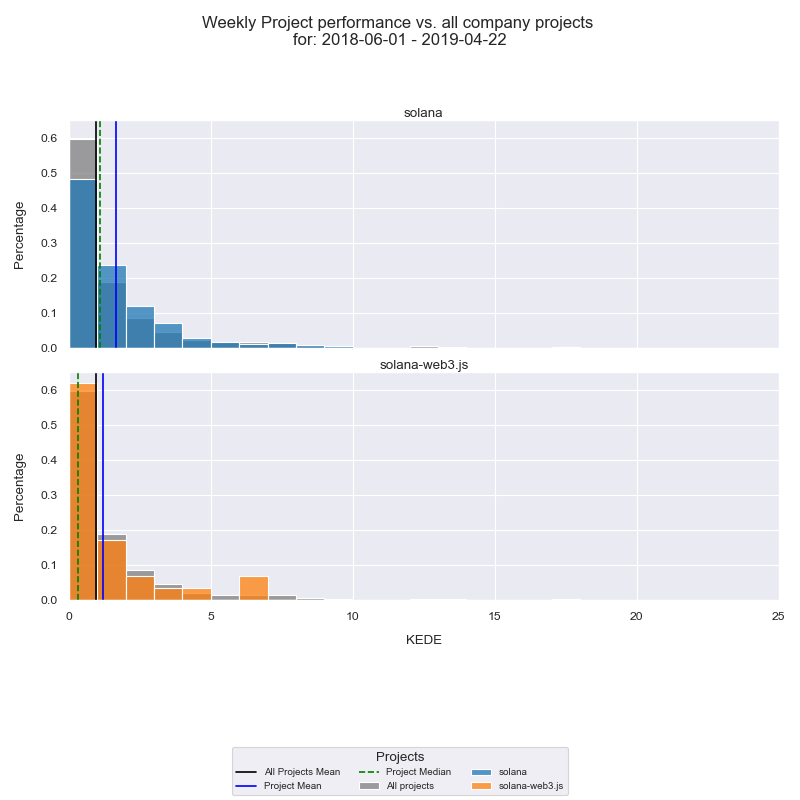
The two projects "solana" and "solana-web3.js" are with blue and orange bars. The rest of Solana projects are with gray bars. We can see the averages for the two projects compared with the average for all other Solana projects.
If we want to check the developers who worked on both projects for the period we need to look at the stacked-bar charts below.
Project "solana"
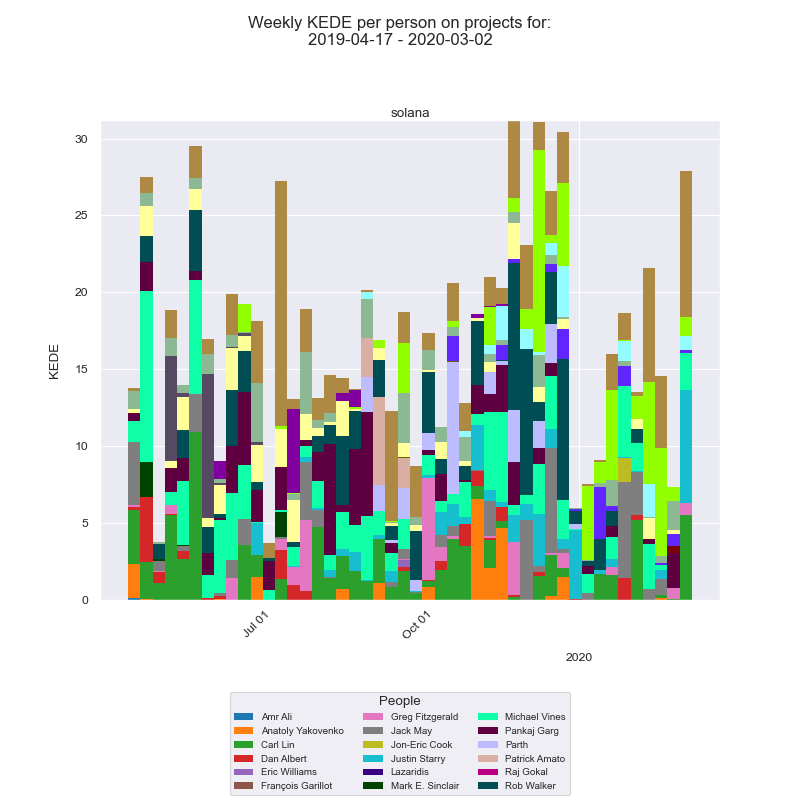
If we need a closer look at individual contributions for project Solana below is the stacked-bar chart.
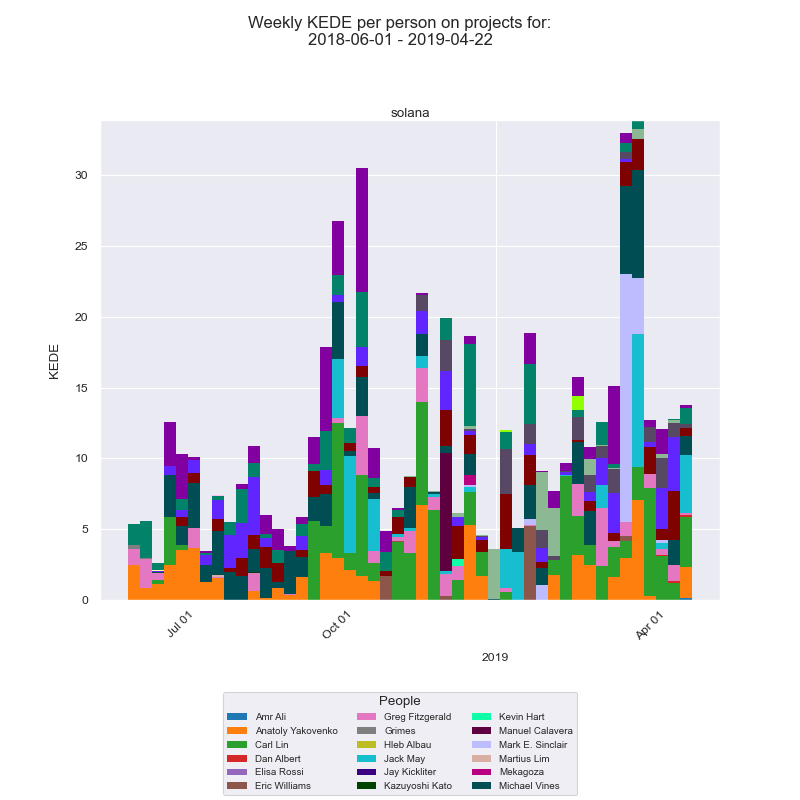
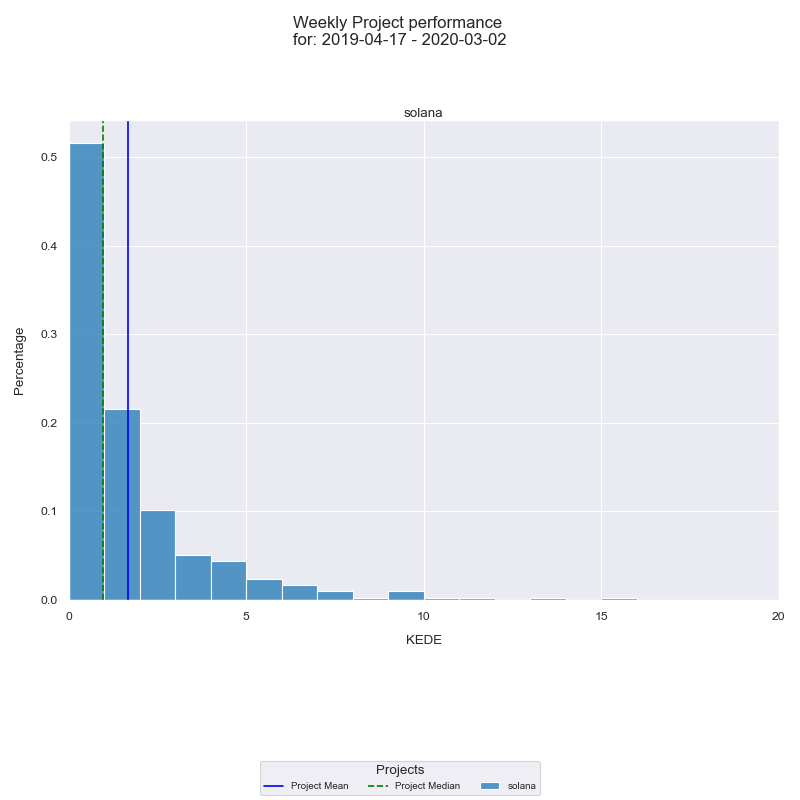
We focus only on the Solana project for the for the average team capability by looking at the histogram below.
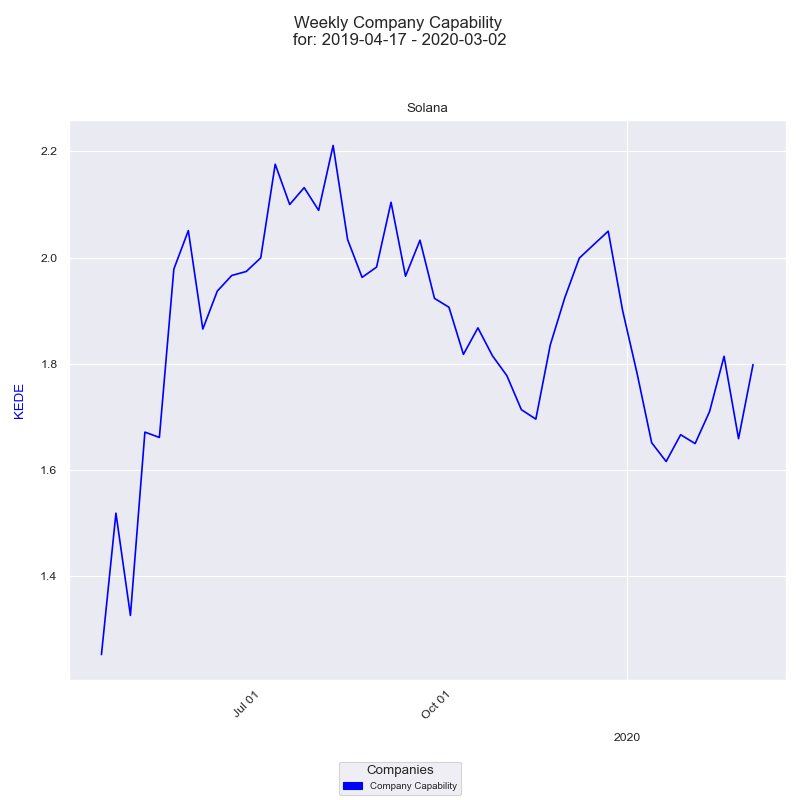
Below is the time-series diagram for the Solana project for the period.
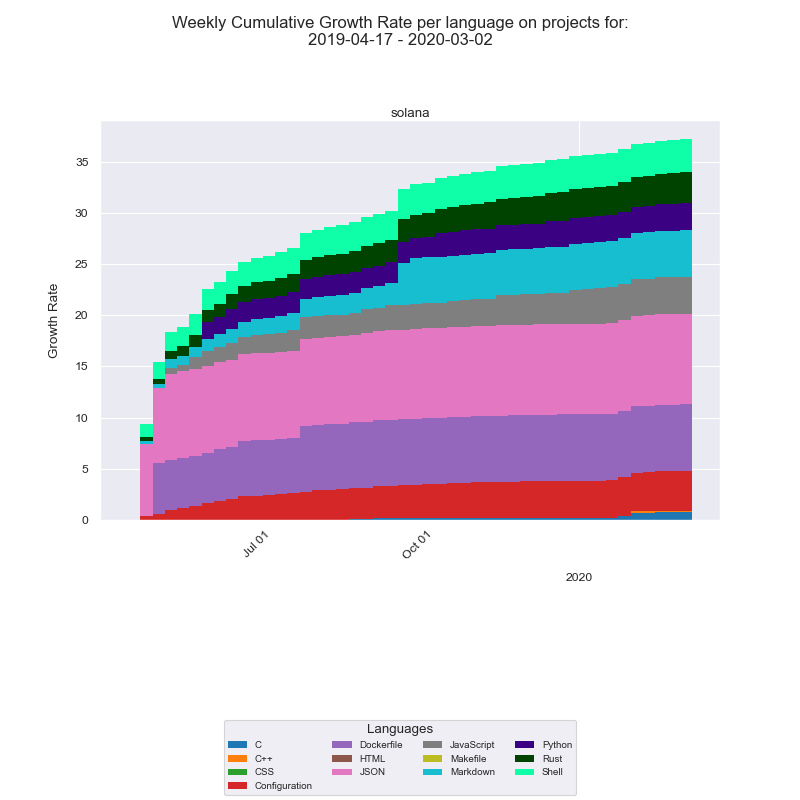
Language usage
The languages used are presented below.
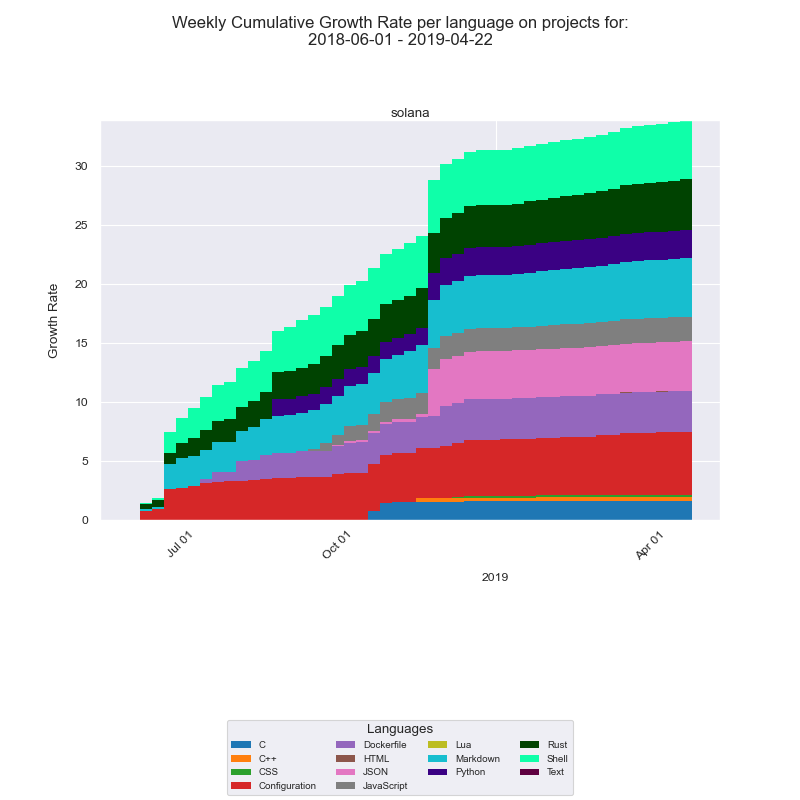
The increase of JSON in November is due to this commit when MIchael moved dashboard management out of the Grafana UI.
Outliers
The average Weekly KEDE at company level fluctuates around 2. However, we see that there are several cases where individual Weekly KEDE is much greater.
Most prominent cases are in the week of October 1st 2018 and in th week of March 18 th 2019 with Weekly KEDE around 18. Let's check if that is a case of template copy & paste.
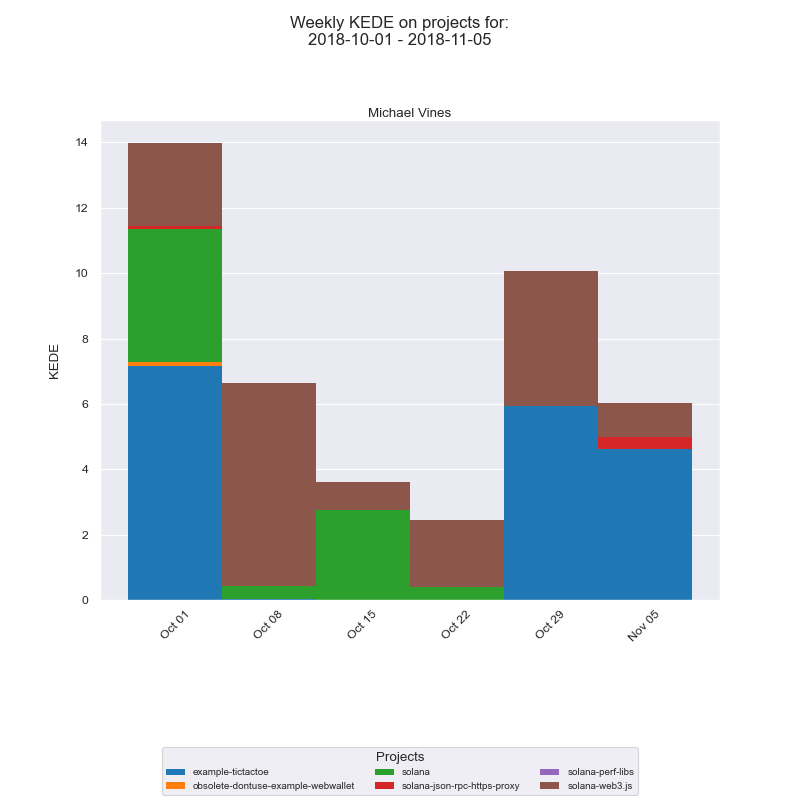
Michael
Below is the Weekly KEDE stacked-bar chart for Michael for the months of October 2018.
We can also see the outliers on the stacked histogram for the same period.
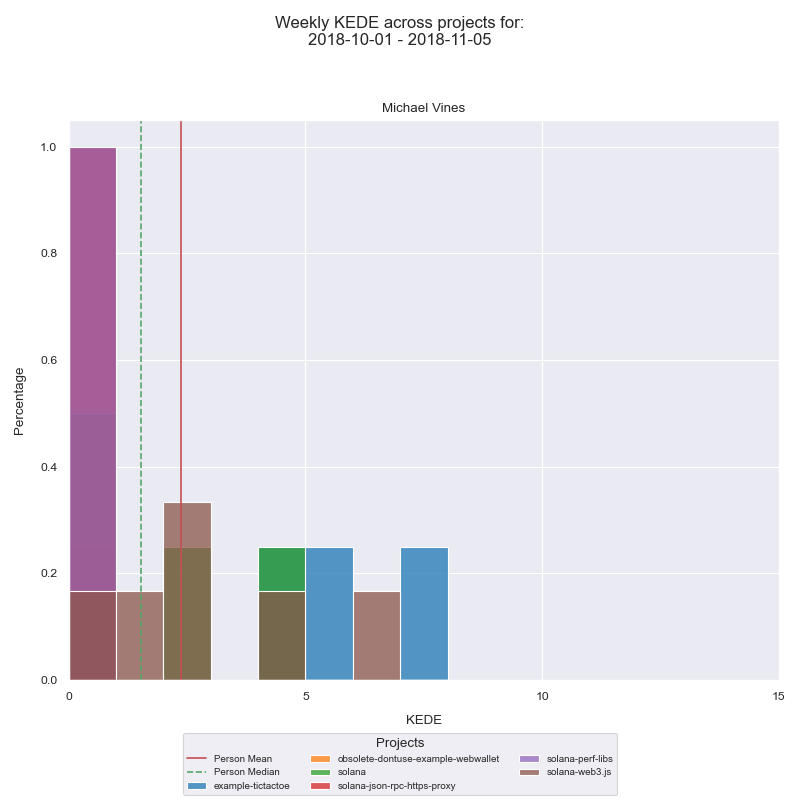
We see that Weekly KEDE for two projects, namely "example-tictactoe" and "solana-web3.js" is much higher than for the rest of the projects the developer worked on during the month of October 2018.
Waste
Since we are looking at an individual contributor it is useful to check the waste as explained here.
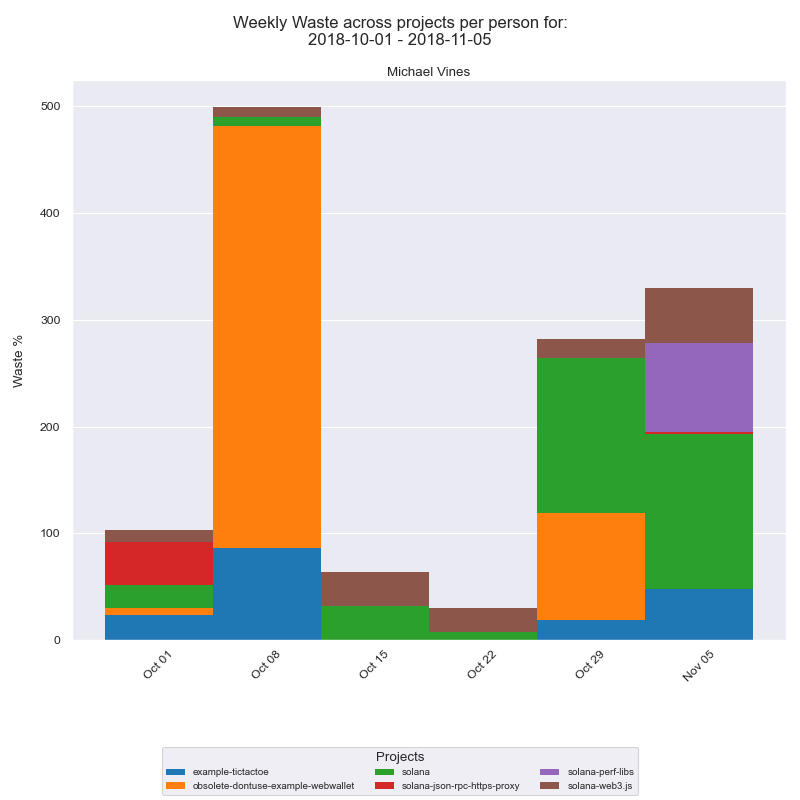
We can see that on the projects where the waste was minimal the developer had the highest Weekly KEDE.
Mark
Next prominent case is Mark Sinclair who in the week of Mar 18 th 2019 with Weekly KEDE greater then 17. Let's see if that is a case of template copy&paste by looking at hist contributions one month before i.e. starting from February 1st 2019.

Mark committed on March 11th and 15th. He worked on no other project but solana during the months of February and March 2019.
On March 11th he made only one commit and that is what made his bar so high. The commit is an implementation of the Replace DbLedger with simple blob store #2566 opened on Jan 28th 2019. The issue was closed on March 28th 2019 based on the KvStore - A data-store to support BlockTree #2897 PR.
We can conclude that that case is not a Template copy&paste, but work that spread over maybe a couple of months and committed in one go. If we had access to the private clone where the developer worked we could see if he committed often or all in one go. In any way that is not important for us, because we want to see the capability of the Solana organization as a whole.
Waste
Let's check the waste as explained here.
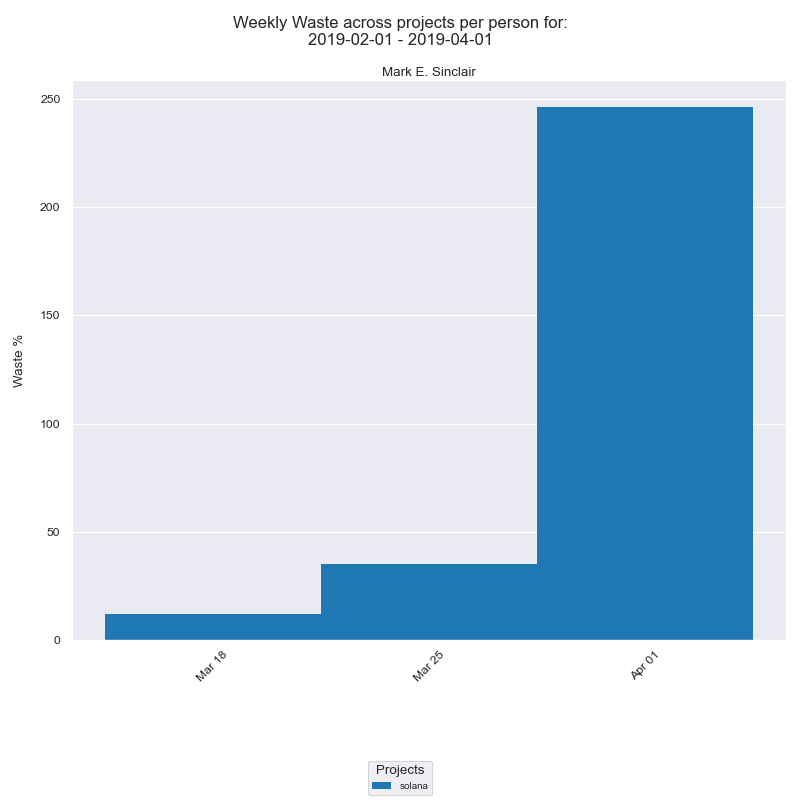
We can see that on the projects where the waste was minimal the developer had the highest Weekly KEDE. In the week of April 1st 2019 the waste is 200%. That means the developer deleted 2 times more code than added and consequently Weekly KEDE is zero.
From v0.13 to Solana 1.0
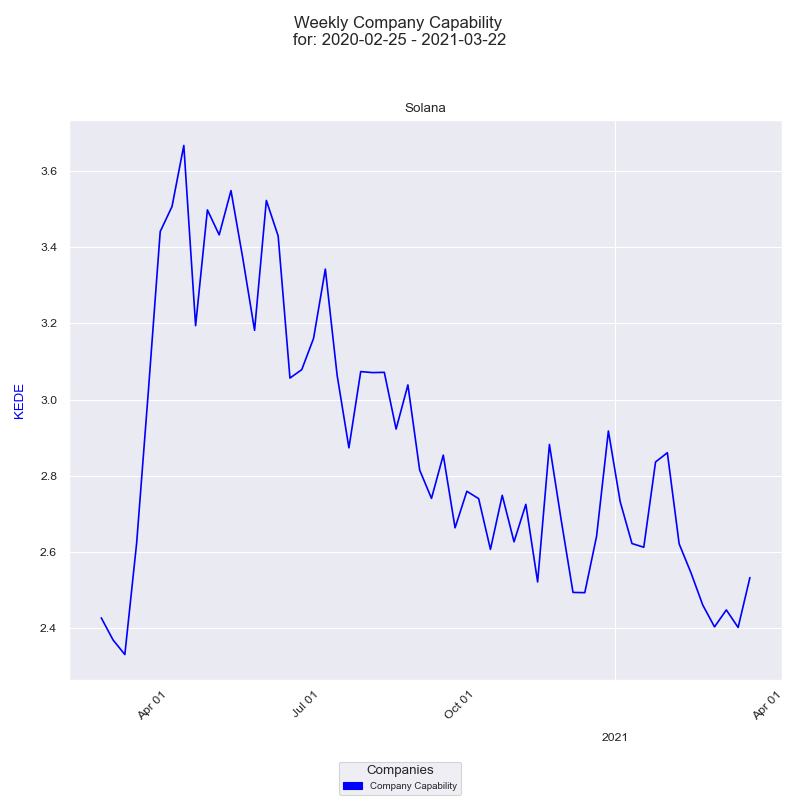
On Feb 25th 2020 the team delivered Solana 1.0.
Below we have the time-series for the whole company for the one year period from Solana V0.13 through V1.0.
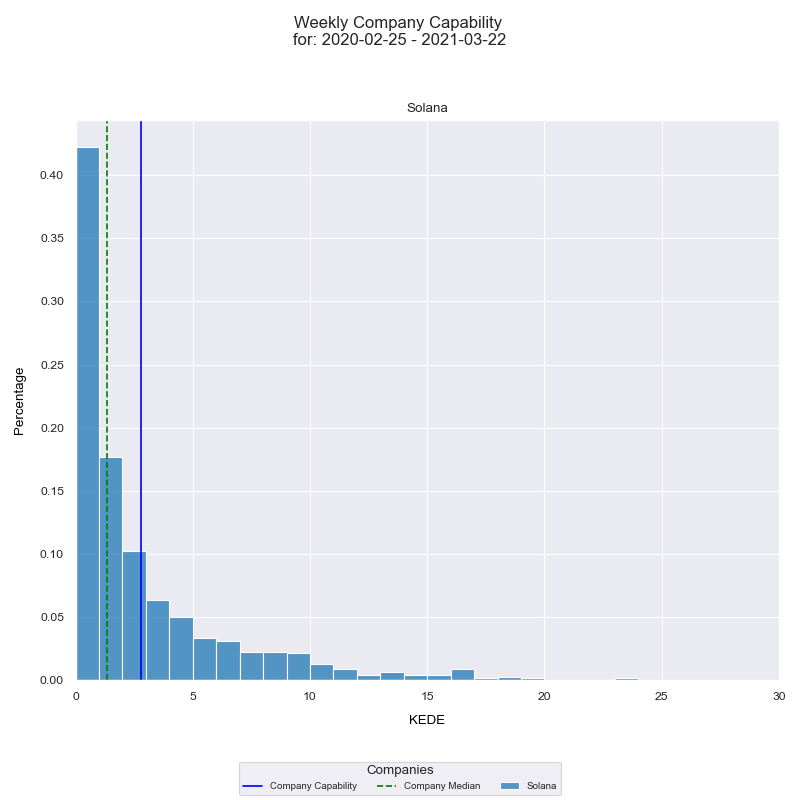
And here is the histogram for the same period.
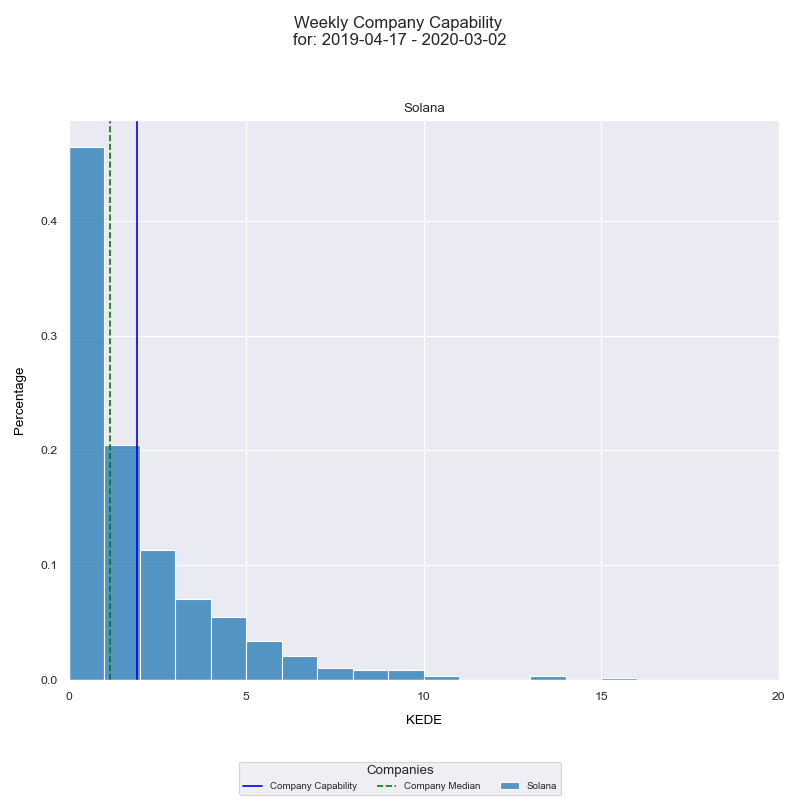
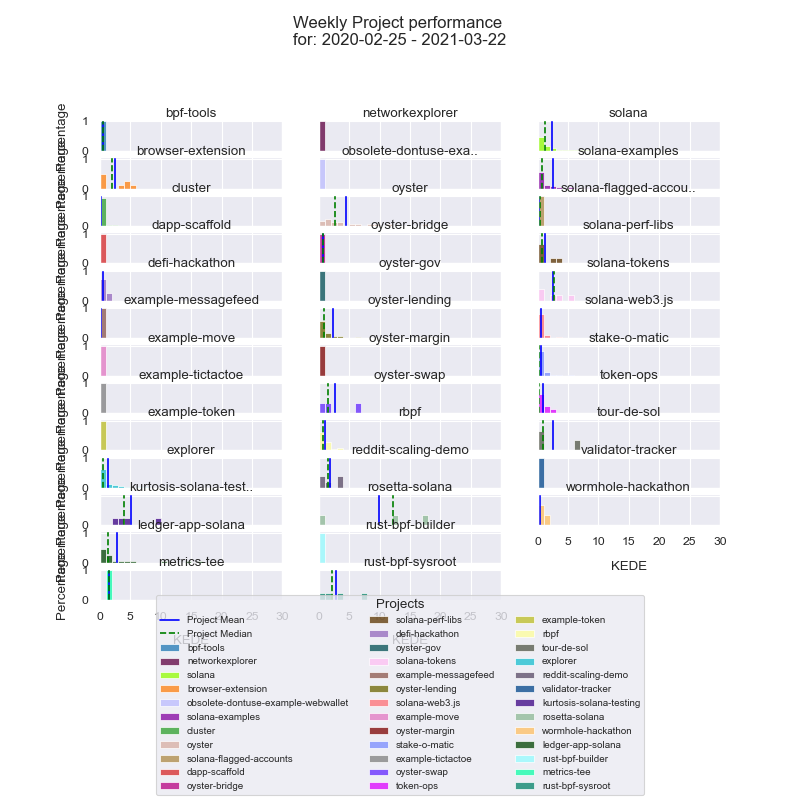
The histogram presents the Weekly KEDE for each of the active projects.

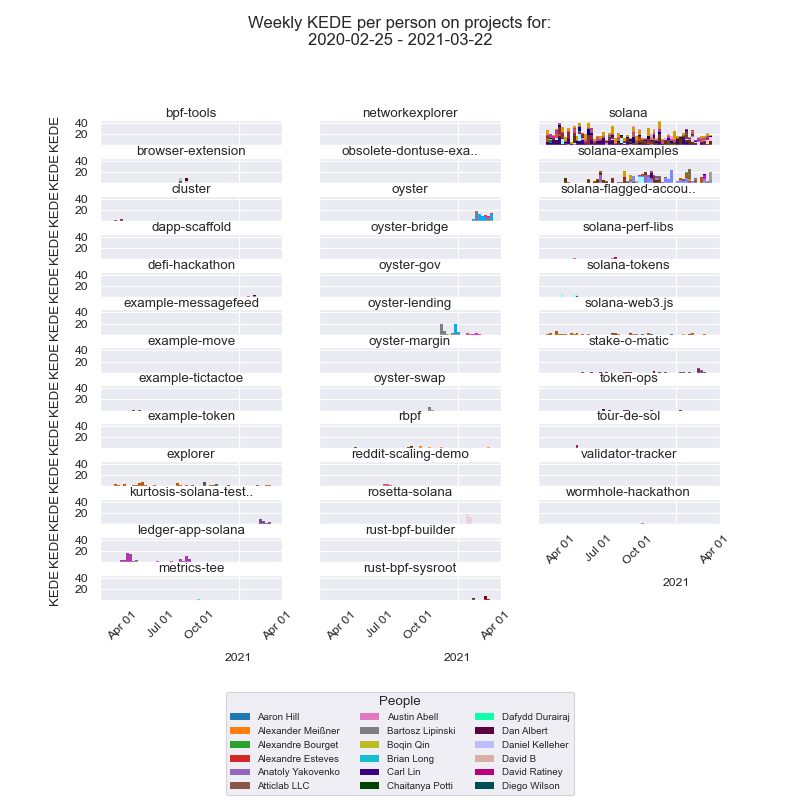
Below is a stacked-bar chart for each of the active projects the Solana team worked on during the period.
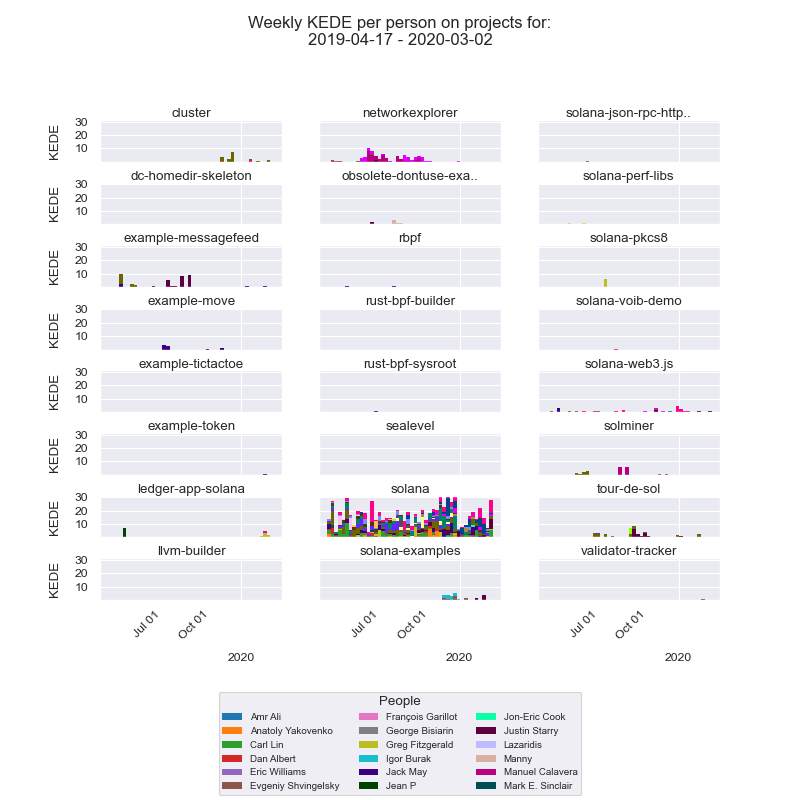
We can see that solana has some high KEDE values. If we need a closer look at individual contributions for "solana" project alone then below is its stacked-bar chart.
Below is the histogram for the Solana project for the period.
And the time-series diagram for the period.

Language usage
IThe languages used in project "solana" are presented below.
It looks like Rust is not the most used language - JSON trumps it just like other languages used in configurations tooling. However that might be misleading due to the way the diagram is designed. It's function is to show the usage trend for each language and not the exact ratio between the languages. That's why it considers only the added characters ano not the deleted ones.
Outliers
Let's see the Weekly KEDE for "solana" project compared to the rest of Solana projects. Below is the time series diagram.
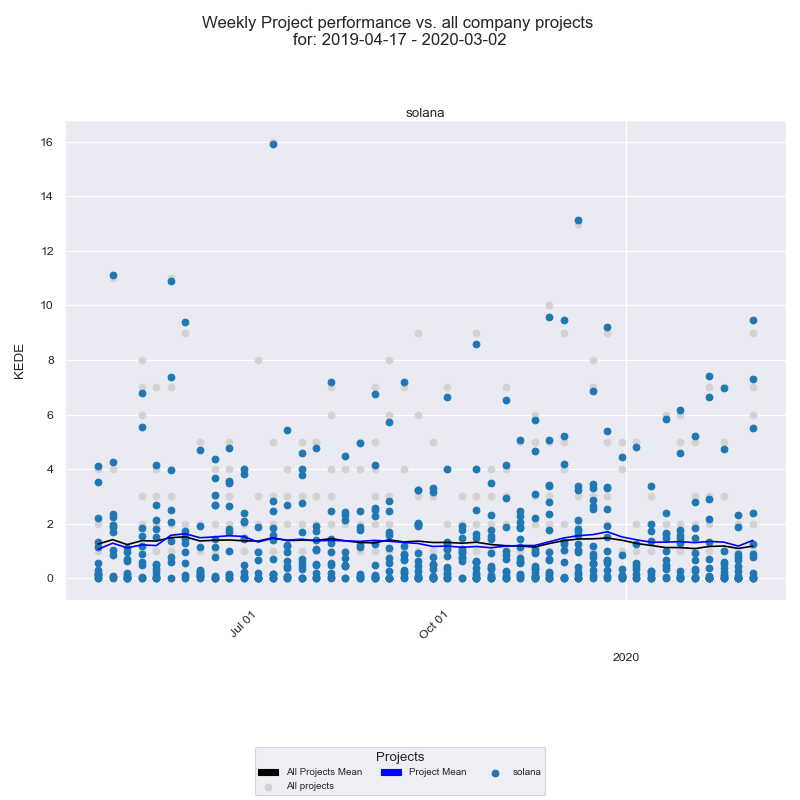
The "solana" project is with blue dots. The rest of Solana projects are with gray dots. We can tell that all of the outliers are blue.
And the histogram for the "solana" project is below.

The project "solana" is with blue bars. The rest of Solana projects are with gray bars. We can tell that the average for the "solana" project is much higher than the average for all other Solana projects. In fact "solana" median is very close to the average of all the other Solana projects.
The average Weekly KEDE for project "solana" fluctuates close to 2. However, we see that there are several cases where individual Weekly KEDE is much greater.
Tyera
Most prominent case is in the week of Jul 15 th 2019 with Weekly KEDE close to 16. Let's see if that is a case of template copy & paste.
We can check that by looking at Tyera Eulberg individual capability for the months of June and July 2019.
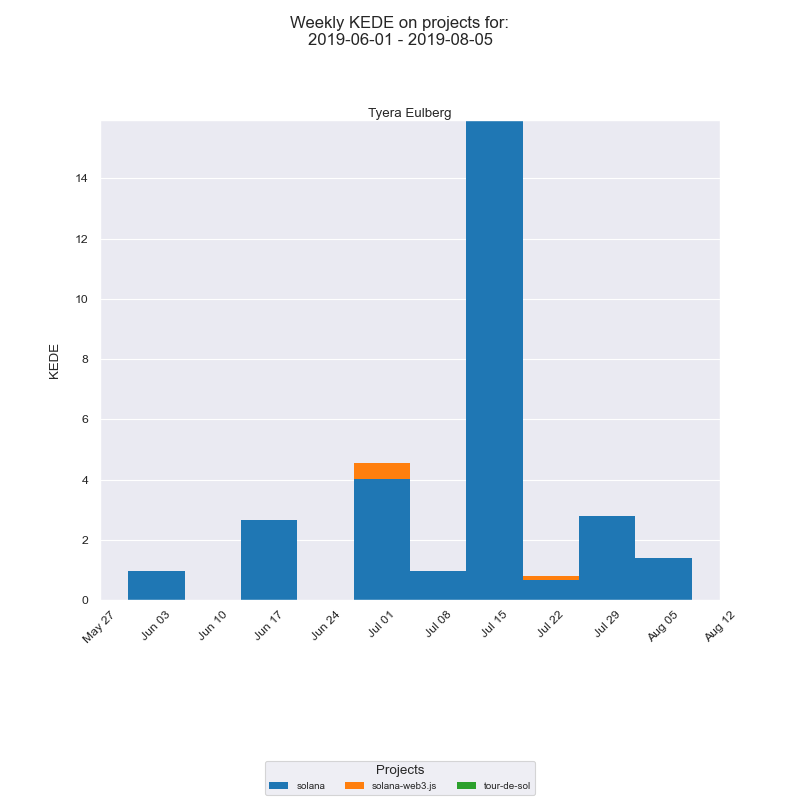
We see that Tyera Eulberg performed much better than the rest of the team in that week. She committed on Jul 12th one commit that is what made his bar so high. The commit message lists some 16 issues fixed, including changes to technical documentation. The issues were closed on July 12th 2019 based on the v0.16: Expand Config program; implement Validator Info CLI #5045 PR. We can conclude that that case is not a Template copy & paste in a single day, but work that spread over a longer period committed in one go.
Same logic applies to this commit and this commit as well.
We see that for the months of June and July 2019 she worked on three projects. For the period she had two weeks of no contributions.
That is even more visible if we look at her Daily KEDE for the same period. As we see below she had many day with no contributions to the Solana:master.
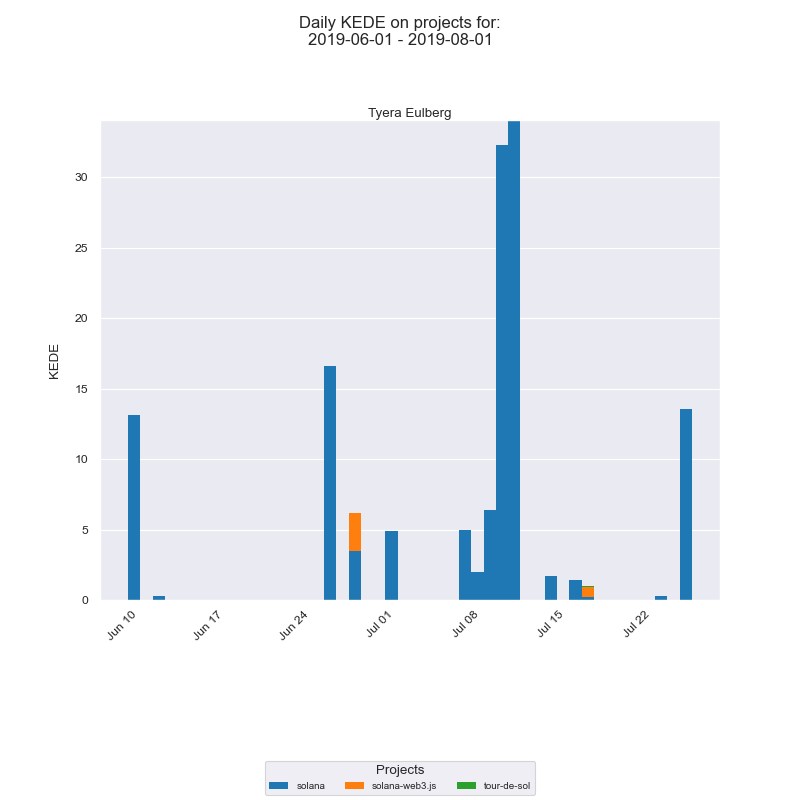
After all of the above, it is reasonable to accept that she worked on many things in her private clone and merged a lot of work in one commit.
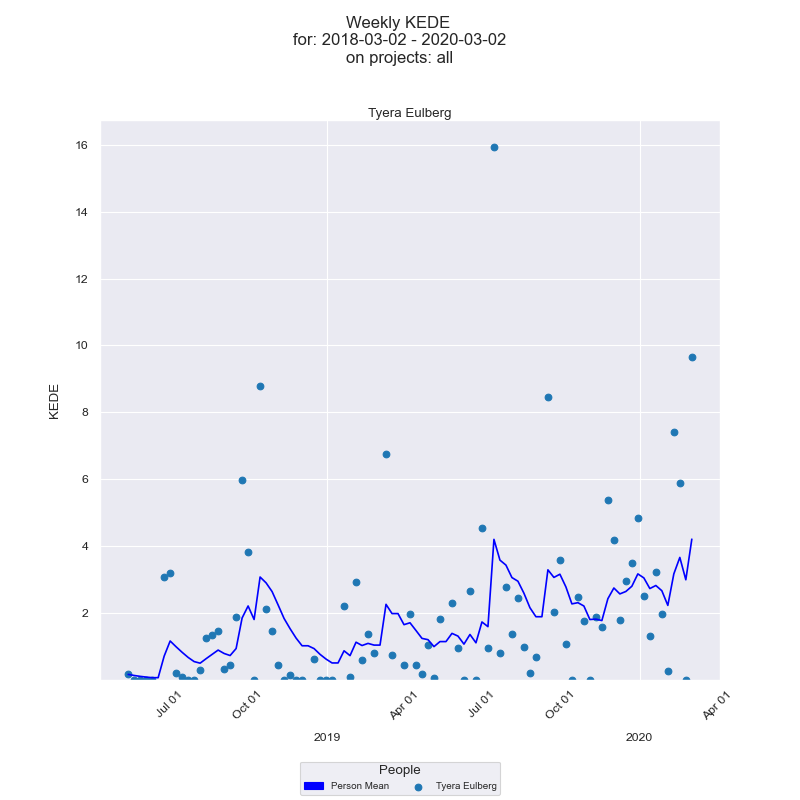
Let's check if the developer has a habit of holding changes for a while before committing in big chunks. For that we shall check her history from V0 through V1.0.
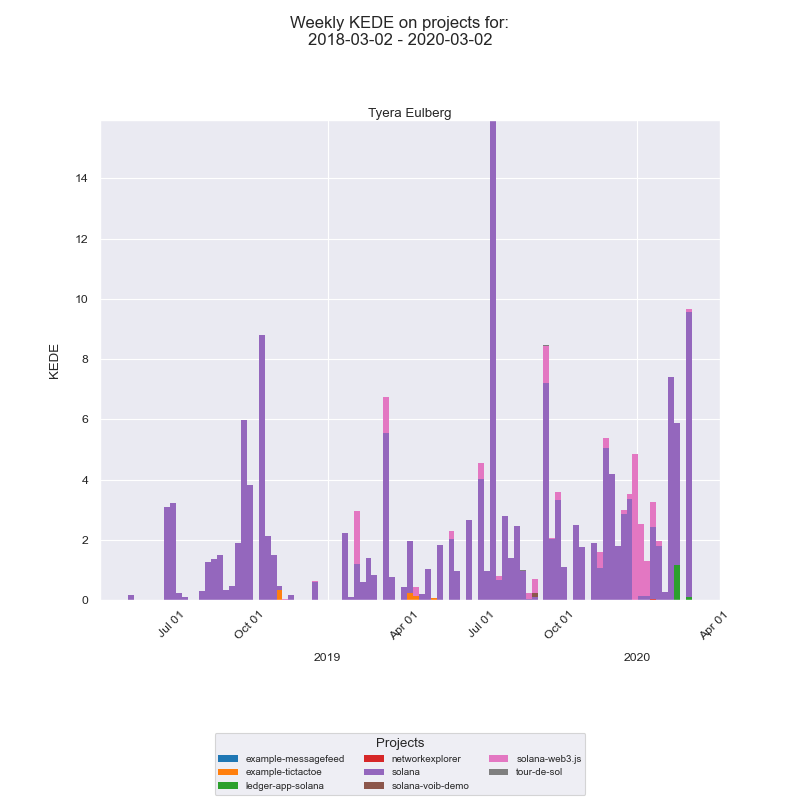
And it is quite visible from the KEDE trend on the time-series diagram.
Igor
Most of the cases when a template was used are not visible on the diagrams because they are not part of the KEDE calculations at all. One such case is with Igor Burak.
He did two large commits: one commit on Nov 28th 2019 and one commit on the next day. First commit message reads "+add redux template" which if we look into the code means he added State Container for JS Apps as a template. Next commit message reads "game page" and it added a template animate.css. Both commits are not included in the KEDE calculations.
Jack and Michael
The last couple of weeks of April 2019 were very productive for some of the developers as we can see on the diagram below.
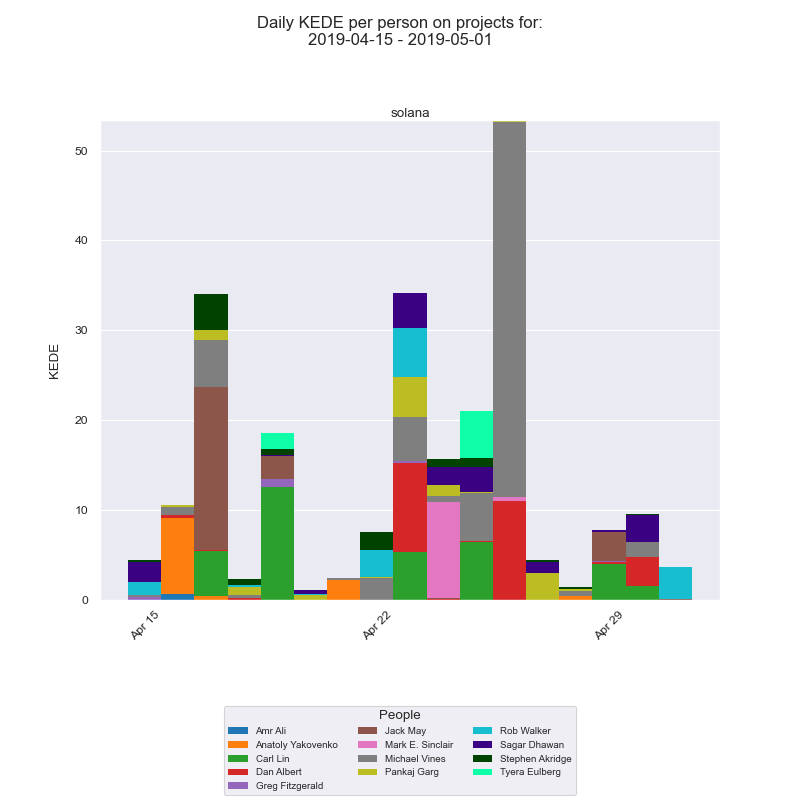
We see that Jack May and Michael Vines were the most efficient of the team. Let's check the same data but aggregated in Weekly KEDE.
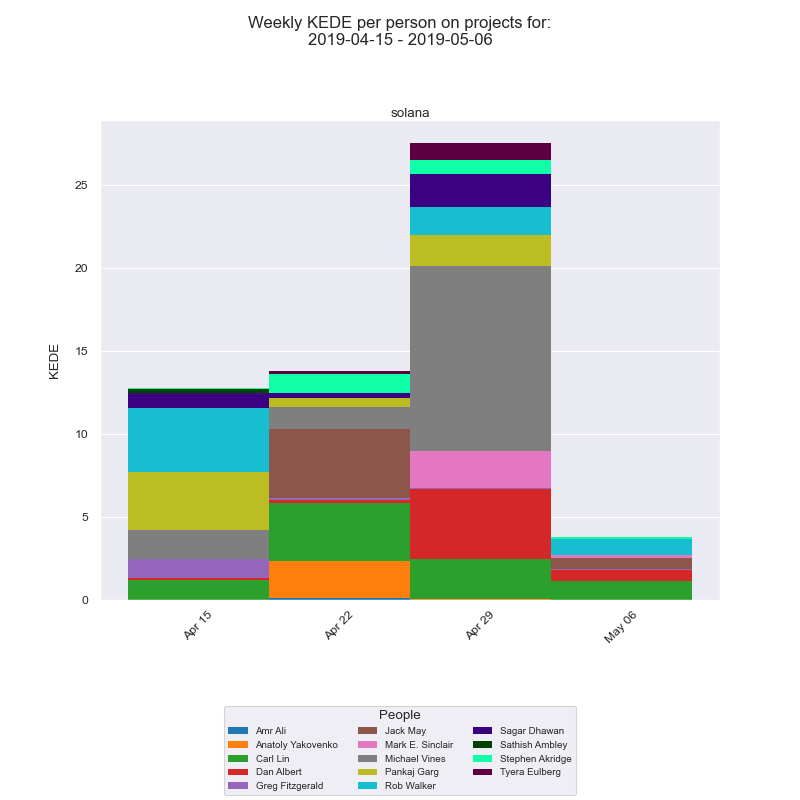
We see that as explained before Weekly KEDE aggregates all Daily KEDE for 7 days before. Here week with date April 29th 2019 aggregates the previous 7 days including April 22nd but excluding itself i.e. April 29th. The previous week with date April 22nd aggregates the previous 7 days including April 15th but excluding itself i.e. April 22nd.
We can check Jack May's commit on April 17th 2019 and Michael Vines' commit on April 26th 2019.
Jack May worked on moving "solana-labs/token-exchange" repo into the main Solana repo as explained here Add bench-exchange #3826. Hence that is definitely a Template, which is excluded from KEDE calculations. Same logic applies to this commit on January 7th 2020.
Michael Vines worked on merging code as explained here Merge the "cloud" grafana dashboard into the normal dashboard #4007. Since he did the work in a private clone which was later deleted we conclude that it was not simply "moving" code around and not a Template case.
Trent
The month of December 2019 has also some outliers.
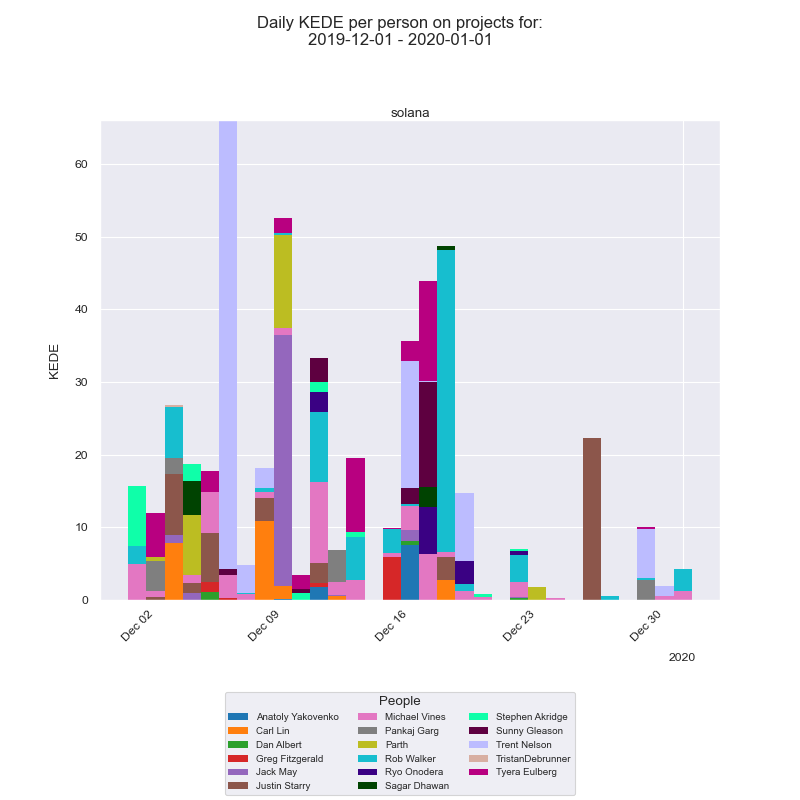
We see that Trent Nelson was standing above the others. Let's check the same data but aggregated in Weekly KEDE.
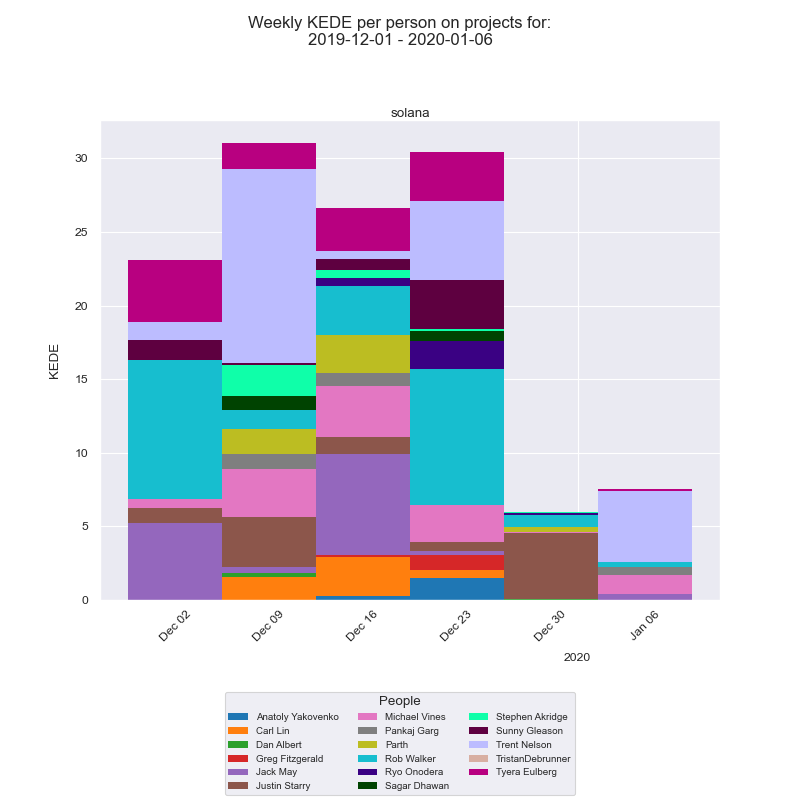
We can check the commit on Dec 7th 2019.. The commit message lists some 8 issues fixed in 18 files. The changes were requested a month before in Add program and runtime support for Durable Transaction Nonces #6845 RP. The developer worked in a private clone and then merged his 4 commits into Solana:master. The review process took almost a month and as one of the reviewers put it "...four commits could totally be each their own PRs". We can conclude that this definitely was not a Template case.
We can look into more suspicious Template cases, but that is not the purpose of this report. It is to see the capability of the solana organization as a whole.
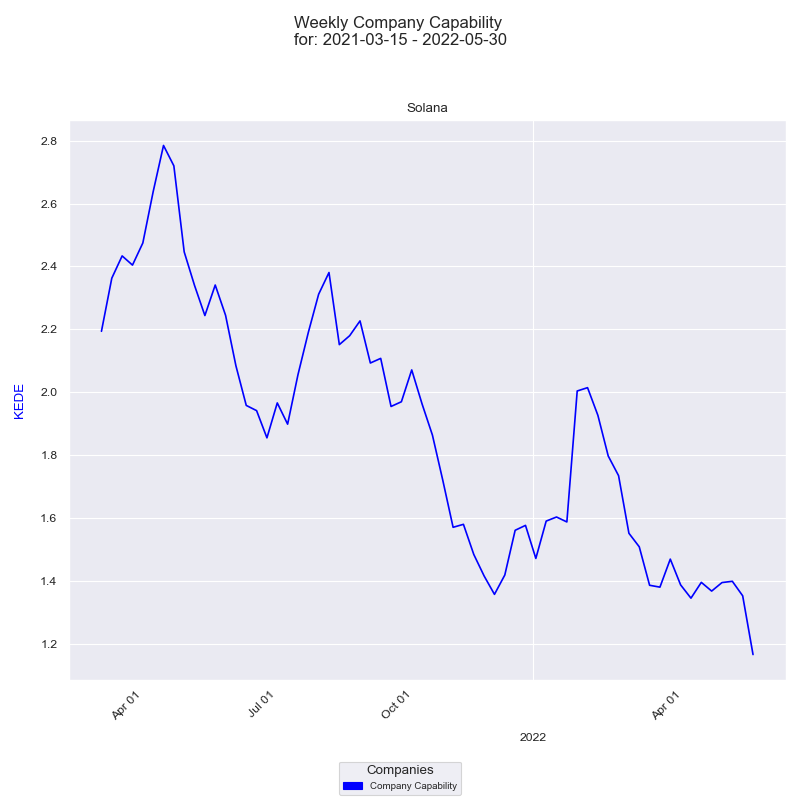
From V1.0 to V1.6
On March 15th 2021 the team delivered Testnet - v1.6.0.
Below are the stacked-bar charts for all active projects the Solana team worked on during the period.
And here is the histogram for the same period.
Average Weekly KEDE increased 50% to almost 3 year-over-year. That is not a small thing. At the same time median Weekly KEDE also increased around 50%.
Looks like the Solana team acquired knowledge and became more efficient.
The histogram presents the Weekly KEDE for each of the active projects.
Below is a stacked-bar chart for each of the active projects the Solana team worked on during the period.
Outliers
<There are several cases where individual Weekly KEDE is much greater.
It is visible that "oyster", "oyster-lending", "solana-examples" and "solana" projects have weeks with Weekly KEDE much higher than the rest of the projects for the period.
We can see the outlier projects using the time-series diagram below.
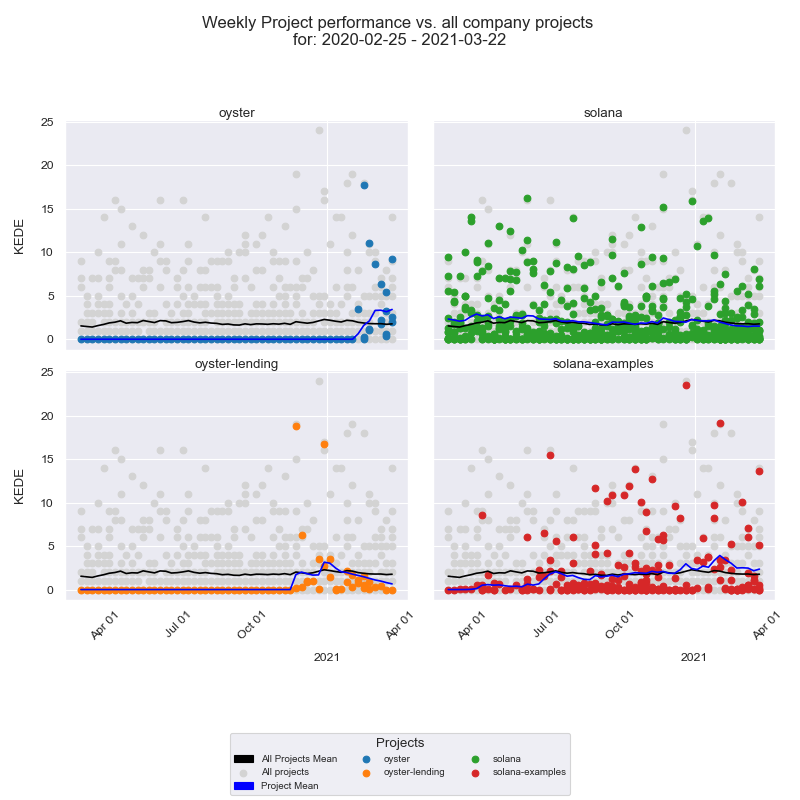
If we want to check the developers who worked on outlier projects for the period we need to look at the stacked-bar charts below.
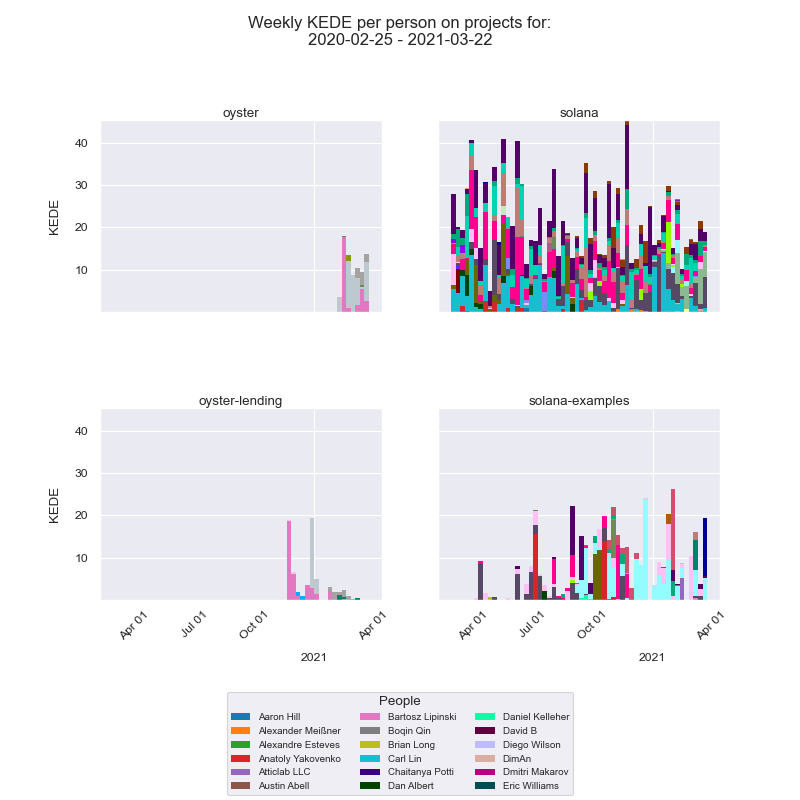
It looks like it was Jon, Bartosz and Tester who had a much higher Weekly KEDE than their teammates on projects. Bartosz in particular was all over the place.
Let's check the efficiency in Daily KEDE for "oyster-lending".
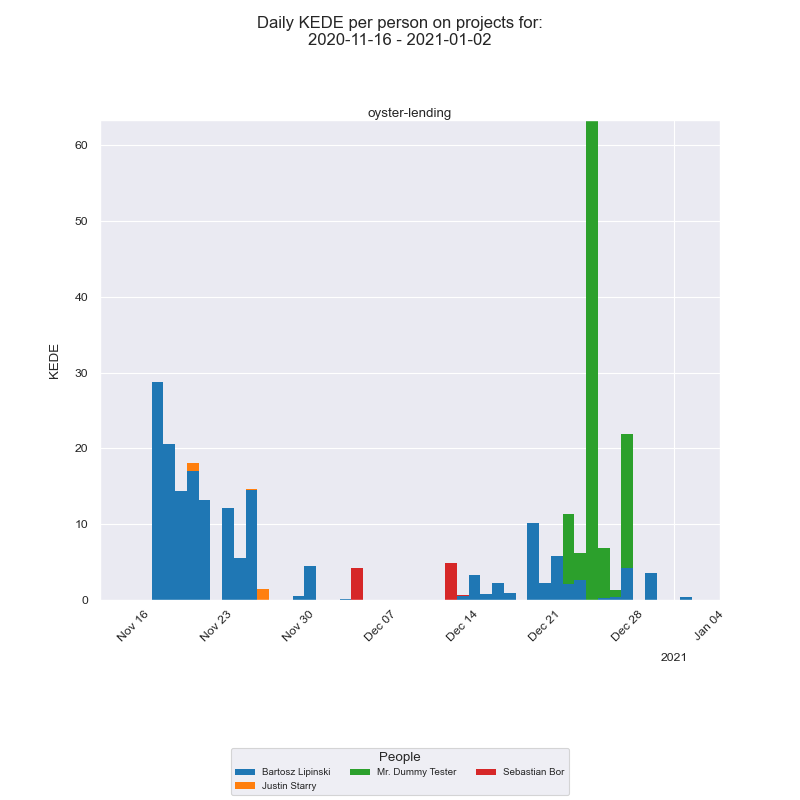
We see that Bartosz and Tester worked on the project together with two other developers.
Jon Cinque
The developer opened a new token-swap: Add instructions to deposit / withdraw one token #937 pull request on December 9th 2020. Most of the work on the PR was done on Dec 16th 2020. We can check the biggest commit. Our understanding is that there was no Template code copied & pasted, but genuine programming.
Tester
Tester opened a new [WIP] adding Margin Trading Scaffolding #15 pull request on Dec 23rd 2020. Yes, it was Christmas time! Looks like the PR was maintained in order to show to the Solana team how development proceeds. Most of the work on the PR was done on Dec 25th 2020. Yes, on Christmas! We can check the biggest commit. Our understanding is that there was no Template code copied & pasted, but genuine programming. The work on PR finished on Dec 29th just in time for the New Year. As his teammate Bartosz put it "This is awesome work, thanks a lot."
Bartosz
Looks like that a commit in the week ending on Nov 23rd 2020 used a template from Ant Design. The template code is not included in KEDE calculations.
Same happened with this commit where a project was bootstrapped with [Create React App](https://github.com/facebook/create-react-app). The template code is not included in KEDE calculations.
In the week ending on Dec 28th 2020 the developer contributed a lot of code into many small commits. For example, this commit. Our understanding is that the contributions during that week were genuine and not template copied & pasted.
We won't go further looking into each and every outlier. That is not the purpose of this study. In fact, such outliers have no effect on the average efficiency of the Solana team as evident from the company efficiency diagram.
From V1.6 to Mainnet v1.9.24
On May 24th 2022 Solana releazed Mainnet v1.9.24.
Below are the stacked-bar charts for all active projects the Solana team worked on during the period.
And here is the histogram for the same period.
Jon Cinque
Two commits 1 and 2 in the week of April 28th 2021. Those are not templates.
Jeff
two commits 1, 2 in the week of September 20th 2021. Those are not templates.
Sebastian
Two commits 1, 2 in the week of May 31th 2021 in the context of PR. The messages say : "Co-authored-by: Jon Cinque <jon.cinque@gmail.com>" That is not a case of templates.
Two commits 1, 2 in the week of May 24th 2021 The messages say : "Co-authored-by: Jon Cinque <jon.cinque@gmail.com>"" Co-authored-by: Michael Vines <mvines@gmail.com>" That is not a case of templates.
One commit in the week of January 31st 2022. The messages say : "Co-authored-by: Jon Cinque <jon.cinque@gmail.com>" That is not a case of templates.
Conclusion
In the past it was argued that the physician's touch captured information richer than any tool. Researchers, however, persevered. They wanted to discover reproducible laws in medicine, and the verbal descriptions from doctors were not getting them there. Words are idiosyncratic; they vary from doctor to doctor and even for the same doctor from day to day. Numbers never waver. Today physicians use a thermometer in order to get an understanding about what is going on inside the black box that is a human organism. It is clear we can use KEDE the same way - to get visibility into the black box that is an organization developing software.
We acheived the aim we started with:
- Establish a benchmark of how efficient an innovative software development organization is. That should serve as the lower bar for all other companies who develop software. Unless they do the same level of innovation they should be several times more efficient.
- Show how the efficiency of human capital - an intangible source of value, can be measured and placed next to revenue numbers
As explained here individual KEDE is a function of processes and policies of the organization the software developer works in. Even though KEDE is objective and scientifically based you should not rely only on it. There are cases where KEDE alone is not sufficient to understand how the knowledge discovery happens inside the organization. Very often you'd need a closer look inside the black box and take into account the white box. The white box goes beyond the numbers and gets into how the organization produced the numbers.
Appendix A: Methodology
We have included repositories that are exclusively hosted on GitHub for this release of the report. Repositories that have been forked from other repositories have been excluded from our analysis such that some genuine development activities may not have been included. Some projects may be affected more than others. In this report, we have included activity not only of the main branch, but also of all other branches. Hence commits that have not yet reached the main branch or are for any reason kept out from the main branch have been included.
Project splana-examples comprises of three repositories:
- https://github.com/solana-labs/solana-program-library.git
- https://github.com/solana-labs/example-helloworld.git
- https://github.com/solana-labs/break.git
List of analyzed repositories:
- https://github.com/solana-labs/solana.git
- https://github.com/solana-labs/solana-program-library.git
- https://github.com/solana-labs/solana-web3.js.git
- https://github.com/solana-labs/example-helloworld.git
- https://github.com/solana-labs/wallet-adapter.git
- https://github.com/solana-labs/explorer.git
- https://github.com/solana-labs/oyster.git
- https://github.com/solana-labs/rbpf.git starting from 2018-09-01 commit
- https://github.com/solana-labs/tour-de-sol.git
- https://github.com/solana-labs/dapp-scaffold.git
- https://github.com/solana-labs/stake-o-matic.git
- https://github.com/solana-labs/break.git
- https://github.com/solana-labs/example-tictactoe.git
- https://github.com/solana-labs/solana-perf-libs.git
- https://github.com/solana-labs/ledger-app-solana.git
- https://github.com/solana-labs/networkexplorer.git
- https://github.com/solana-labs/example-messagefeed.git
- https://github.com/solana-labs/metaplex.git
- https://github.com/solana-labs/solana-solidity.js.git
- https://github.com/solana-labs/obsolete-dontuse-example-webwallet.git
- https://github.com/solana-labs/cluster.git
- https://github.com/solana-labs/whitepaper.git
- https://github.com/solana-labs/solminer.git
- https://github.com/solana-labs/oyster-lending.git
- https://github.com/solana-labs/solana-season.git
- https://github.com/solana-labs/browser-extension.git
- https://github.com/solana-labs/solana-flagged-accounts.git
- https://github.com/solana-labs/reddit-scaling-demo.git
- https://github.com/solana-labs/example-token.git
- https://github.com/solana-labs/inc-20210825.git
- https://github.com/solana-labs/llvm-builder.git
- https://github.com/solana-labs/bpf-tools.git
- https://github.com/solana-labs/solana-bigtable.git
- https://github.com/solana-labs/example-move.git
- https://github.com/solana-labs/defi-hackathon.git
- https://github.com/solana-labs/wormhole-hackathon.git
- https://github.com/solana-labs/buffer-layout.git starting from 2021-07-09 commit
- https://github.com/solana-labs/network_simulation.git
- https://github.com/solana-labs/oyster-swap.git
- https://github.com/solana-labs/oyster-bridge.git
- https://github.com/solana-labs/metrics-tee.git
- https://github.com/garious/loom.git
- https://github.com/solana-labs/rust-bpf-sysroot.git
- https://github.com/solana-labs/solana-tokens.git
- https://github.com/solana-labs/dc-homedir-skeleton.git
- https://github.com/solana-labs/kurtosis-solana-testing.git
- https://github.com/solana-labs/solana-voib-demo.git
- https://github.com/solana-labs/cargo-run-bpf-tests.git
- https://github.com/solana-labs/buffer-layout-utils.git
- https://github.com/solana-labs/oyster-margin.git
- https://github.com/solana-labs/rosetta-solana.git
- https://github.com/solana-labs/rust-bpf-builder.git
- https://github.com/solana-labs/token-ops.git
- https://github.com/solana-labs/sealevel.git
- https://github.com/solana-labs/solana-build.git
- https://github.com/solana-labs/solana-json-rpc-https-proxy.git
- https://github.com/solana-labs/solana-labs.github.io.git
- https://github.com/solana-labs/validator-tracker.git
- https://github.com/solana-labs/solana-pkcs8.git
References
1. Solana
4. Solana Git
5. CryptoMiso
6. Solana Labs CEO Shares Roadmap Following $314M Fundraise
8. Blockchain Development Trends Q2 2020/21
9. Solana whitepaper LaTeX source
12. "Fast SHA-256 Implementations on Intel® Architecture Processors"
13. 8 Innovations that Make Solana the First Web-Scale Blockchain / Jul 30, 2019
14. Greg Fitzgerald
15. Stephen Akridge
Getting started


