Reports Methodology
Used to produce the contents of all reports.
Repositories
A Git repository is the .git/ folder inside a project folder. This repository tracks all changes made to files in the folder, building a history over time. Meaning, if you delete the .git/ folder, then you delete your project's history.
Forked repositories
Anyone can create a copy of a GitHub project through a single effortless click on the GitHub repository's fork button. Similarly, one can also create a repository copy with just two Git commands
We consider as forked if two repositories having in their history at least one commit having the same SHA and commit date.
Forking repositories is a widespread practice and leads to the development activity of one ecosystem included in another. Including all forks in the analysis adds a lot more clarity than noise.
Branches
Git supports branching — the possibility to develop parts of software outside the master trunk. Branching support allows developers to manage multiple isolated versions of the working tree, which can be modified independently of each other. It allows branches to be used for development of individual features, for experimenting with design solutions, and for preparing releases.
Other tools focus on the development activity in the main branch, thus omitting part of the changes in the repository. However, consideration of branches is important for precise calculation of individual developer's contributions which are the source for KEDE calculations.
In order to retrieve the history of changes for a given file — i.e., list of the commits that affect this file — one needs to traverse the commit graph to identify such commits. A traversal and handling of commits one by one is necessary because Git does not store any auxiliary data that would allow to perform this operation easier. However, for calculating KEDE it is not needed the changes per file, but the total contributions of an individual developer over a time period.
KREDEHub works so that all commits for each repository's branch (i.e. not only main or master was included) were indexed and analyzed. Hence commits that have not yet reached the main branch or are for any reason kept out from the main branch have been included. When using KEDEHub we can include individual repositories outside of those organizations to most accurately show development activity to the core development.
Contributing Developers
We measure the monthly active developers in GitHub organization repositories over time based on their commits. The developer commits to all core repositories of each organization were de-duplicated against commits to other core repositories during a month to find all unique contributors per month.
For the forked repositories there are two cases:
- Repository is forked and after that never synced with the origin.
- Repository is synced with the origin on a regular basis.
For the first case all contributing developers are from your organization. For the second case there will be contributing developers from other organizations.
Dates and time
Git commits store two timestamps: the author date and the committer date. The author date is the date the commit was originally made. The committer date is essentially the last date the commit was modified.
KEDEHub utilizes the author date and ignores the committer date.
Certain commands, e.g. cherry picking and rebasing, modify the commits and thus will change the author date and committer date[8].
For example, after a 1. git rebase and 2. git push -f all commit timestamp will become
the time when completed the rebase, instead of the actual original time of the commits.
Git can also create new timestamps while rebasing via git rebase --ignore-date.
Also new timestamps can be created using amend e.g.
							1. git rebase -i master
							2. git commit --amend --date=now
							3. git push origin branch> -f
Out-of-order Commits
Another possible problem with Git allowing users and tools to set the commit date is that the date specified might seem valid, but actually be wrong. This could lead to a graph where a particular node has a commit date that is actually older than its parent node. We call these out-of-order commits.
Three are two main cases, two possible kinds of out-of-order commits. First, commit timestamps that seem too old. Second, commits who have a parent that is newer than themselves.
Templates and auto generated files
Templates
Templates are explained here.
In order to shaw how Templates are excluded from KEDE calculations let's look at commit for "obsolete-dontuse-example-webwallet" project . The message reads "Boilerplate". Indeed that is a copy & paste of a web template. This template does not count as visible on the stacked-bar chart where for Aug 10th 2018 there is no KEDE for "obsolete-dontuse-example-webwallet" project but only for "solana" project.
Another example of template usage is this commit that is "Project boilerplate from eunikitin/modern-package-boilerplate".
Another example is from Nov 3rd with code from an Intel White-Paper [9].
Auto generated files
Eaxmple is the code contributed to project "obsolete-dontuse-example-webwallet" in one single commit. The message says "Add DataStoreBackingStore". Indeed it was google-cloud/datastore npm package added to package-lock.json.
package-lock.json is automatically generated for any operations where npm modifies either the node_modules tree, or package.json. It describes the exact tree that was generated, such that subsequent installs are able to generate identical trees, regardless of intermediate dependency updates. This file is intended to be committed into source repositories. However it is machine generated and as such needs to be considered a Template and as such excluded from KEDE calculations.
Cargo.lock contains exact information about Rust dependencies. It is maintained by Cargo and should not be manually edited. If building a non-end product, such as a rust library that other rust packages will depend on, put Cargo.lock in .gitignore. If building an end product, which are executable like command-line tool or an application, or a system library with crate-type of staticlib or cdylib, check Cargo.lock into git Since it is machine generated and as such needs to be considered a Template and as such excluded from KEDE calculations.
How KEDE is reported
KEDE aggregations
Daily is the default aggregation of KEDE per person. It is calculated by summing up all code contributions for a given developer on a given day as explained here.
Below is a Daily KEDE bar chart for a a developer who worked on a project.
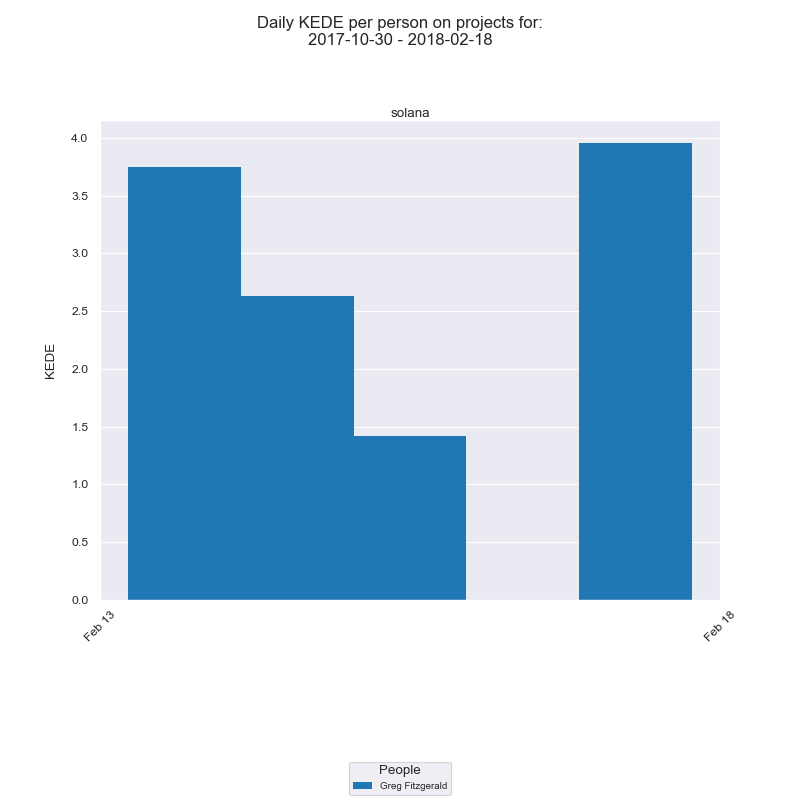
On the x-axis we have the days of the selected period. On the y-axis you have Daily KEDE. The legend lists the developer who contributed to the selected project.
There are also other ways of KEDE aggregation including:
- aggregating on weekly basis to produce Weekly KEDE;
- aggregating on monthly basis to produced Monthly KEDE;
- aggregating on a quarterly basis to produce Quarterly KEDE.
Weekly KEDE is calculated by summing up all KEDE for a particular person for a particular week and dividing by 5. We use 5 days because the assumption is developers don't work and shouldn't work over the weekend.
Below is how the bar chart for the same developer, project and time period from above looks like when Daily KEDE is aggregated into Weekly KEDE.
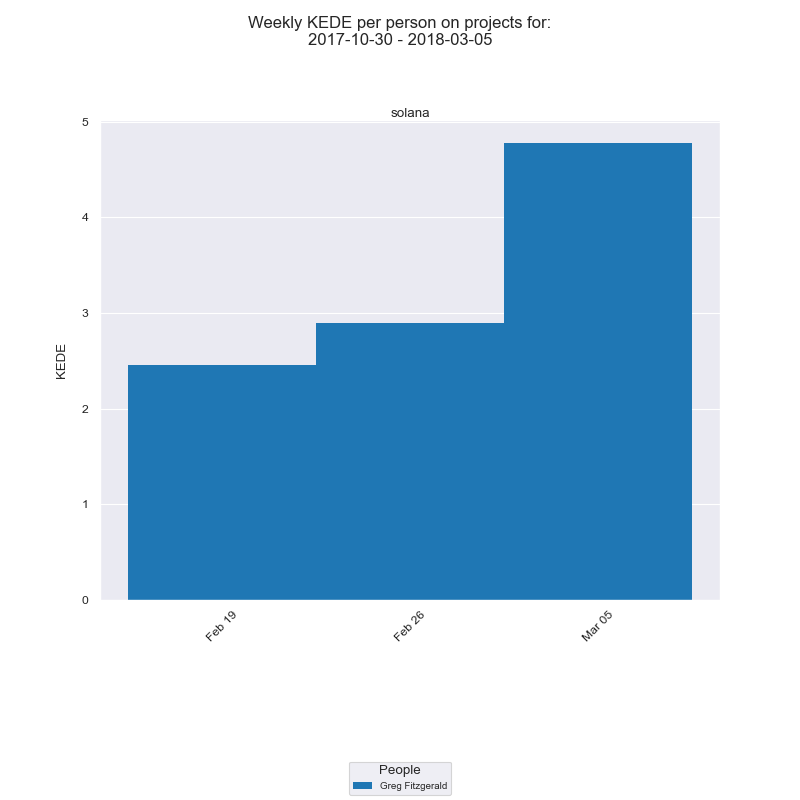
Each week starts on Monday and aggregates all Daily KEDE for 7 days before but excluding its Monday. That is it includes Monday, Tuesday, Wednesday, Thursday, Friday, Saturday and Sunday. That is to reflect the usual language developers used when they say "what we did last week..." during the current week. It also aims to accommodate the fact that some people work and commit over the weekend even though they shouldn't.
In our case, the week with date Feb 19th aggregates the previous 7 days including Feb 18th but excluding itself i.e. Feb 19th.
Trends and averages
It is useful to see the trends and the average Daily KEDE values as they change in time. For that we will use the standard diagrams for time series and histograms.
Below we have Daily KEDE presented as a time series for the 5 months period from 30 October 2017 until March 2018 for the project "loom".
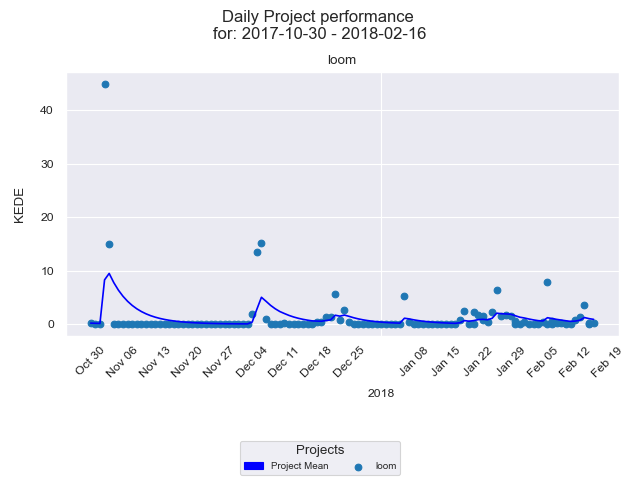
The diagram presents a time series of Daily KEDE values for a selected period. On the x-axis we have the week dates. On the y-axis we have Daily KEDE values. Each dot is the Daily KEDE of one developer summed up from all commits for the day over the repositories the selected project is linked with. Hence, what is shown is only the fraction contributed to the selected project from the developer's overall weekly performance. That is because a developer could work for more than one project during the week. In our case we have only one repository linked to project "solana".
The trend line in dark blue illustrates how Daily KEDE for all developers on the project has changed over time. It is calculated using EWMA.
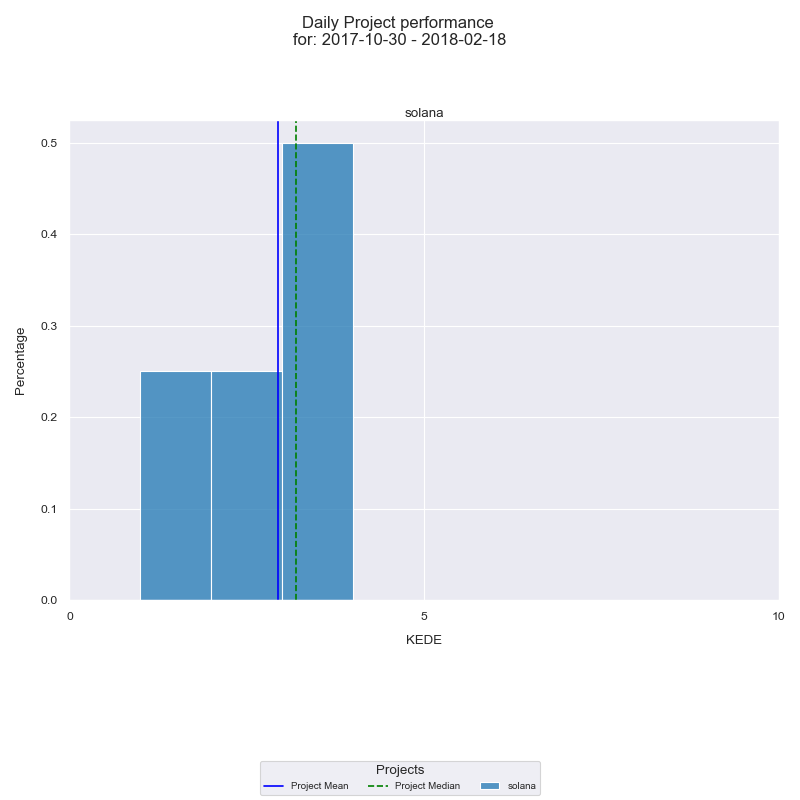
Along with the time series of your performance it's very useful to see a histogram.of the underlying frequency distribution. A frequency distribution shows how often each different value in a set of data occurs. The diagram below presents the histogram of Daily KEDE values for the selected period.
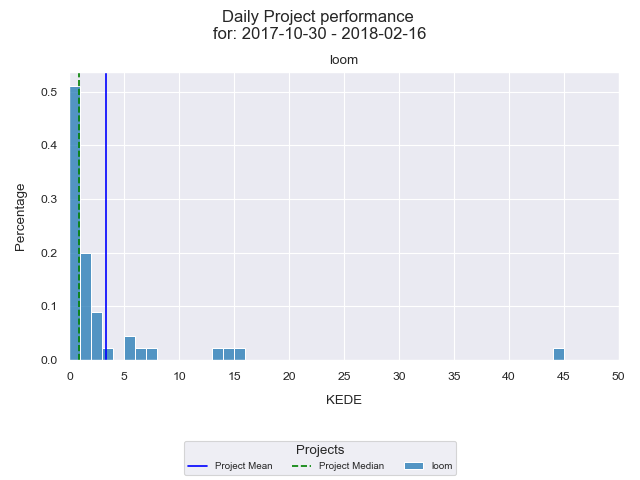
On the x-axis we have the Daily KEDE. On the y-axis we have the percentage of each particular value. First of all we are interested in the organization's summarized historical performance. That is presented by the dark blue vertical line which is the average Daily KEDE for the project for the selected period. The median Daily KEDE for the selected period is presented by the green vertical dashed line. We see that the average Daily KEDE is less than 4, even though the maximum value is 40 (the copied Intel code).
Let's check the difference in the average Daily KEDE and Weekly KEDE.
Below is the histogram of Daily KEDE.
We see that the average Daily KEDE for the selected period is almost 3.
Now we can look at the histogram for Weekly KEDE for the selected period.
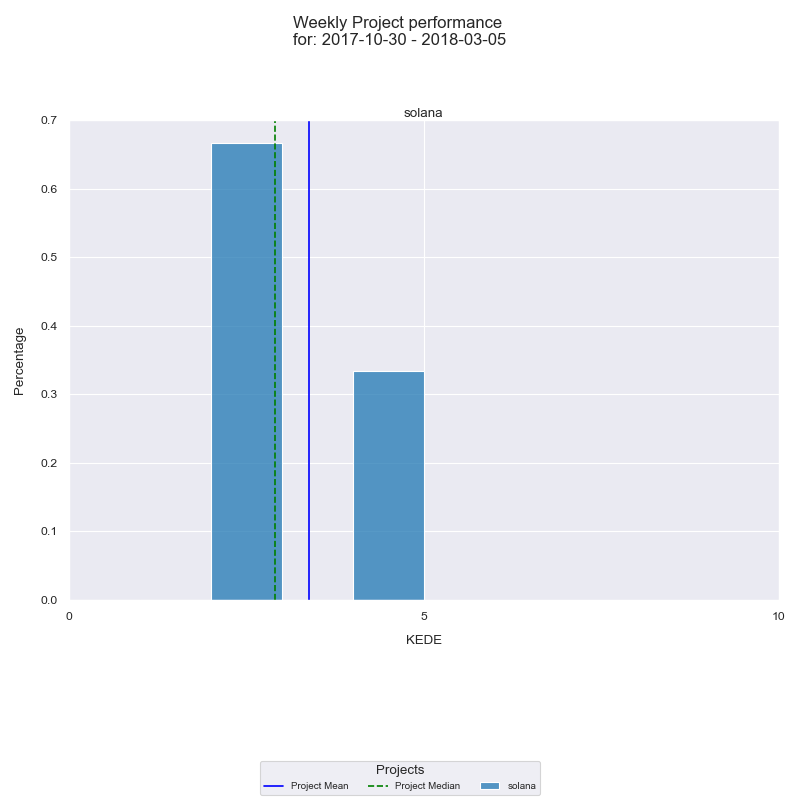
We see that Weekly KEDE for the same period is 2.35.
There is a difference between average Daily KEDE and Weekly KEDE. It is expected because both are aggregated in a different way. Weekly KEDE is calculated only for 5 days. That means if a developer worked 7 days then there will be a difference between average Daily KEDE and Weekly KEDE.
KEDE vs. number of developers
It is useful to know what impact the organization's size has had on its development capability.
We use the following procedure for an organizational unit and all of its projects:
- We first segment the history of the organizational unit into consecutive, non-overlapping windows of a certain size.
- For each productivity window we find the developers who have contributed and compute their total number
- After that, for each of the developers we aggregate their KEDE across all projects in the current productivity window.
Thus, for each productivity window we have:
- a list of all developers and for each developer their aggregated KEDE
- the number of developers who contributed
We can visualize the collected data as a time series and as a frequency chart.
As examples we shall look ate two diagrams wheres the result of the above procedure is applied to the case where:
- The organizational unit is a whole company
- the productivity window is a week with a size of 7 days. Thus, we will consider aggregated Weekly KEDE.
First a time-series.
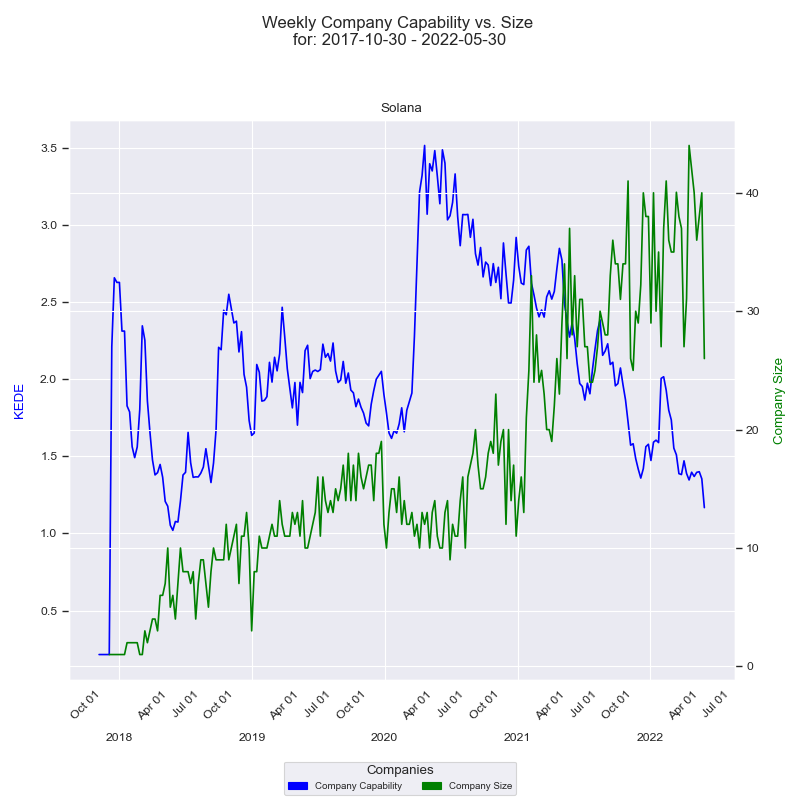
On the x-axis we have the quarter dates. Then we have two y-axises - one for the capability and one for the size of the company. Capability axis is to the left and is in Weekly KEDE values. How capability changes through time is presented by the dark blue line calculated using EWMA. Each point of the blue line is the average Weekly KEDE for all the developers who contributed in that week. Company size axis is to the right and is the number of developers who contributed to any of Solana projects in a given week. How company size changed through time is presented by the green line. Each point of the green line is the number of developers who contributed in a given week.
And then a frequency chart.
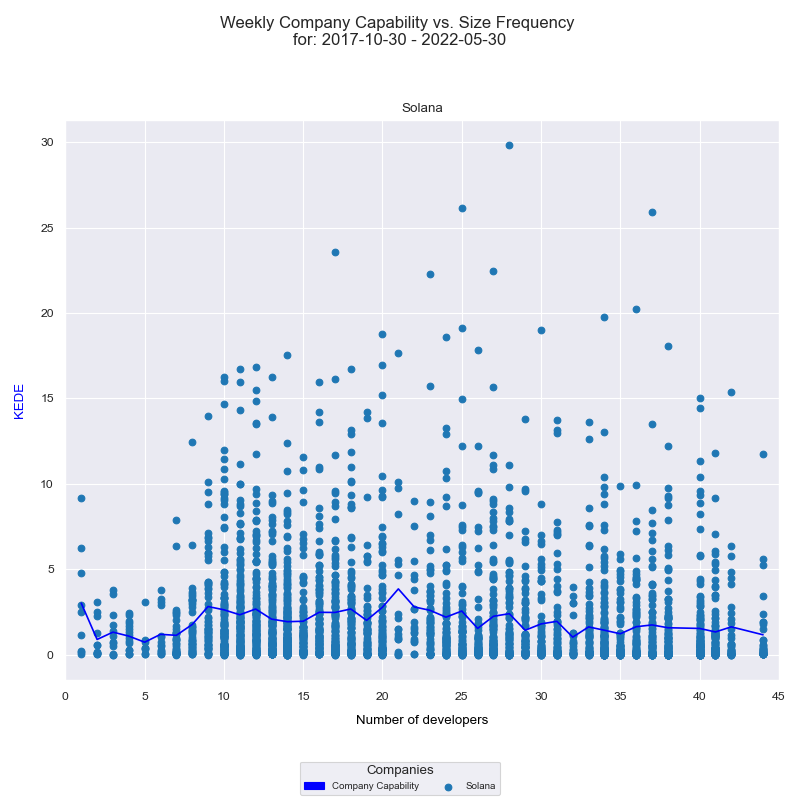
On the x-axis we have the number of developers who contributed to any of Solana projects in a given week. On the y-axis we have Weekly KEDE values. Each individual developer's aggregated Weekly KEDE is presented as a light blue dot on the diagram. The dark blue line is the average weekly KEDE for all developers calculated by arithmetic mean.
The first x-axis value is 1. For it there are six dots. Each dot is one contribution of the single developer who formed a team of one. Since we have six dots it means there were 6 weeks where the company size was of one contributing developer. There might have been more than one working, but only one contributed.
The last x-axis value is 44. We don't see at least 44 dots because they overlap.
For the x-axis values of 39 and 43 there are no dots. That means there wasn't a single week where 38 or 43 developers contributed.
References
1. C. Bird, P. C. Rigby, E. T. Barr, D. J. Hamilton, D. M. German and P. Devanbu, "The promises and perils of mining git," 2009 6th IEEE International Working Conference on Mining Software Repositories, 2009, pp. 1-10, doi: 10.1109/MSR.2009.5069475.
3. T. Ji, L. Chen, X. Yi and X. Mao, "Understanding Merge Conflicts and Resolutions in Git Rebases," 2020 IEEE 31st International Symposium on Software Reliability Engineering (ISSRE), 2020, pp. 70-80, doi: 10.1109/ISSRE5003.2020.00016.
5. M. Paixao and P. H. Maia, "Rebasing in Code Review Considered Harmful: A Large-Scale Empirical Investigation," 2019 19th International Working Conference on Source Code Analysis and Manipulation (SCAM), 2019, pp. 45-55, doi: 10.1109/SCAM.2019.00014.
6. S. W. Flint, J. Chauhan and R. Dyer, "Escaping the Time Pit: Pitfalls and Guidelines for Using Time-Based Git Data," 2021 IEEE/ACM 18th International Conference on Mining Software Repositories (MSR), 2021, pp. 85-96, doi: 10.1109/MSR52588.2021.00022.
7. Vladimir Kovalenko, Fabio Palomba, and Alberto Bacchelli. 2018. Mining file histories: should we consider branches? Proceedings of the 33rd ACM/IEEE International Conference on Automated Software Engineering. Association for Computing Machinery, New York, NY, USA, 202–213. https://doi.org/10.1145/3238147.3238169
8. --committer-date-is-author-date --ignore-date
9. "Fast SHA-256 Implementations on Intel® Architecture Processors"
Getting started


