Measuring Developer Work Experience
A Knowledge-centric approach
Related Articles
Abstract
Developer Experience (DevEx) is a relatively new concept that has gained significant attention in the software development world. It encompasses how developers feel about, think about, and value their work. This approach recognizes that developer productivity isn't just about the quantity of code produced or the speed of task completion, but rather it is influenced by a complex blend of factors, both technical and human[1].
DevEx focuses on software developers' emotions, thoughts, and work attitudes, influenced by Cognitive Load, Feedback Loops, and Flow State[1].
We introduce a novel metric KnowledgE Discovery Efficiency (KEDE) to quantify the knowledge gaps developers encounter when embarking on tasks. These knowledge gaps directly influence developers' experience, affecting their happiness, productivity, and overall satisfaction with their work.
In this article, we will explore how KEDE aligns with and can be used to measure these DevEx dimensions: Cognitive Load, Feedback Loops and Flow State. This comprehension will offer valuable insights into how KEDE can be used as an effective tool for implementing the DevEx approach in your organization.
Understanding Developer Experience (DevEx)
The concept of Developer Experience (DevEx) embodies the perceptions, values, and sentiments that developers harbor towards their work. It is influenced by more than 25 sociotechnical factors, such as interruptions, unrealistic deadlines, and friction in development tools that can negatively affect DevEx[1]. Conversely, clarity in tasks, well-structured code, and seamless releases can improve it. Human factors, like having clear project goals and feeling psychologically safe on a team, also have a substantial impact on developers' performance. Improving DevEx not only increases productivity but also boosts satisfaction, engagement, and employee retention.
Three Dimensions of DevEx
The framework distills developer experience into three core dimensions: feedback loops, cognitive load, and flow state:
- Feedback Loops: Shortening feedback loops, essentially the speed and quality of responses to actions executed, is crucial to improving DevEx. Fast feedback loops allow developers to complete their work quickly with minimal friction, while slow feedback loops interrupt the development process, leading to frustration and delays. Thus, organizations should strive to shorten feedback loops whenever possible.
- Cognitive Load: Developers' cognitive load corresponds to the mental exertion required to complete a task. High cognitive load due to problems like poorly documented code or systems requires developers to devote extra time and effort to complete tasks without errors. Minimizing cognitive load can bolster the developer experience (only up to a point, as we shall see later with KEDE). This can be accomplished by eliminating unnecessary roadblocks in the development process, crafting well-organized code and documentation, and offering easy-to-use, self-service tools.
- Flow State: Flow is a mental state in which a person performing an activity is fully immersed in a feeling of energized focus, complete involvement, and enjoyment. Frequent experiences of flow state at work lead to higher productivity, innovation, and employee development. Creating optimal conditions for flow state, like minimizing disruptions and creating positive team cultures that grant developers autonomy and challenging tasks, can improve developer experience.
Measuring DevEx
Measuring developer experience (DevEx) is crucial for identifying improvement opportunities, detecting trends, and understanding the impact of investments. Traditional approaches include gut feelings, direct feedback from developers, employee satisfaction surveys, and reverse engineering from flow metrics. Surveys are particularly useful for measuring DevEx and gathering feedback about friction points in the software delivery process.
Some organizations might reverse engineer from output metrics like velocity and throughput to assess whether developers enjoy their work experience. The underlying logic is: if we have good output metrics, then the input must also be good.
However, reverse engineering from output metrics overlooks the very heart of software development: the constant quest for acquiring and applying knowledge. True fulfillment in development isn't just about outputs and the code developers produced. It's about the joy of bridging knowledge gaps, understanding intricate challenges, and architecting solutions. Perhaps it's high time we start measuring the knowledge bridges developers build, not just the code they churn out? If we really want to know whether developers truly enjoy their work experiences, then we need metrics that gauge the knowledge gaps they bridge to deliver value.
That's actually what people refer to as "knowledge work" rather than the manual labor of writing source code.
In other words, knowledge work becomes necessary when there is a gap between required knowledge and prior knowledge. Bridging this gap involves discovering and applying new knowledge.
Efficient knowledge discovery is critical for unlocking the full potential of both individuals and teams, which naturally leads to high productivity. Furthermore, this efficiency in knowledge acquisition and application enhances the developer work experience and overall well-being
When individual capability significantly exceeds task complexity, the knowledge gap becomes too narrow, leading to wasted potential and boredom. On the other hand, if task complexity surpasses individual capability, the knowledge gap widens, leading to stress and low productivity. A well-balanced gap keeps developers in the Flow state, fully immersed and focused on their work, leading to higher productivity and job satisfaction.
This is the Knowledge-centric perspective on software development, treating knowledge as the fuel that drives the software development engine.
To truly understand whether developers enjoy their work experience and realize their full potential, we need to measure the knowledge gaps they bridge to complete their tasks. We can do that by using the Knowledge Discovery Efficiency (KEDE) metric.
Knowledge Discovery Efficiency (KEDE)
If we want to quantify the balance between individual capabilities and task complexity we can use Knowledge Discovery Efficiency (KEDE).
Imagine a scale: on one side is the required knowledge and on the other is the prior knowledge. They will be balanced if they are equal, implying that the knowledge to be discovered equals zero. When balanced, no further knowledge is needed; when imbalanced, knowledge acquisition is required.
This balance directly influences developers' efficiency, impacting their work experience and productivity.
KEDE functions much like a thermometer for an organization, observing it from the outside, akin to a black box. The mathematics underlying KEDE dictate that its values can range between 0 and 100.

- A KEDE near 0 indicates a significant knowledge gap or barriers to applying known solutions.
- A KEDE near 100 shows optimal preparation and application of prior knowledge.
- A typical expert software developer might score around 20, indicating a balance between using known methods and learning new ones.
KEDE can provide a reading of your organization's "temperature," but not diagnose the reason for a fever, so to speak. To understand the cause, organizations need a physician - someone who can delve inside the black box, like a manager or coach.
Using KEDE to measure the DevEx dimensions
KEDE can help you implement the DevEx framework in your organization, by providing you with objective values for the levels of Cognitive Load, Flow state and Feedback loops..
Using KEDE to Measure Cognitive Load
Cognitive load refers to the total amount of mental effort required for a task, such as software development[6]. Rooted in cognitive psychology, this concept is closely related to cognitive control[4], the processing capacity of the conscious mind, and working memory capacity[9][10][11][12][13].
The cognitive load can increase significantly when individuals are presented with a large number of options, a phenomenon known as "choice overload" or the "paradox of choice."[14][15][16]. This leads to hindered decision-making and a reduced likelihood of selecting rational and objective options[7][8].
To quantify how a large number of options affects cognitive load, we can consider the "search space" of options contributing to the "perplexity" of the decision task. The larger the search space (i.e., the more options there are), the higher the perplexity, and the more cognitive resources are required to make a decision. This can increase cognitive load and potentially lead to choice overload.
In this context, perplexity might be thought of as a measure of the search space i.e. average number of possible states, in the sense that a more complex or difficult task might have a greater number of possible states or options to consider, which might increase the feeling of uncertainty or confusion. For example, if one is trying to find a specific item in a large room or warehouse, the search space would be the number of potential locations where the item could be found.
To quantify perplexity, we need to know how many options a software developer sees when looking at a work item before starting the work. This task can be challenging, if not impossible, since it involves understanding the individual's thought process!
Knowledge Discovery Efficiency (KEDE) measures the discovered knowledge. From KEDE, we can assess the perplexity a software developer experienced while working.
Recall that when we have n equally sized boxes the average number of questions needed to find the coin location is. Thus, by using KEDE, we can quantify in bits of information the cognitive load a software developer experienced while working.
Taking into consideration how KEDE correlates with perplexity, we can say that::
For instance, if a knowledge worker has KEDE=100, it means she had to find a coin in only one box.
This situation reflects a perplexity of 1, indicating there was only one possible answer to the question: "Where is the gold coin?" This is the minimum value.
However, if a knowledge worker has KEDE=20, it implies she had to find a coin among 16 boxes, indicating a tolerable perplexity level.
But if a knowledge worker had KEDE=1, equivalent to answering 99 binary questions, it means she had to find a coin among approximately 6.3x1029 boxes!
To contextualize, there are an estimated 1022 to 1024 stars in the Universe[5]. The number of boxes was significantly greater than the number of stars in the Universe! We can infer that the software developer faced an exceedingly high level of perplexity.
Practical examples of KEDE being used to measure cognitive load
Assessing a developer's cognitive load involves examining their it over time. The following diagram depicts a developer's weekly cognitive Load over a selected period across all projects.
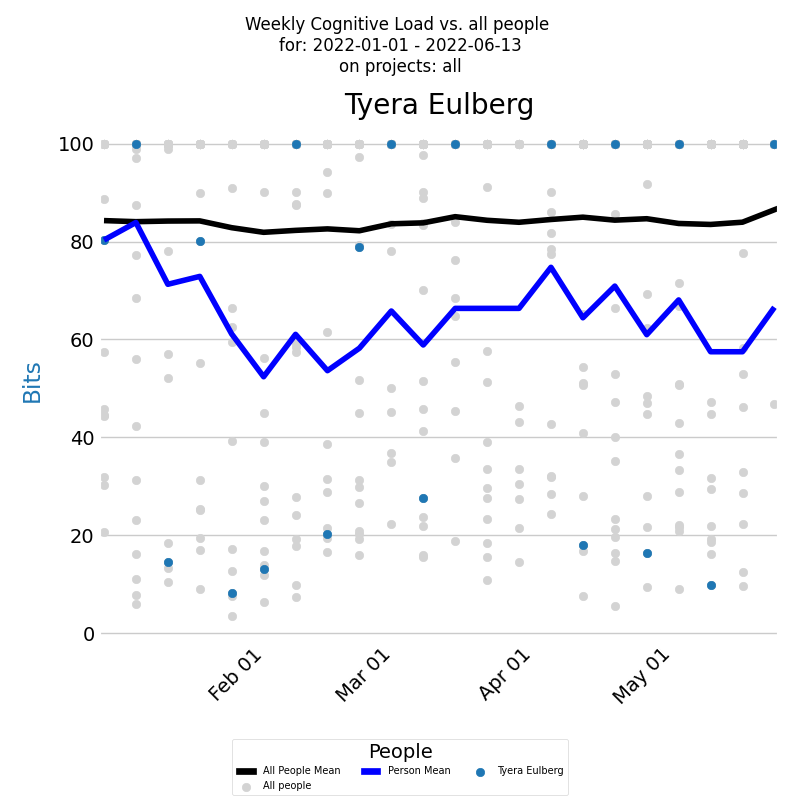
The x-axis shows the week weeks, and the y-axis denotes weekly cognitive Load values. The blue dot for each week represents a developer's cognitive Load. The dark blue line signifies a developer's average weekly cognitive Load. Comparisons with the company average can be made by examining cognitive Load for all contributing developers during this period, depicted by light gray dots. The black line signifies these developers' average weekly cognitive Load.
Examining the frequency distribution of a developer's averaged cognitive Load over time can be informative. A histogram, as shown below, can illustrate this distribution.
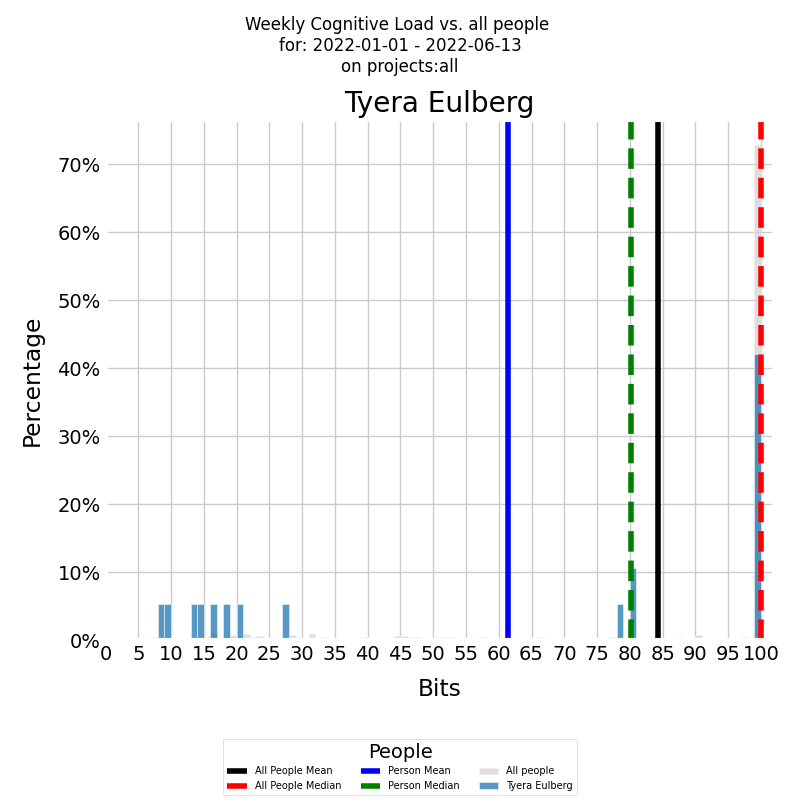
The x-axis displays the weekly KEDE, while the y-axis shows the frequency of each specific value. The colored histogram represents the developer's cumulative cognitive Load. The blue vertical line denotes the developer's average weekly cognitive Load for the selected period, while the green dashed line indicates the median weekly cognitive Load.
Both diagrams show that there were weeks, with a KEDE=10, when the selected developer experienced a cognitive load equivalent to searching in just 512 boxes. However, the developer's capability typically ranged between 2 and 4. This suggests that their cognitive load was akin to searching through approximately 16,777,216 boxes. Even though this cognitive load is considerable, it's still much lower compared to the average load within the company, where KEDE=1 corresponds to a number of boxes that exceeds the total number of stars in the Universe! Furthermore, the company's median cognitive Load is less than 0.5, indicating that half of the time, the cognitive load was intolerable!
As an initial measure, it would be beneficial to examine why the selected developer has a significantly better work experience than the rest of the company. Directly asking the developer could be a good approach, but for a deeper understanding of a developer's knowledge discovery efficiency, one should analyze its distribution across various projects. The diagram below shows a stacked bar chart of the developer's weekly efficiency divided by projects during a selected period.
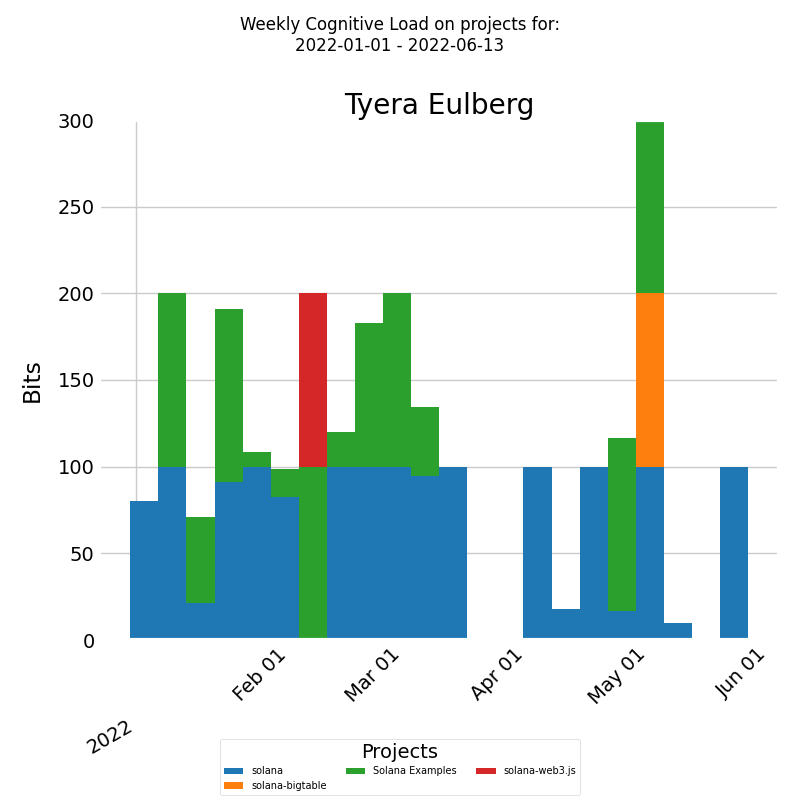
The x-axis denotes week dates and the y-axis indicates weekly cognitive Load. Each bar represents a week's cognitive Load for the developer, divided into segments according to the proportion of weekly cognitive Load for each project.
For this specific developer, their cognitive load appears to remain constant, regardless of the project. As a result, it may be necessary to conduct a comprehensive examination of the company as a whole to pinpoint patterns or trends affecting their job satisfaction.
In response, we recommend that the company's leadership investigate the factors contributing to such extreme cognitive loads for the average developer. Based on my experience as an engineering manager, these factors could include insufficient training, prolonged feedback loops, unclear requirements, etc.
Using KEDE to Measure Flow State
As software development is a highly cognitive and mentally demanding activity, it's important to understand how to measure the happiness of developers. A state of "flow" is a key indicator of optimal experience and happiness in work.
Flow states are commonly referred to in many ways in society, such as "wired in," "in the groove," "in the moment," and "the zone."
Quantifying Flow State
To ascertain whether developers achieve a state of Flow, it's essential to assess the presence of three key conditions: a clear and attainable goal, a balance between skill level and challenge, and clear and immediate feedback. Assessing these conditions in real-time, as a developer works on a task, is impractical due to the inaccessibility of the developer's cognitive process.
However, a post-task completion analysis offers a viable alternative, as all three Flow conditions are intricately linked to knowledge[17[18]. Specifically:
- Goals: Understanding the task involves knowing what to do, how to do it, and the next steps to take.
- Skill and Challenge Balance: This is about the knowledge a developer possesses versus what they need to know to complete tasks effectively.
- Feedback: This pertains to recognizing the correctness of actions and making necessary adjustments.
This knowledge is categorized into two types: 'prior knowledge' (what the developer already knows) and 'required knowledge' (what the developer needs to know for the task). The 'knowledge gap' is the difference between these two, measured in bits. Therefore, measuring the knowledge acquired post-task can indicate whether the developer was in a state of Flow. We quantify this knowledge gap in bits of information, allowing us to measure the knowledge to be discovered. This approach facilitates meaningful comparisons across different contexts, programming languages, and applications.
The Knowledge Discovery Efficiency (KEDE) metric is employed for this purpose, as explained in details here..

KEDE is calculated for each developer individually and signifies the knowledge that they lacked before beginning the task. A low KEDE score implies that the developer did not possess the requisite knowledge to tackle the task, while a high KEDE score suggests that the developer was adequately prepared.
Typically, values less than 50 point towards an imbalance leaning towards anxiety, indicative of overly challenging tasks. Conversely, values over 50 suggest an imbalance towards boredom, where tasks are not sufficiently challenging. An ideal state of Flow is indicated by a KEDE value of 50, representing a perfect balance.
Interestingly, KEDE measurements propose a somewhat counterintuitive relationship between efficiency and developer happiness. The most efficient developers, those who require less discovery of new knowledge, may also be the ones who are most prone to boredom.
Imagine a scale: on one side is the required knowledge and on the other is the prior knowledge. They are in balance when the knowledge to be discovered equals one bit, with balance values ranging from 0 to 1.
For practicality, we express this balance as a percentage. For instance, a 40% balance suggests that the developer is 60% away from achieving Flow.
Practical examples of KEDE being used to measure happiness
Consider the time-series diagram below, which illustrates developer's happiness for a selected period across all projects.
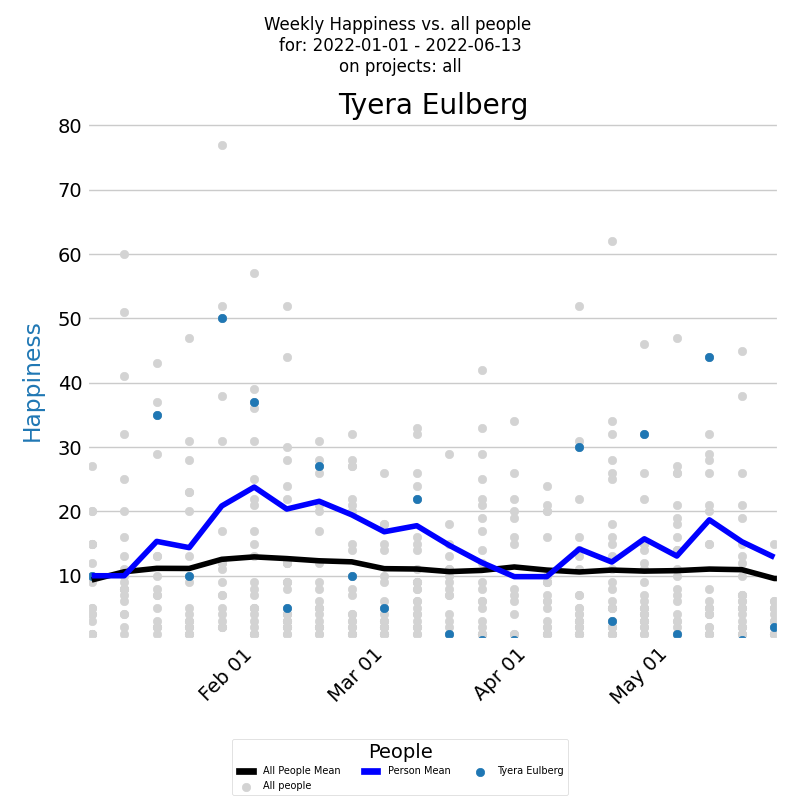
The x-axis of the diagram displays the dates of each week, while the y-axis shows the weekly happiness values. Each week's happiness level is represented by a blue dot on the diagram, giving you a clear visual representation of how the developer's happiness changes over time. Additionally, the dark blue line on the diagram represents the average weekly happiness for the developer, calculated using the Exponentially Weighted Moving Average (EWMA) method. By analyzing this line, you can gain a better understanding of the overall trend of the developer's happiness levels over time. But to gain a deeper understanding of a developer's happiness levels, it's important to compare them with the company averages. Each individual developer's weekly happiness is represented by a light gray dot, while the average weekly happiness calculated using EWMA is represented by a black line.
The time-series diagram reveals that the selected developer's average happiness levels consistently outpace the company's average, Interestingly, their happiness peaks at specific moments, ike a roller-coaster over time. Contrastingly, the company-wide data exposes a concerning pattern: a majority of developers experience their work in a state of anxiety, rather than happiness.
Along with the time series of the happiness it's very useful to see a histogram of weekly averaged happiness values, which displays the frequency distribution of happiness values over a selected period. The histogram below presents the weekly happiness values for a selected period, with the x-axis displaying the Weekly happiness and the y-axis showing the percentage of each particular value.
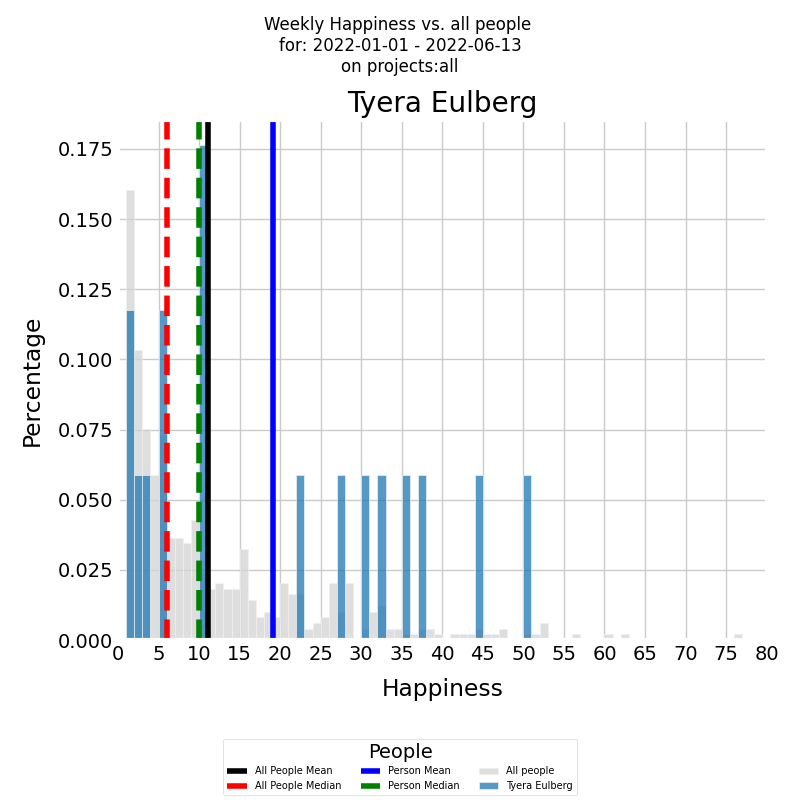
The histogram is presented in color for the developer, with the blue vertical line representing the average weekly happiness level for the selected period and the green vertical dashed line representing the median weekly happiness level. To gain a deeper understanding of the developer's happiness levels, it's important to compare them with the company averages. The same histogram can be generated for all other developers who contributed to all other company projects during the selected time period, with the histogram presented in gray. The black vertical line represents the average weekly happiness level for all other developers, while the red vertical dashed line represents the median weekly happiness level.
The diagram illustrates that the selected developer's average happiness levels are double the company's average. Interestingly, their happiness isn't concentrated at a single point but rather distributed uniformly across the spectrum. The company histogram, on the other hand, reveals a concerning pattern: most developers experience their work in a state of anxiety.
To gain insights into how a developer's mood is influenced by their work environment, we can examine the distribution of their happiness across different projects. The diagram below presents a stacked bar chart that allows you to look at numeric values across two categorical variables. The first category is the developer's weekly happiness, and the second category is the projects that the developer worked on during the selected time period. Each bar on the chart represents the weekly happiness of the selected developer, divided into a number of boxes, each one corresponding to the happiness that the developer felt on a particular project.
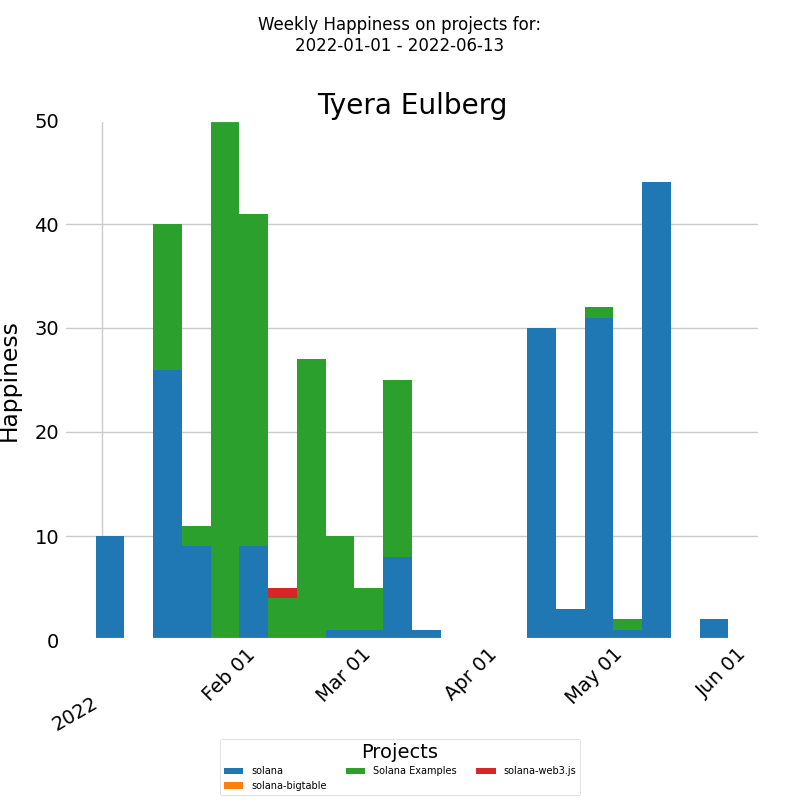
The x-axis of the chart displays the dates of each week, while the y-axis shows the weekly happiness levels. For this particular developer, their mood seems unaffected by the nature of the project, be it represented in green or blue. Thus, a holistic review of the entire company as a system may be necessary to identify patterns or trends impacting their happiness.
To address this, we suggest a two-pronged approach: First, investigate what factors contribute to the higher happiness levels of the selected developer and aim to replicate those conditions for the rest of the team to alleviate their anxiety. Secondly, identify periods when even the usually happy developer experienced anxiety, and work towards creating a more consistent and positive working environment. It's possible that addressing a single issue could alleviate both undesirable effects.
Using KEDE to Measure Feedback Loops
Shortening feedback loops is a common goal in many software development methodologies, such as Agile and DevOps, as it leads to faster detection of issues, quicker implementation of changes, and overall improved efficiency.
Collaboration involves the active engagement of multiple individuals or teams to achieve a common goal. It allows the sharing of unique perspectives, experiences, and skills, thereby facilitating a more diverse and comprehensive problem-solving approach. In software development, for example, collaboration could involve developers, testers, designers, project managers, and clients working together to deliver a successful product.
Collaboration and feedback loops are interconnected, each influencing and enhancing the other in a kind of virtuous cycle, as explained here. Effective collaboration leads to shorter, more efficient feedback loops, and efficient feedback loops enhance the effectiveness of collaboration. This cycle, when facilitated and managed properly, can greatly enhance team productivity and the overall quality of the end product or service.
Collaboration can be measured
Software development is a complex process that requires the collaboration of multiple team members. Measuring the efficiency of this collaboration, however, is not straightforward. It's a multifaceted task that can't be reduced to a single metric.
There are tools available that, from 'inside the black box', measure the efficiency of practices— such as Continuous Integration/Continuous Deployment (CI/CD), Pair Programming, and Code Reviews— that are designed to facilitate and enhance collaboration and shorten feedback loops in software development. However, it's also crucial to remember that it's both possible and valuable to gauge the effectiveness of collaboration from outside this 'black box'.
One way to do this is by examining the efficiency of information acquisition in relation to the number of active contributing software developers.
The number of contributing developers can be determined by counting those actively participating in a project over a certain period of time.
The efficiency of information acquisition, on the other hand, can be understood in terms of how rapidly and effectively missing information is acquired and integrated into the team's work. This can be reflected in the time taken to incorporate missing information, the completeness or accuracy of the understanding of new information, and the impact of the new information on the team's productivity or the quality of their output.
Missing information can be acquired from two types of sources[19]:
- Personal Sources: Those that communicate information personally including insights, experiences, and skills of team members. When people collaborate, they share and combine their knowledge, skills, and experiences, leading to a more effective problem-solving process and achievement of shared goals. In this sense, collaboration amplifies individual contributions by creating a collective intelligence that exceeds the sum of its parts.
- Impersonal Sources: These are non-human sources that communicate information to broad audiences, including books, research papers, digital databases, API documentation, StackOverflow responses, coding libraries, and online audio and video. This type of information is vital as it provides a broader, often more objective viewpoint, and can provide data and insights that may not be available within the collaborating group.
In a well-functioning collaborative environment, both personal and impersonal sources of information are considered and used to acquire knowledge, solve problems, and make informed decisions. It's important to note that when we measure the efficiency of information acquisition, we are considering both these categories of sources. This means we account for all channels through which new information can be gained, thereby providing a comprehensive view of the organization's level of efficiency of information acquisition.
Knowledge Discovery Efficiency (KEDE) is a metric that can be used to measure the efficiency of information acquisition in software development. We will refer to an organization's efficiency of information acquisition as its 'capability.'
Practical examples of KEDE being used to measure feedback loops
Consider the time-series diagram below, which illustrates the interplay between an organization's size and its capability over time.
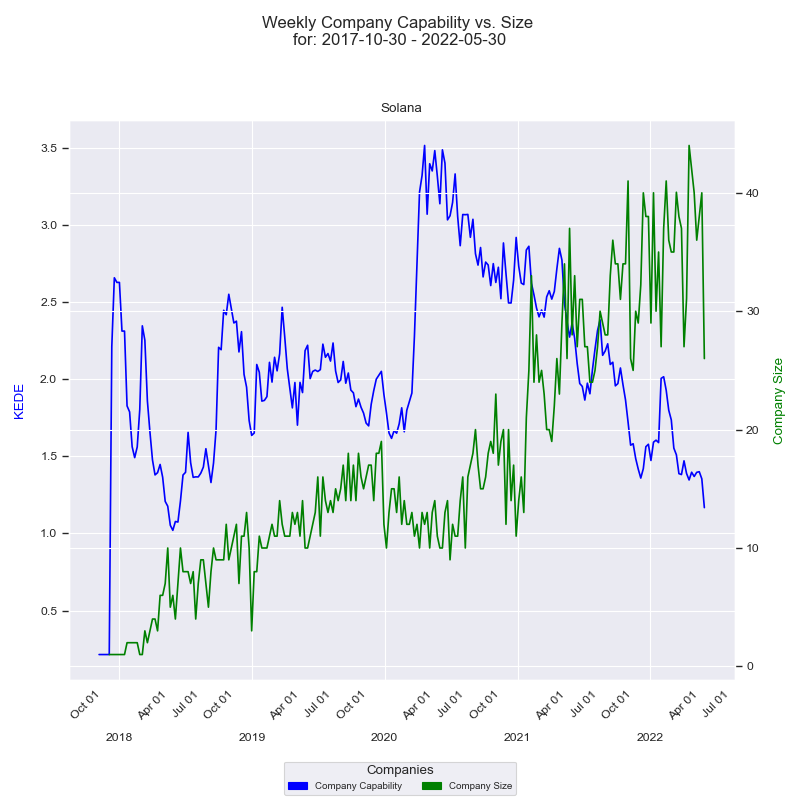
The x-axis represents the quarters, while the y-axis on the left displays the 'capability' in terms of Weekly KEDE values. The dark blue line in the diagram represents the average Weekly KEDE for all developers who contributed to the company's projects in a given week, calculated using Exponential Weighted Moving Average (EWMA). This line offers a visual representation of how the organization's capability fluctuates over time.
The right y-axis showcases the size of the company, depicted by the number of developers who contributed to the company's projects in a given week. The green line represents the company's size over time, with each point marking the count of contributing developers for that week. A detailed construction of the diagram can be found here.
The diagram displays a notable period where there is an inverse correlation between the company's size and its capability. Over the span of more than two years, the company size surged from 20 to 44, a substantial 120% increase. Conversely, during the same period, the capability steadily declined from 3.6 to 1.3, indicating a 64% decrease. The diagram illustrates a trend wherein the efficiency of information acquisition decreases as the number of contributing software developers increases.
Another way to visualize the relationship between the efficiency of information acquisition and the number of developers is through a histogram. This chart shows the frequency distribution of the company's 'capability' against the number of contributing developers over time.
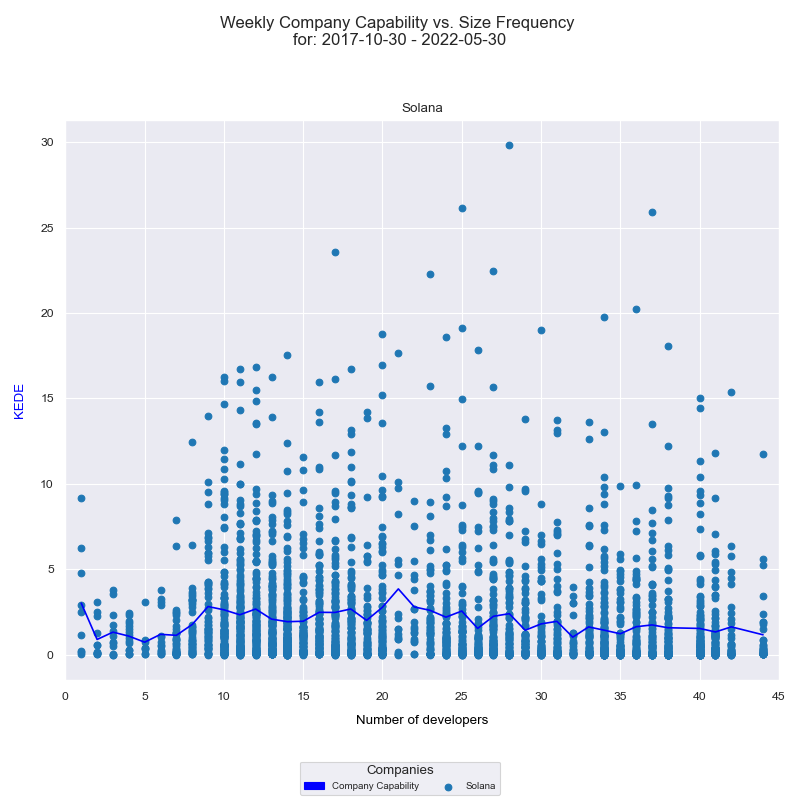
The x-axis displays the number of developers who contributed to any of the projects in a given week, while the y-axis represents the weekly KEDE values. Each individual developer's aggregated Weekly capability is presented as a light blue dot on the diagram, while the dark blue line represents the average weekly capability for all developers calculated by arithmetic mean. A detailed explanation of how this diagram was constructed can be found here. Analyzing this histogram, we once again observe that the efficiency of information acquisition tends to decrease as the number of contributing software developers increases.
Interpreting these two diagrams together, we might suggest potential issues with the level of collaboration in the organization. Challenges could arise in terms of communication, coordination, knowledge silos, individual contribution, or even information overload. While more contributors are generally beneficial, managing the complexity requires effective strategies, clear communication, and robust systems. However, it's crucial to remember that we are observing these trends from 'outside the black box'. The actual cause could be a combination of these factors, or even something entirely different. A more accurate understanding would require 'looking inside the box' to ascertain the underlying reasons.
Conclusion
Throughout this article, we delved into the multifaceted domain of Developer Experience (DevEx), exploring its central dimensions: Feedback Loops, Cognitive Load, and Flow State. Acknowledging the importance of human factors in software development, we presented a new way of enhancing DevEx through the utilization of the KnowledgE Discovery Efficiency (KEDE) metric.
KEDE, by quantifying the knowledge gap that developers need to bridge while undertaking tasks, allows us to calculate the cognitive load involved in software development assignments. It provides a reliable measure of the balance between individual capability and work complexity. By monitoring the discovered knowledge after successful work completion, we can effectively measure whether developers are in a flow state, or instead, if they are encountering too much anxiety or boredom in their tasks.
Furthermore, KEDE also measures the efficiency of information acquisition in relation to the number of active contributing software developers. It facilitates a clearer understanding of how rapidly and effectively new information is assimilated and employed in the team's work. It offers an indirect way to assess the speed of the feedback loops, thereby promoting efficient collaboration.
The implementation of KEDE in a software development environment has the potential to significantly enhance DevEx. By offering insights into the cognitive load developers face and their state of flow, it can aid in optimizing development processes and task allocation, thus improving overall satisfaction, engagement, and productivity of developers. By providing a measure of information acquisition efficiency, KEDE can also contribute to enhancing team collaboration and performance.
However, despite these promising advancements, there remains room for further exploration and improvement in this field. Software development is a complex and ever-evolving landscape. We urge organizations and teams to continue seeking innovative ways to enhance DevEx. The use of KEDE and similar metrics should be considered a part of an ongoing journey to better understand and improve the conditions that foster productivity, satisfaction, and overall happiness among software developers. As the adage goes, a happy developer is a productive developer, and KEDE provides us with another tool to realize this goal.
Works Cited
1. Abi Noda, Margaret-Anne Storey, Nicole Forsgren, and Michaela Greiler. 2023. DevEx: What Actually Drives Productivity: The developer-centric approach to measuring and improving productivity. Queue 21, 2, Pages 20 (March/April 2023), 19 pages. https://doi.org/10.1145/3595878
2. Bakardzhiev, D., Vitanov, N.K. (2025). KEDE (KnowledgE Discovery Efficiency): A Measure for Quantification of the Productivity of Knowledge Workers. In: Georgiev, I., Kostadinov, H., Lilkova, E. (eds) Advanced Computing in Industrial Mathematics. BGSIAM 2022. Studies in Computational Intelligence, vol 641. Springer, Cham. https://doi.org/10.1007/978-3-031-76786-9_3
3. Bakardzhiev, D. V. (2022). U.S. Patent No. 11,372,640. Washington, DC: U.S. Patent and Trademark Office. Online: https://scholar.google.com/scholar?oi=bibs&hl=en&cluster=3749910716519444769
4. Wu, T., Dufford, A. J., Mackie, M. A., Egan, L. J., & Fan, J. (2016). The Capacity of Cognitive Control Estimated from a Perceptual Decision Making Task. Scientific Reports, 6, 34025.
5. How many stars are there in the Universe? (n.d.). Retrieved January 11, 2022, from https://www.esa.int/Science_Exploration/Space_Science/Herschel/How_many_stars_are_there_in_the_Universe
6. Sweller, J. 1988. Cognitive load during problem solving: effects on learning. Cognitive Science 12(2), 257–85; https://onlinelibrary.wiley.com/doi/abs/10.1207/s15516709cog1202_4.
7. Besedeš, T., Deck, C., Sarangi, S., & Shor, M. (2015). Reducing choice overload without reducing choices. Review of Economics and Statistics, 97(4), 793-802.
8. Deck, C., & Jahedi, S. (2015). The effect of cognitive load on economic decision making: A survey and new experiments. European Economic Review, 78, 97-119.
9. Miller, G. A. The magical number seven, plus or minus two: some limits on our capacity for processing information. Psychol Rev 63, 81 (1956).
10. Vogel EK, Machizawa MG. Neural activity predicts individual differences in visual working memory capacity. Nature. 2004 Apr 15;428(6984):748-51. doi: 10.1038/nature02447. PMID: 15085132.
11. Fukuda K, Vogel E, Mayr U, Awh E. Quantity, not quality: the relationship between fluid intelligence and working memory capacity. Psychon Bull Rev. 2010 Oct;17(5):673-9. doi: 10.3758/17.5.673. PMID: 21037165; PMCID: PMC3050565.
12. Unsworth N, Fukuda K, Awh E, Vogel EK. Working memory and fluid intelligence: capacity, attention control, and secondary memory retrieval. Cogn Psychol. 2014 Jun;71:1-26. doi: 10.1016/j.cogpsych.2014.01.003. Epub 2014 Feb 14. PMID: 24531497; PMCID: PMC4484859.
13. Cowan, N. (2001). The magical number 4 in short-term memory: A reconsideration of mental storage capacity. Behavioral and Brain Sciences, 24(1), 87-114. doi:10.1017/S0140525X01003922
14. Levitin, D. J. (2015). The Organized Mind: Thinking Straight in the Age of Information Overload (Illustrated edition). Dutton.
“120 bits per second This estimate derives independently from Csikszentmihalyi (2007) and the Bell Labs engineer Robert Lucky, who made an independent estimate that regardless of the modality, the cortex cannot take in more than 50 bits/second—within an order of magnitude of Csikszentmihalyi’s. Csikszentmihalyi explains his estimate: “As George Miller and others have suggested, we can process 5–7 bits of information in one apperception; each apperception takes at least 1/15th of a second; hence 7 × 15=105 bits/second. Nusbaum has calculated that understanding verbal material takes on the average 60 bits/second.”
15. Greifeneder, R., Scheibehenne, B., & Kleber, N. (2010). Less may be more when choosing is difficult: Choice complexity and too much choice. Acta Psychologica, 133, 45-50. doi:10.1016/j.actpsy.2009.08.005
16. Schwartz, B., & Schwartz, B. (2004). The paradox of choice: Why more is less.
17. Schaffer, O. 2013. Crafting Fun User Experiences: A Method to Facilitate Flow. Human Factors International Whitepaper. Retrieved from: https://scholar.google.com/scholar?cluster=9760324565241258858
18. Csikszentmihalyi, M. & Nakamura, J. (2010). Effortless Attention in Everyday Life: A Systematic Phenomenology . In Bruya, B. (Ed.), Effortless Attention. (pp. 179- 190). Cambridge, MA: MIT Press.
19. Choo, C. (1994). Perception and use of information sources by chief executives in environmental scanning, Library & Information Science Research, Volume 16, Issue 1
How to cite:
Bakardzhiev D.V. (2023) Measuring Developer Work Experience: A Knowledge-centric approach https://docs.kedehub.io/kede-manage/kede-devex.html
Getting started


