Improve productivity and happiness on a software development project
Establish an iterative process for accumulation of knowledge.
Abstract
"All software is simply a representation of knowledge and it is the acquisition of this knowledge that is the real activity of software development." ~ Phillip Glen Armour [12]
The goal of this article is to help the leaders of software development organizations improve their productivity and make developers happy. For that we will put on the lens of Information theory to differentiate between knowledge discovery and knowledge application in defining an effective software development process. The primary purpose of this process is to show us where we have lack of knowledge. Not only to show us what we know and what we know we don't know as much as to show us what we don't know we don't know. We acknowledge that the true role of the development process is to acquire knowledge, and the most valuable knowledge is knowledge we do not already have[12]. Armed with the new understanding we'll take an end-to-end view on the way we manage a software development project.
After that, all the way through the project, day by day, we should be investing effort to identify the knowledge gaps about which we feel most perplexed and how that perplexity is hampering our project the most. What could we do to identify and reduce our perplexity most rapidly? Ideally we want to create as steep a descent as possible for each axis on the curve of reducing perplexity,
Finally, we will show how to integrate the knowledge discovery process into the overall project delivery. We can do that using the Kanban[6] method and especially Ustream Kanban[7].
How could we know if our efforts at increasing our knowledge are successful? By using all the reporting functionality KEDEHub provides us with. We can check the results on a daily basis if needed. The best is to check on a weekly basis and report every Monday.
Flow
“A bad system will beat a good person every time.” —W. Edwards Deming
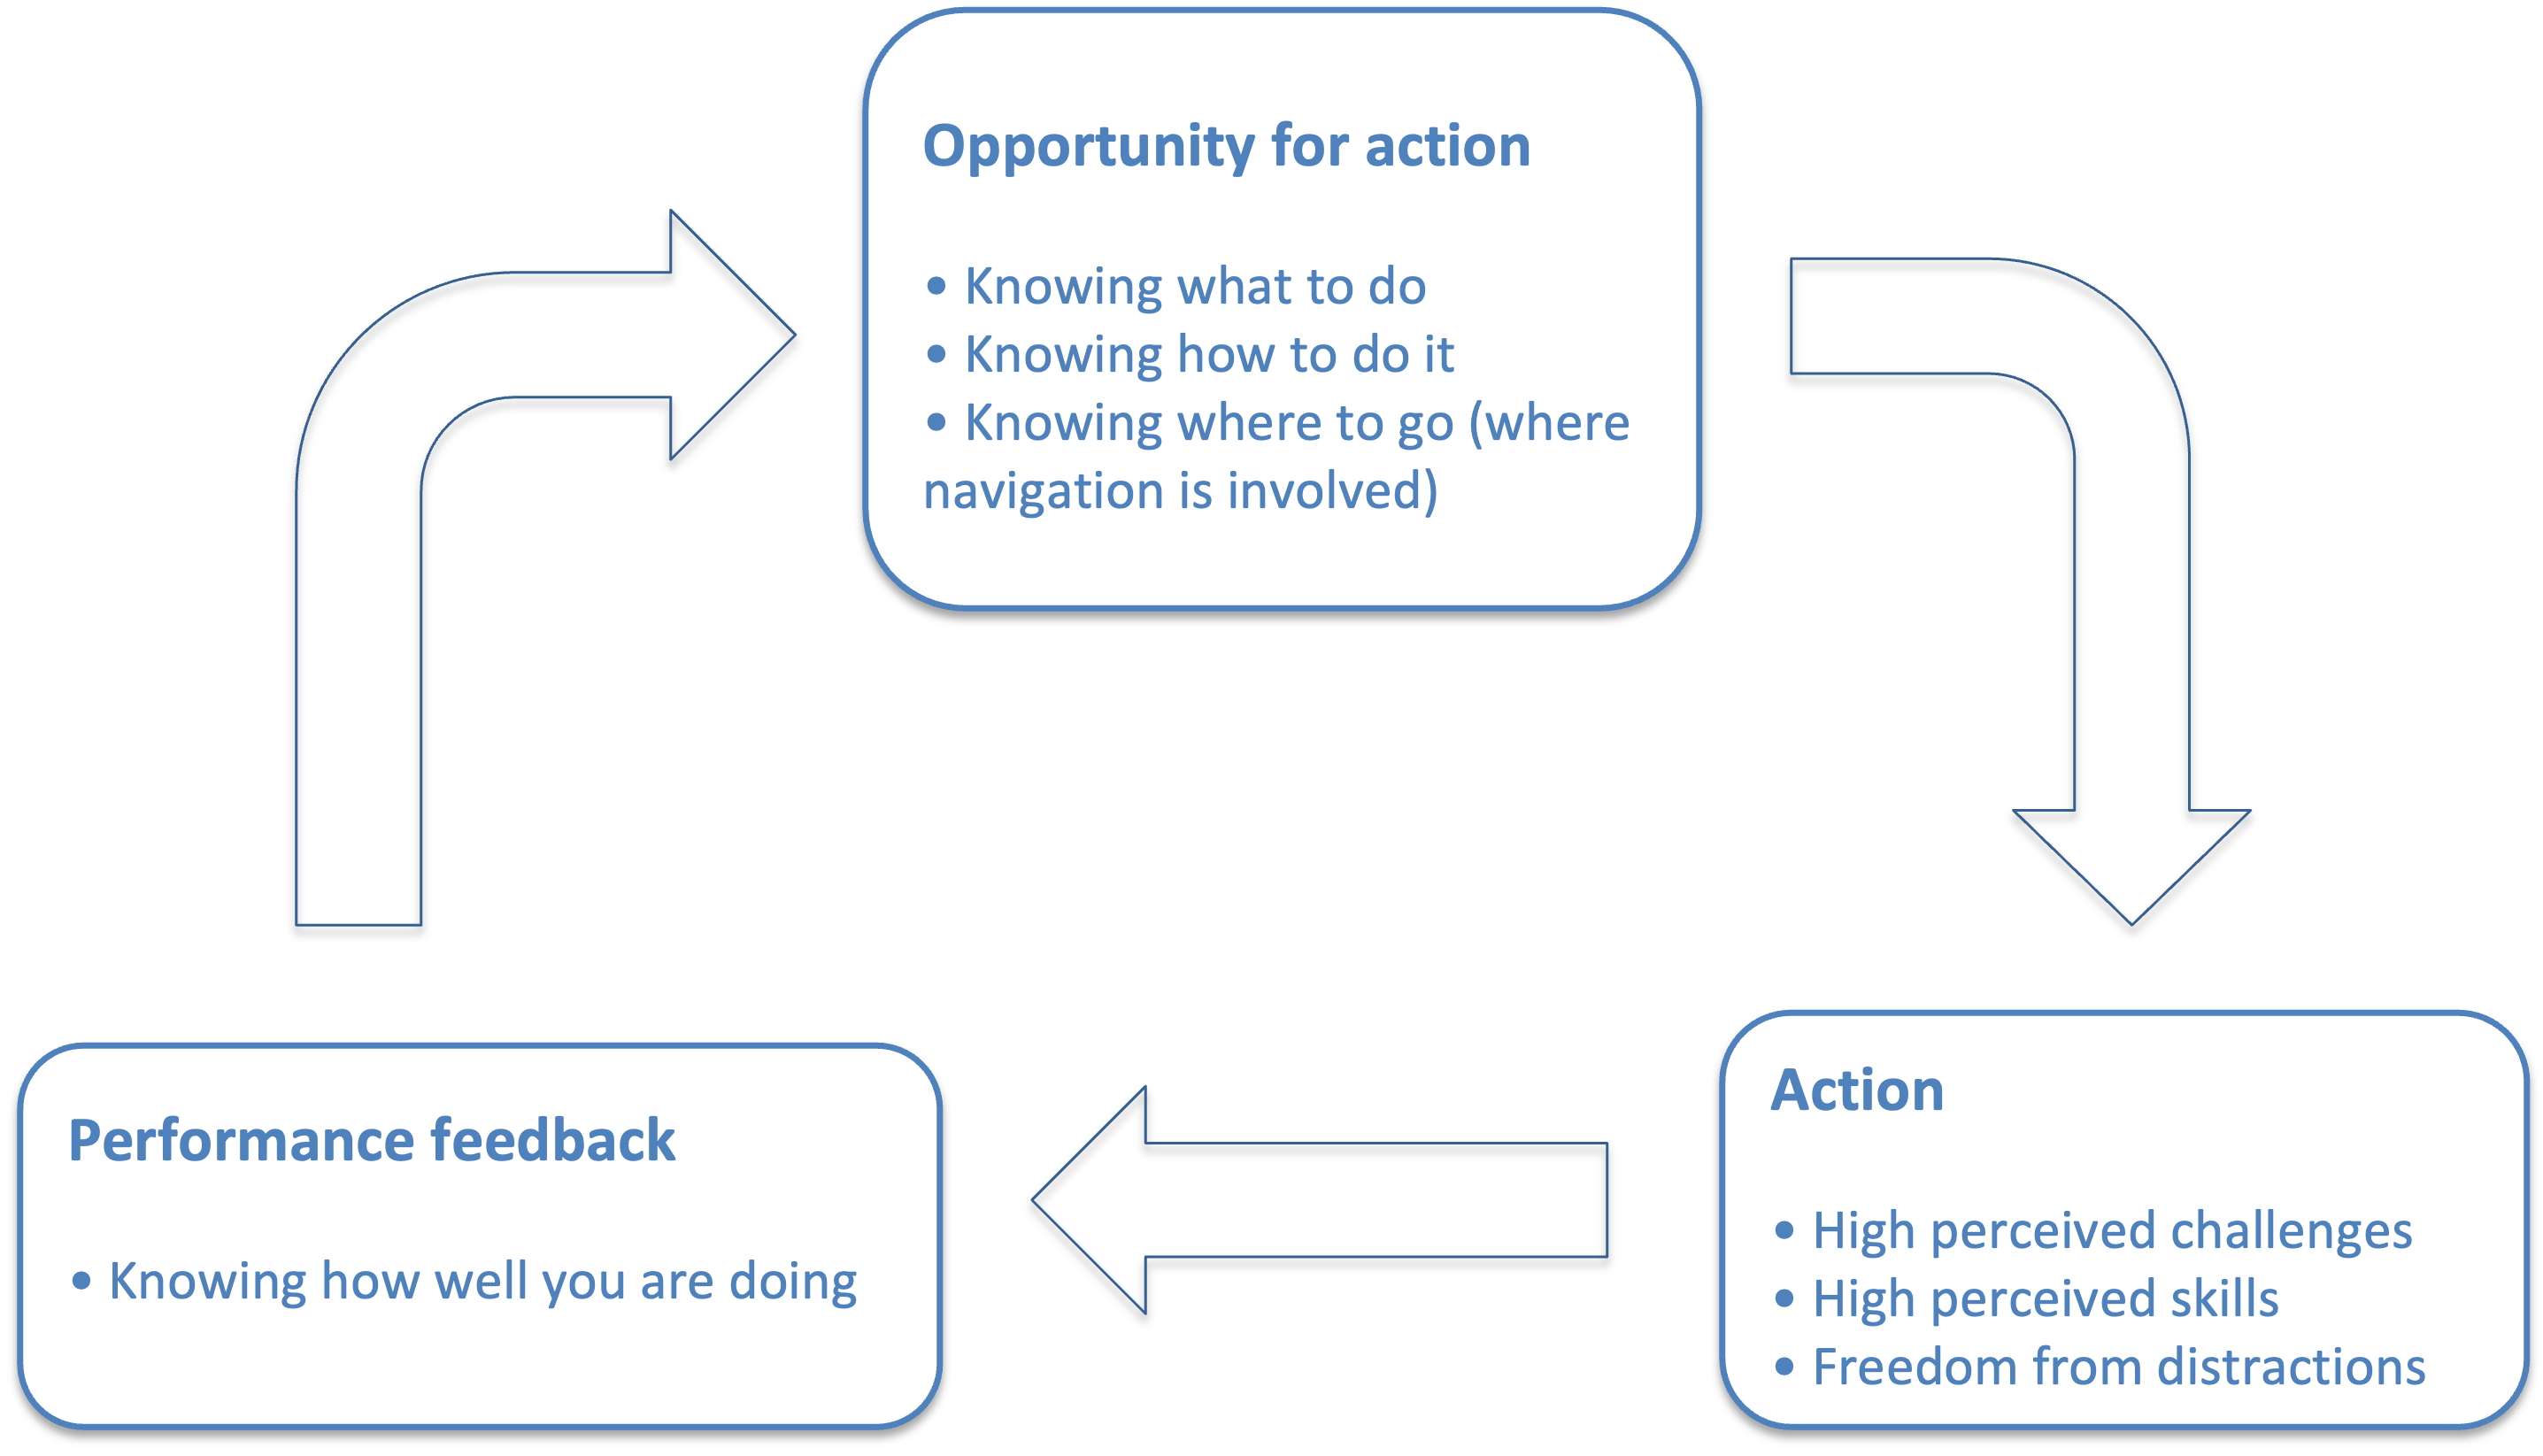
People in general and software developers in particular are happy when working in a state of Flow. Flow experiences lead to an increase in productivity. When the flow conditions have been met they create a flow loop between action and feedback that allows for continuous and effortless tuning of performance while taking action. Flow loops make an activity worth doing for its own sake[3].
Entering flow depends on establishing a balance between perceived individual skills and perceived task challenges. Said in another way - capability should match work complexity.
After that the developer must receive immediate feedback that allows them to continuously adjust their performance as they tackle these challenges. This kind of feedback communicates how well they are performing and how they can improve their performance.
By measuring how well project policies and processes meet the flow conditions we can engineer a project organization that facilitates flow.
From a project management perspective there are two areas we need to create.
- Conditions for flow. That means breaking down the project into disjoint units of work. For each task the three flow conditions should be in place.
- Action and performance feedback. Tasks distribution so that each of the developers has a proper challenge for their skills. A feedback mechanism should be in place to tell developers how well they are doing.
Creating conditions for Flow
“The goal is to make full use of the workers' capabilities by building up a system that will allow the workers to display their full capabilities by themselves.” ~ Y. SUGIMORI, K. KUSUNOKI, F. CHO & S. UCHIKAWA (1977) Toyota production system and Kanban system
In order to have conditions for flow for each individual user story we need to answer the questions:
- what to do
- how to do the "what"
Software development is a process of going from 0% knowledge about an idea to 100% knowledge of a finished product ready for delivery to a customer. In its simplest form, the job of software development is to reduce the number of unknowns to zero by the time the system is delivered. It is a process of knowledge acquisition and ignorance reduction[12]. Hence we model the software development process as a knowledge discovery process. The goal is to iteratively identify knowledge gaps, reduce our perplexity, increase our knowledge and close the identified knowledge gaps.
It is also a continuous process rather than a punctuated or continual process. This means that moment-bymoment on the project, ignorance is identified, questions are asked, answers are obtained and validated, and knowledge is discovered[12]. We need to find the knowledge to be discovered for each user story. That knowledge is the difference between the missing information and our existing knowledge.
Quite commonly, we underestimate how much knowledge we have to discover to deliver the functionality to the customer, or overestimate our prior knowledge, which is the same thing.
Contextualization
This contains substantial material from Cynefin Training programmes and Dave Snowden's blog posts. The author acknowledges that use, and further that his use of that material are his own and should not be considered as being endorsed by theCynefinCompany or Dave Snowden.
"Without context, words and actions have no meaning at all. This is true not only of human communication in words but also of all communication..." ~ Gregory Bateson
Our project is a system composed by the people, who will deliver and the people, who define what to be delivered. We shall call the former group Capability and the latter group Client. Capability is represented by the delivering organization's knowledge, skills and capacity. The Client is responsible for defining "what to do". The Capability is responsible for defining "how to do the what".
Even though Client and Capability are joined to successfully finish the project, they come from different contexts. Our first task is to establish a shared project context that will have meaning for both Client and Capability. For that we use the Cynefin framework[2]. We create two contextualized Cynefin frameworks - one for the Client and another for the Capability.
Then, both Client and Capability get together to create the complete Cynefin framework for the project from the two contextualized Cynefin frameworks. The goal is to combine the two perspectives into one that we can use operationally. This exercise will also identify perplexity across all the axes we can think of, and help us figure out just how perplexed we are as a system (jointly Client and Capability).
Cynefin is a phenomenological framework, meaning that what we care most about is how people perceive and make sense of situations in order to make decisions[8]. If we allow reality, knowledge and perception to separate wildly everything becomes totally inauthentic. In order to get better alignment inside the system that is our project what we need is to increase the friction between perception, knowledge and reality. They will never be fully aligned but at the same time the misalignment never gets too far[4].
In order to enable sense-making in every unique context the Cynefin framework is created anew. That is called contextualization . In categorization the framework precedes the data. In contextualization the data precedes the framework[5]. The value of a contextualized Cynefin framework is that it provides a unique shared language which reflects the context of the project. This language the Client and the Capability can use to discuss perspectives and possible actions.
We will create two contextualized Cynefin frameworks - one for the Client and another for the Capability. Each group works separately in a sequence. The Client is first and then the Capability follows. This can be done in person or online - but must be done socially.
Client perspective
Client is responsible for defining "what to do." That is needed for each of the user stories to be delivered.
The first thing we need when creating a contextualized Cynefin framework is to write down a list of all the user stories to be delivered. Each user story needs to have a number like 1, 2, ... etc. Then write each user story number on hexagon cards.
Then we describe to the participants the three Cynefin domains - Clear, Complicated, Complex. Client's perplexity about the nature of the requirements defines the Cynefin domains for the Client's context. The labels are about “what” are the user stories that need to be delivered. We will use only three cases:
- Clear. The client knows exactly what they need. They have it already defined. There are no alternatives. It requires zero questions to be asked. No perplexity at all.
- Complicated. The client has a few ideas about what they need. They'll need some expert analysis in order to select one alternative and define it. There are up to 16 alternative and it requires at least 1 and up to 4 questions asked in a row, in sequence, linearly. Perplexity is like they have to find a coin in 16 boxes.
-
Complex.
The client has just a vague idea about what they need.
They'll have to explore many
alternatives before arriving at a definition.
They don't know what they don't know i.e. there are unknown unknowns.
Perplexity is daunting because one of the two holds:
- It requires: at least 5 and up to 99 questions asked, but not in a row, not in sequence and non-linearly. In this case perplexity is too much because of such a big search space.
- They don't know what questions to ask at all!
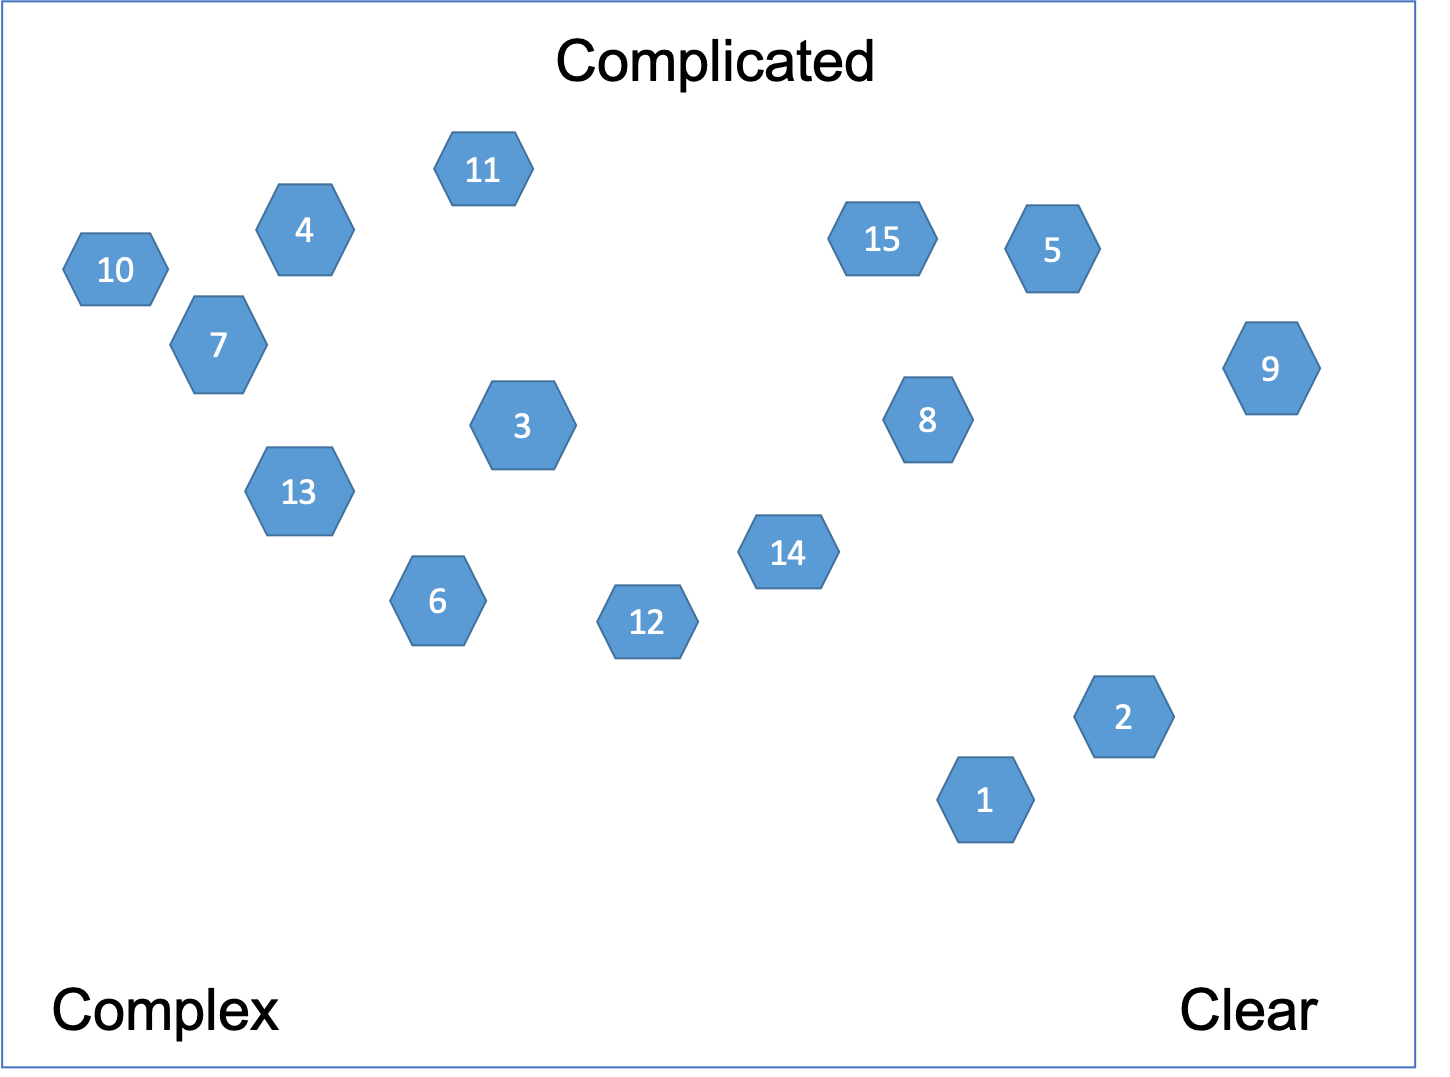
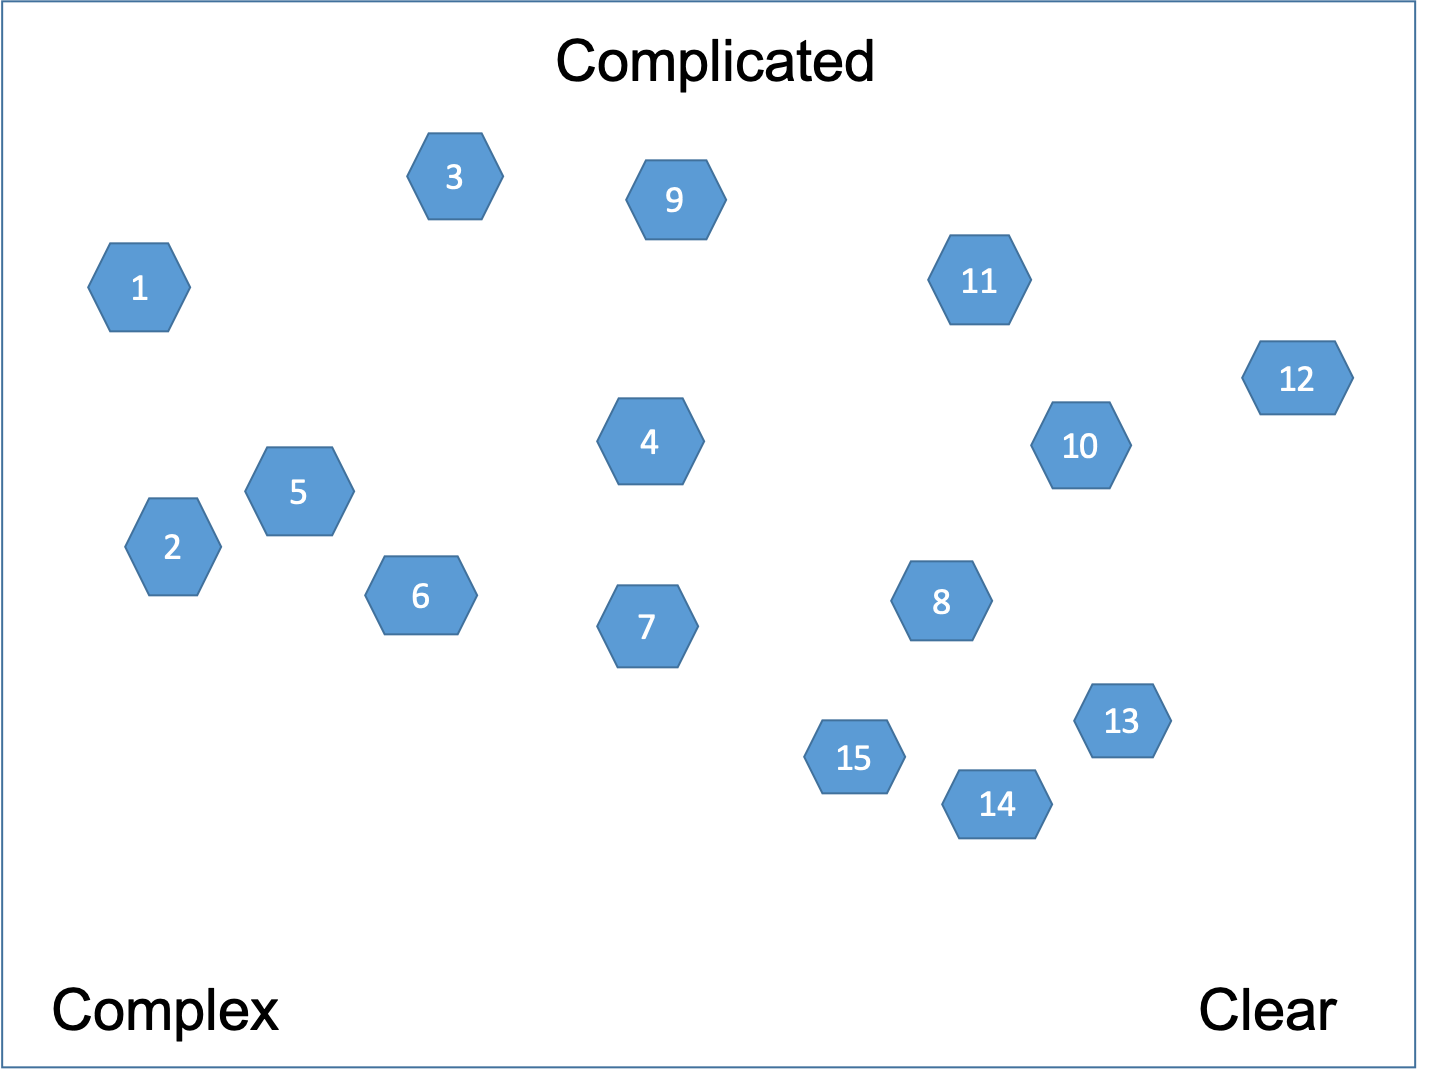
We draw those labels in the corners on a very large flip chart as presented on Figure 4. Each of the user stories will be positioned relative to each corner of the overall Cynefin space - without boundaries.
Then we find three cards that fit at the extremes and place one card in each corner. We talk about the extremes in the context of the overall purpose of the project. Some caution is in order - we never give people an example from their own data of what should be in each of the three corners when we are doing this! We realize that people watch what the facilitator is doing and assume a huge amount of intention. If we want to emphasize we pick an example that has nothing to do with their data.
At this point we should have three cards in the three corners of our flip chart. Then we select one of the remaining cards at random and place it as if it has elastic bounds to the three corners. Is it more like this, or that or close to the middle? Again it's a group discussion.
Next step is to loop through all the user stories on the cards. We take another card at random. We place it against the three corners but also to the one we just put down. After that, keep going with the rest of the cards as presented on Figure 4.
Clusters are allowed to form but are not required. Discussion is encouraged while placing the cards. The facilitator is allowed to stop people from not placing a card and saying: “These are the problems we know about them” . People should say: “These are the problems - frankly we are not yet clear about them”. We let people decide for themselves what's in and what's out of a domain.
After the initial placement - we are never allowed to move a card by itself, but only by breaking it down into cards and moving the new cards.
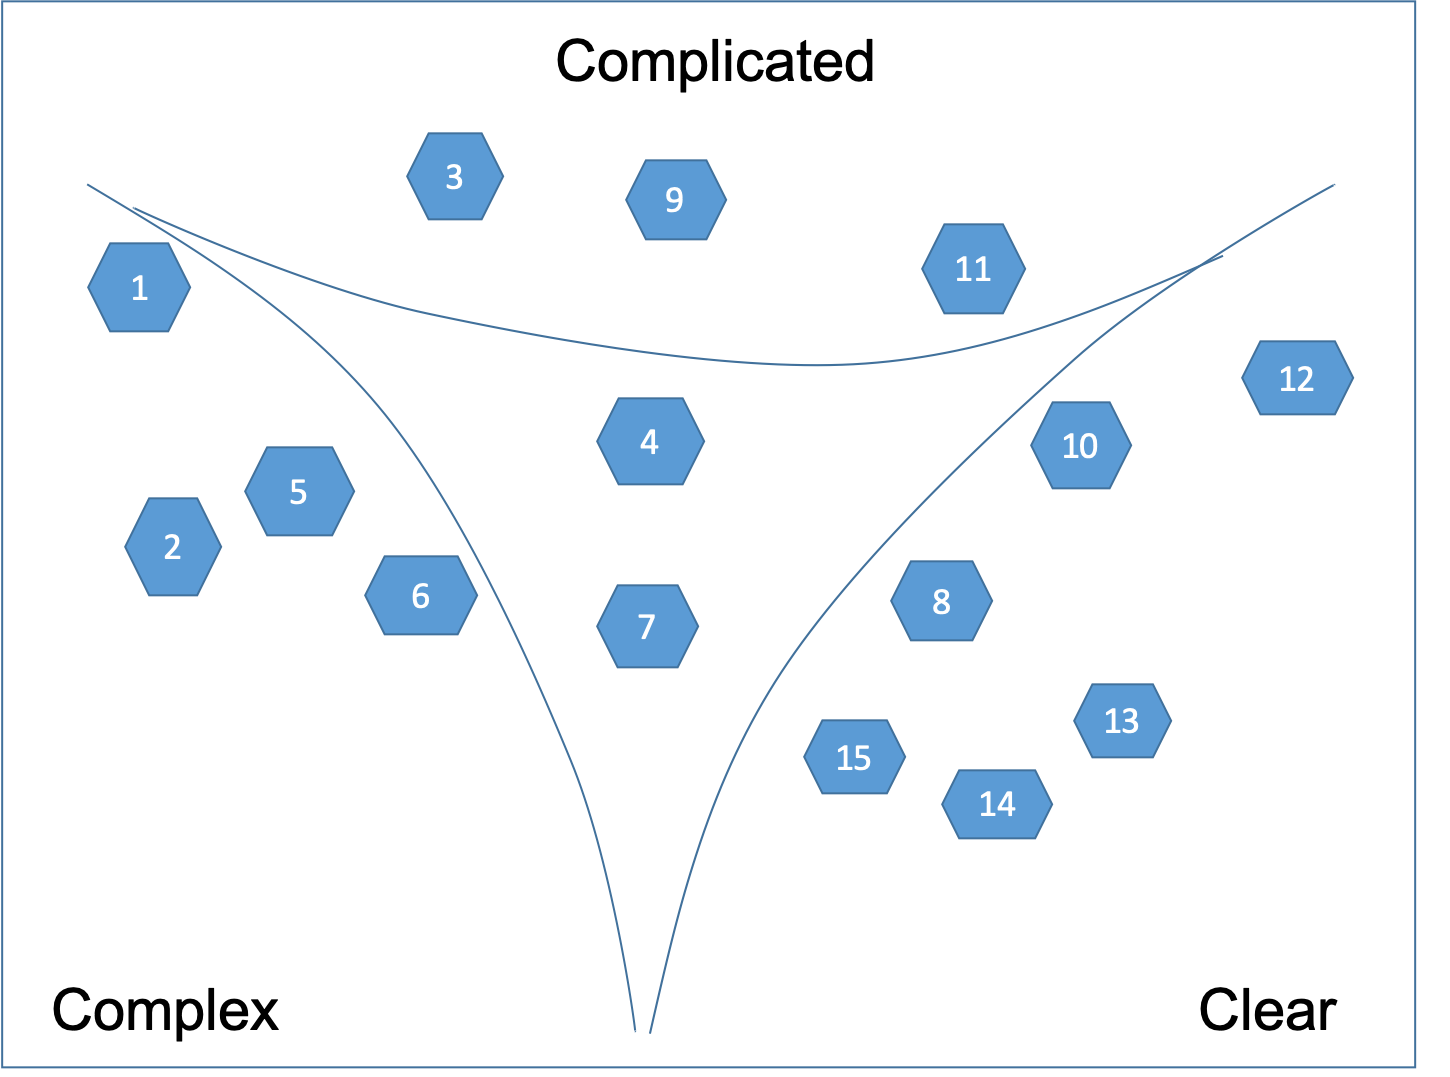
The next step is to define the boundaries as shown on Figure 5.
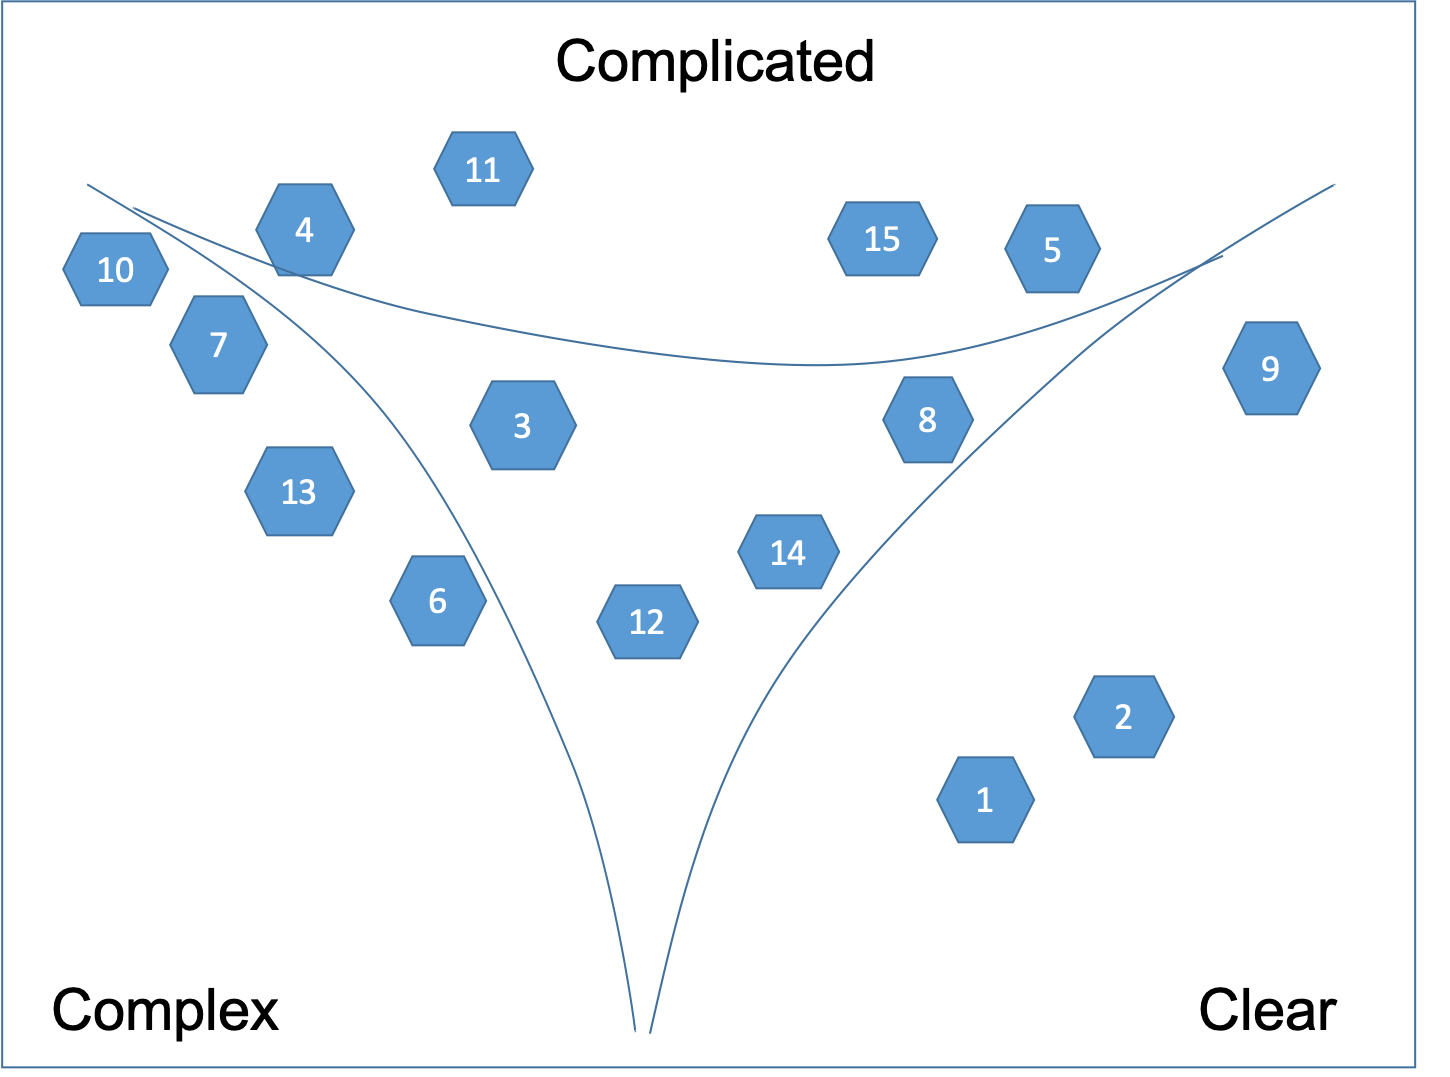
When all cards are placed, lines are drawn between the user stories that are clearly in one domain leaving a central area of disorder. Then the lines are “pulled in” to make the distinctions between domains clearer. If a story is in the central area of disorder or it lies on a line it is split into two or more user stories that can be moved to a particular domain. This process involves discussion as consensus must be reached. By defining the boundaries, we are not pushing people into categorisation! After the contextualization we can move into categorization. We want to have categorization but what we don't want is to have that pre-defined. If people want to do premature categorization we can remind them that's not what they should be doing.
Cards can stay at a boundary but not in the central space. The central space is Confused and we want to get rid of it over time, while we learn more about the nature of what we put in there. Eventually we want to be able to take action and what is in the Confused domain is not actionable.
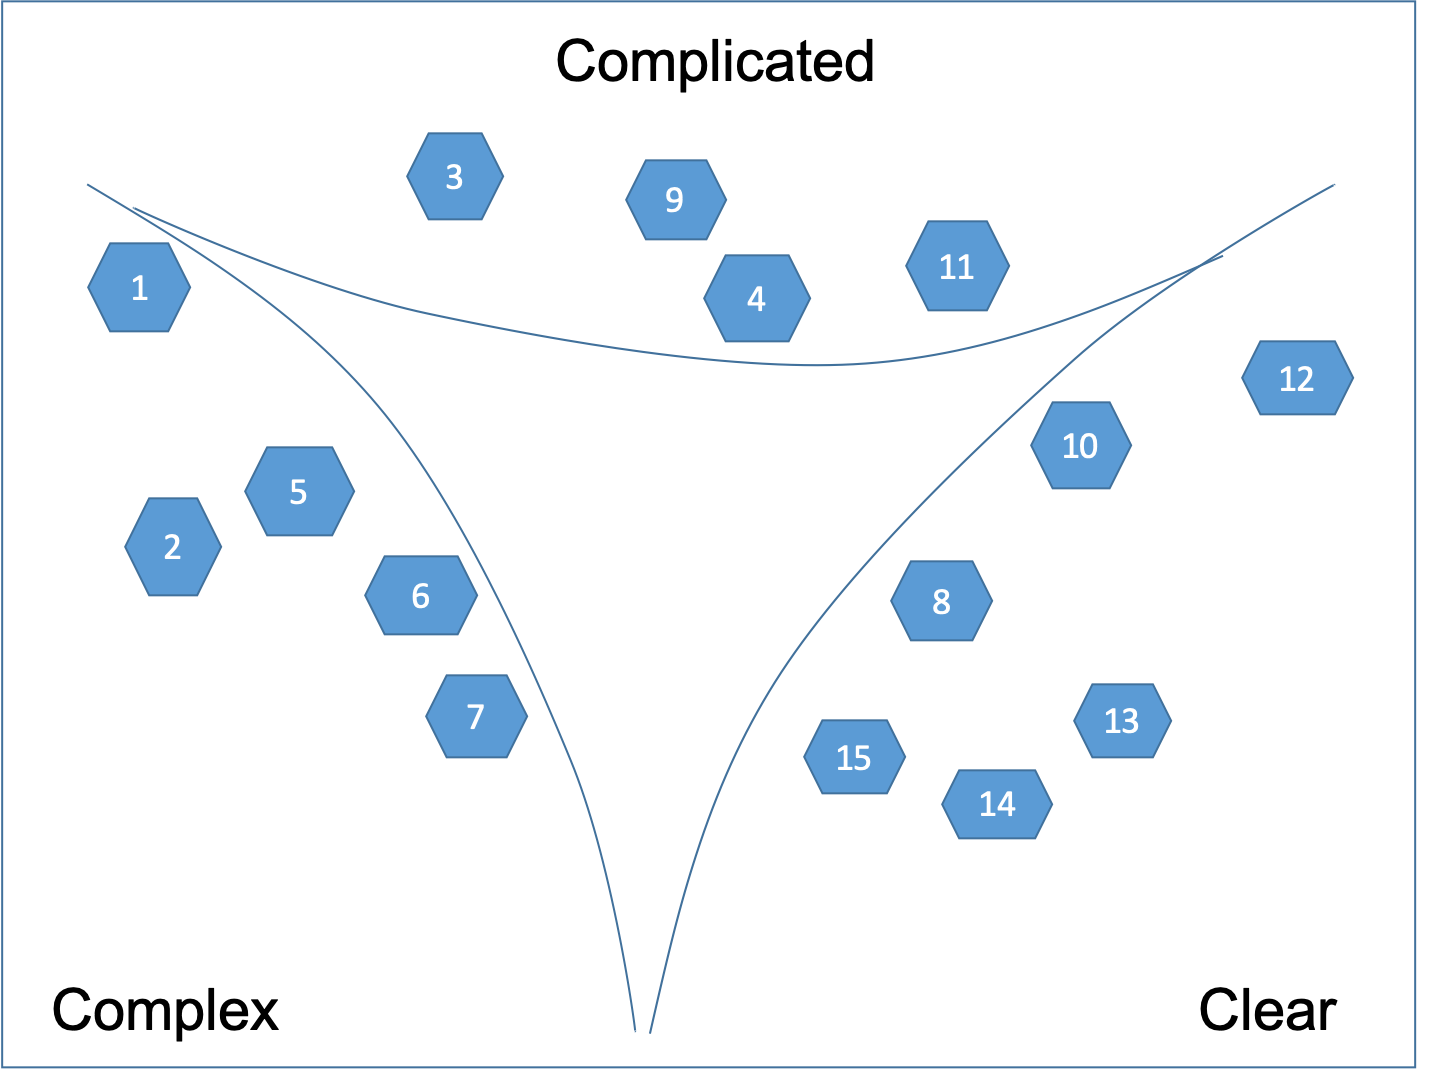
Typically, the cards that end up in the middle - it's a problem of granularity. The user story on the card is too big - part of it may be complex and another part clear. That's why we can't tell what kind of a problem it really is.
We take those cards in the middle of the flip chart and break it up into multiple new cards. The goal is each of the new cards to fit in one of the three corners. By reducing the granularity of the users stories we allow requirements and needs to combine and recombine more readily to create more sustainable and resilient solutions. The result is shown on Figure 6.
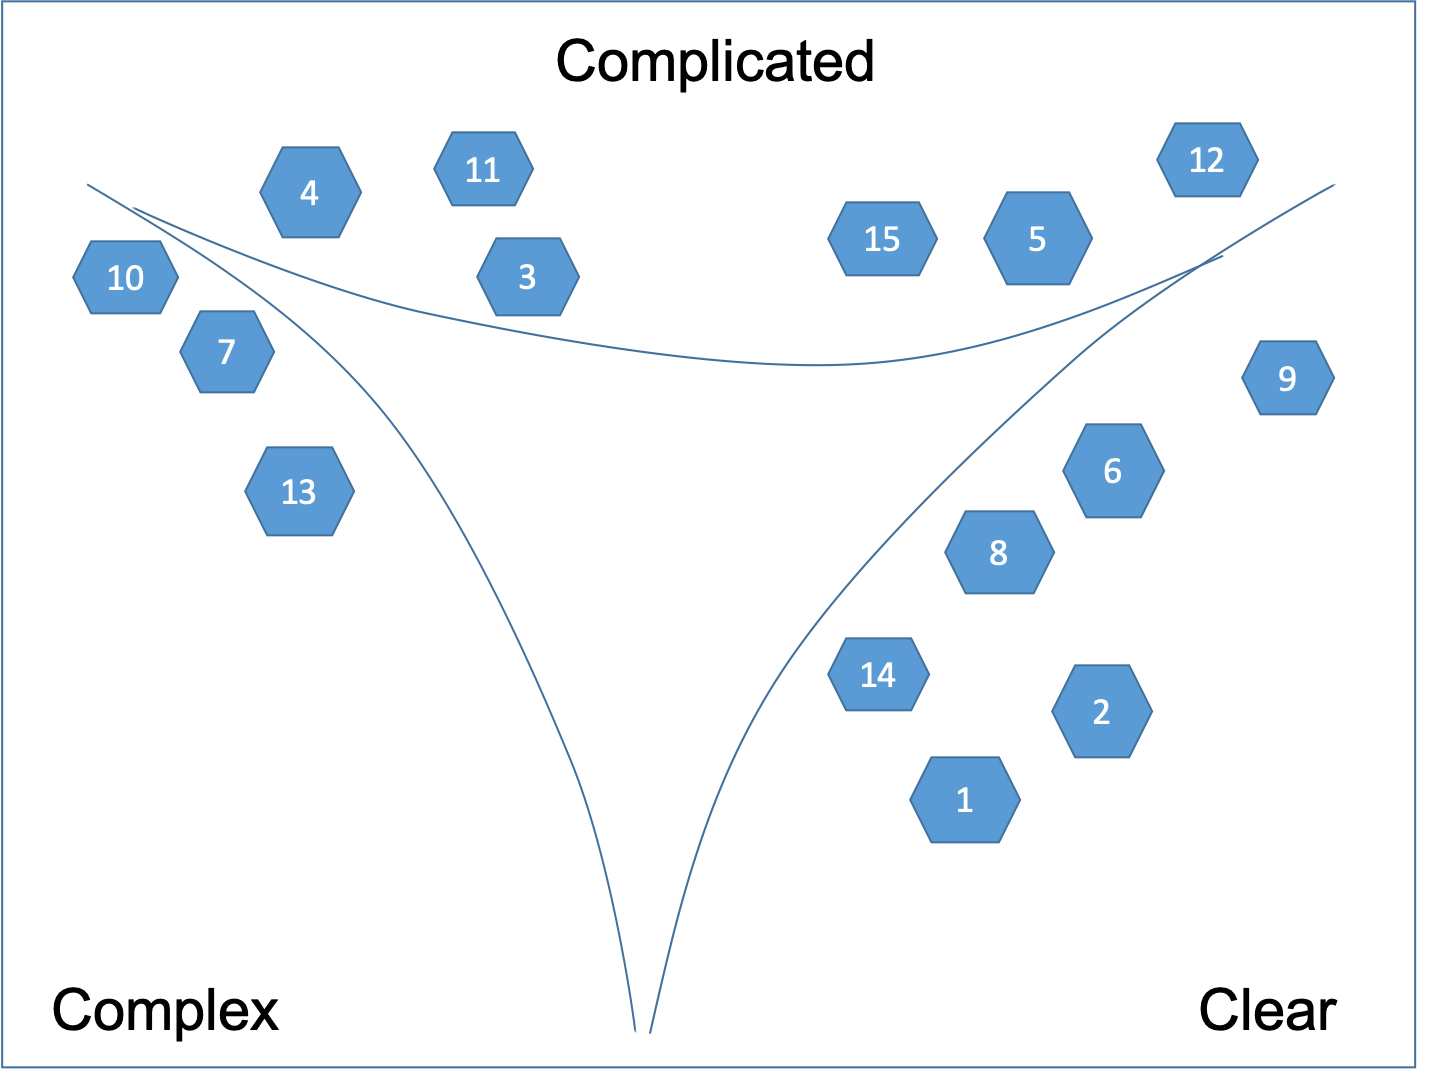
This is a two stage emergence. We are breaking things down, then recombining them again in a different way, then repeating that process. This is designed to break entrained thinking, detect new patterns and gain new perspective and insight.
Capability perspective
Next is to contextualize the same set of user stories but this time from Capability perspective. This time the labels will be different. They are focused on “how” to deliver the "what".
The perplexity about if our development capability would match the requirements defines the Cynefin domains for the Capability's context. Again three cases:
- Clear. They have all the knowledge and skills required to do the job. There are no alternative ways to do it. It requires zero questions to be asked. No perplexity at all.
- Complicated. They have the knowledge and skills required to do the job, but there are up to 16 alternative ways to do it. It requires at least 1 and up to 4 questions asked in a row, in sequence, linearly. As experts they'll research and analyze the alternatives. Perplexity is like they have to find a coin in 16 boxes.
-
Complex.
They have a vague idea about how to do what the client requested.
They'll have to explore many
alternatives before arriving at a solution.
They don't know what they don't know i.e. there are unknown unknowns.
Perplexity is daunting because one of the two holds:
- It requires: at least 5 and up to 99 questions asked, but not in a row, not in sequence and non-linearly. In this case perplexity is too much because of such a big search space.
- They haven't done it before and they'll need to build knowledge and skills. They don't know what they don't know i.e. there are unknown unknowns. They don't know what questions to ask at all!
Again we place the cards according to the three corners as shown on Figure 7.
Here the case may be that we are not able to tell if we have the capability to deliver a user story simply because the user story itself is not clear enough from a Client perspective. This makes it complex from a Capability perspective as well. As a general heuristic we need to be conservative and pessimistic. That means if a user story is between Clear and Complicated then we put it in the Complicated corner.
After the initial placement - we are never allowed to move a card by itself, but only by breaking it down into cards and moving the new cards.
Then we draw the boundaries as shown on Figure 8.
Then we break down the user stories in the central Confused state, which are too big as shown on Figure 9.
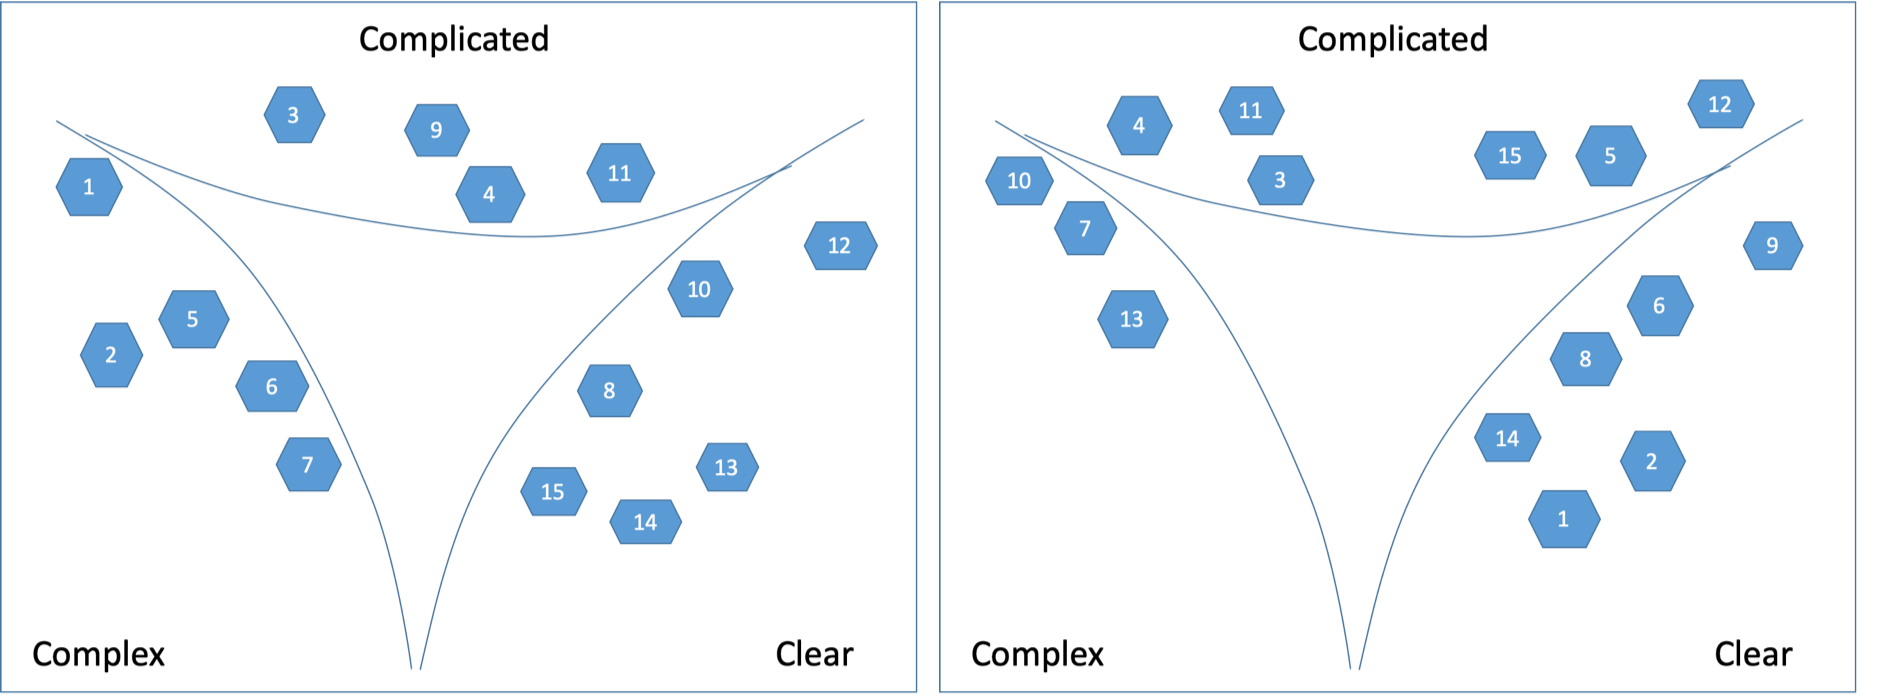
Eventually, as shown on Figure 10, a Cynefin framework is created anew for each of the Capability and Client contexts.
Categorization
Both Client and Capability get together to create the complete Cynefin framework for the project from the two contextualized Cynefin instances. We will use the complete Cynefin framework for categorisation in the unique context of the project. The goal is to combine the two perspectives into one that we can use operationally.
The complete Cynefin framework will be contextualized to the environment and operations of our project. It will provide a new shared language with which both Client and Capability can discuss situations, perspectives and possible actions. It can be used to talk about interpretations of current conditions based on gathered data, to evaluate strategic interventions, and to constructively manage conflict and bring about consensus, without removing conflict [1].
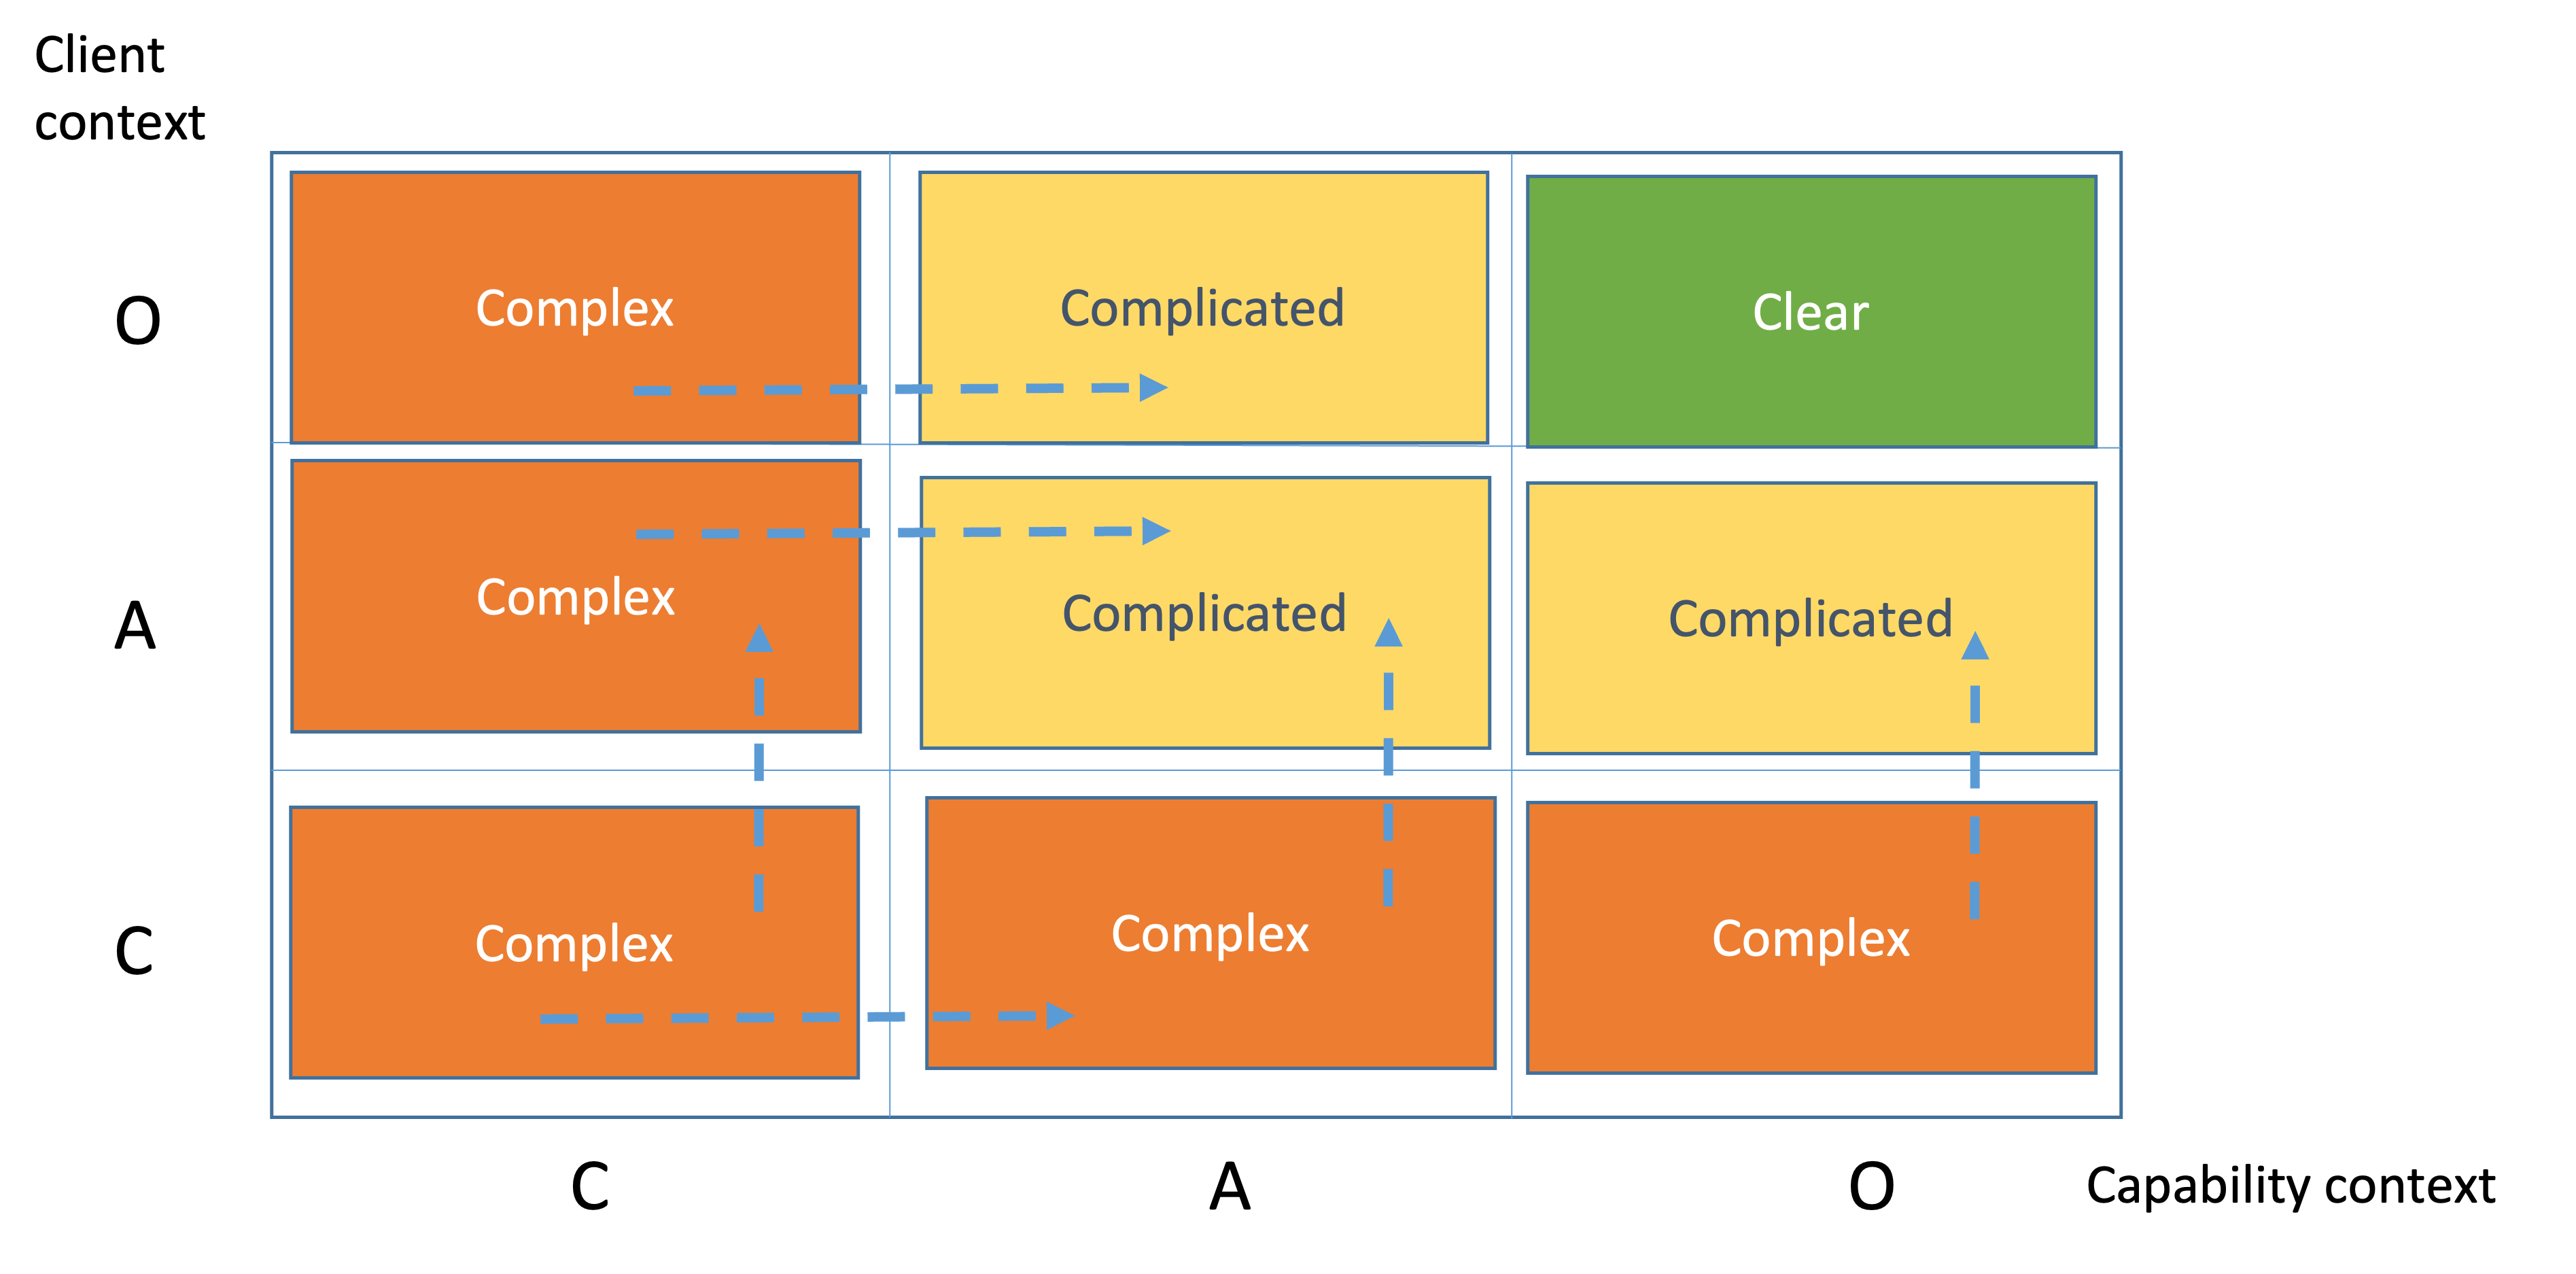
Here is how we do that. First we create a space with horizontal and vertical axes as presented on Figure 11. On the horizontal axis we have the level of perplexity from Capability perspective. On the vertical axis we have the level of perplexity from the Client perspective. The level of perplexity maps to the three Cynefin domains - Clear, Complicated and Complex. The Chaos domain is also present on the diagram. It is the point 0, where both Capability and Client feel maximum perplexity (no constraints).

In order to make the diagram more tidy we will put “O” for Clear, “A” for Complicated and “C” for Complex. The result is presented on Figure 12. "O" stands for Obvious, which is like Clear. "A" stands for Analysis, which is what Complicated user stories need to become Clear. .

We match the user stories from each Cynefin instance indexed by their complexity profile. We do so by taking each of the user stories and placing them in the respective cell from the complexity profile.
The rules are as follows:
- If a user story is part of a Complex domain either from client or from capability perspective, it is considered Complex.
- If a user story is part of a Complicated domain either from client or from capability perspective, it is Complicated.
- Clear are only user stories which are Clear in both perspectives.
Here a question is usually raised: why we need the CP, why don't we just place the user stories in a table as below:
| User Story | Capability Context | Client Context | Complexity profile | Place |
|---|---|---|---|---|
|
#1 |
Complex | Clear | Complex | CO |
|
… |
… | … | … | … |
|
#5 |
Complex | Complicated | Complex | CA |
|
… |
… | … | … | … |
|
#14 |
Clear | Clear | Clear | OO |
|
#15 |
Clear | Complicated | Complicated | CA |
We don't use only the table above because we want to show the movement inside the complexity profile. That means to make complex things complicated and the complicated things clear.
Instead we use the table of the types of knowledge to be discovered as presented on the figure below.
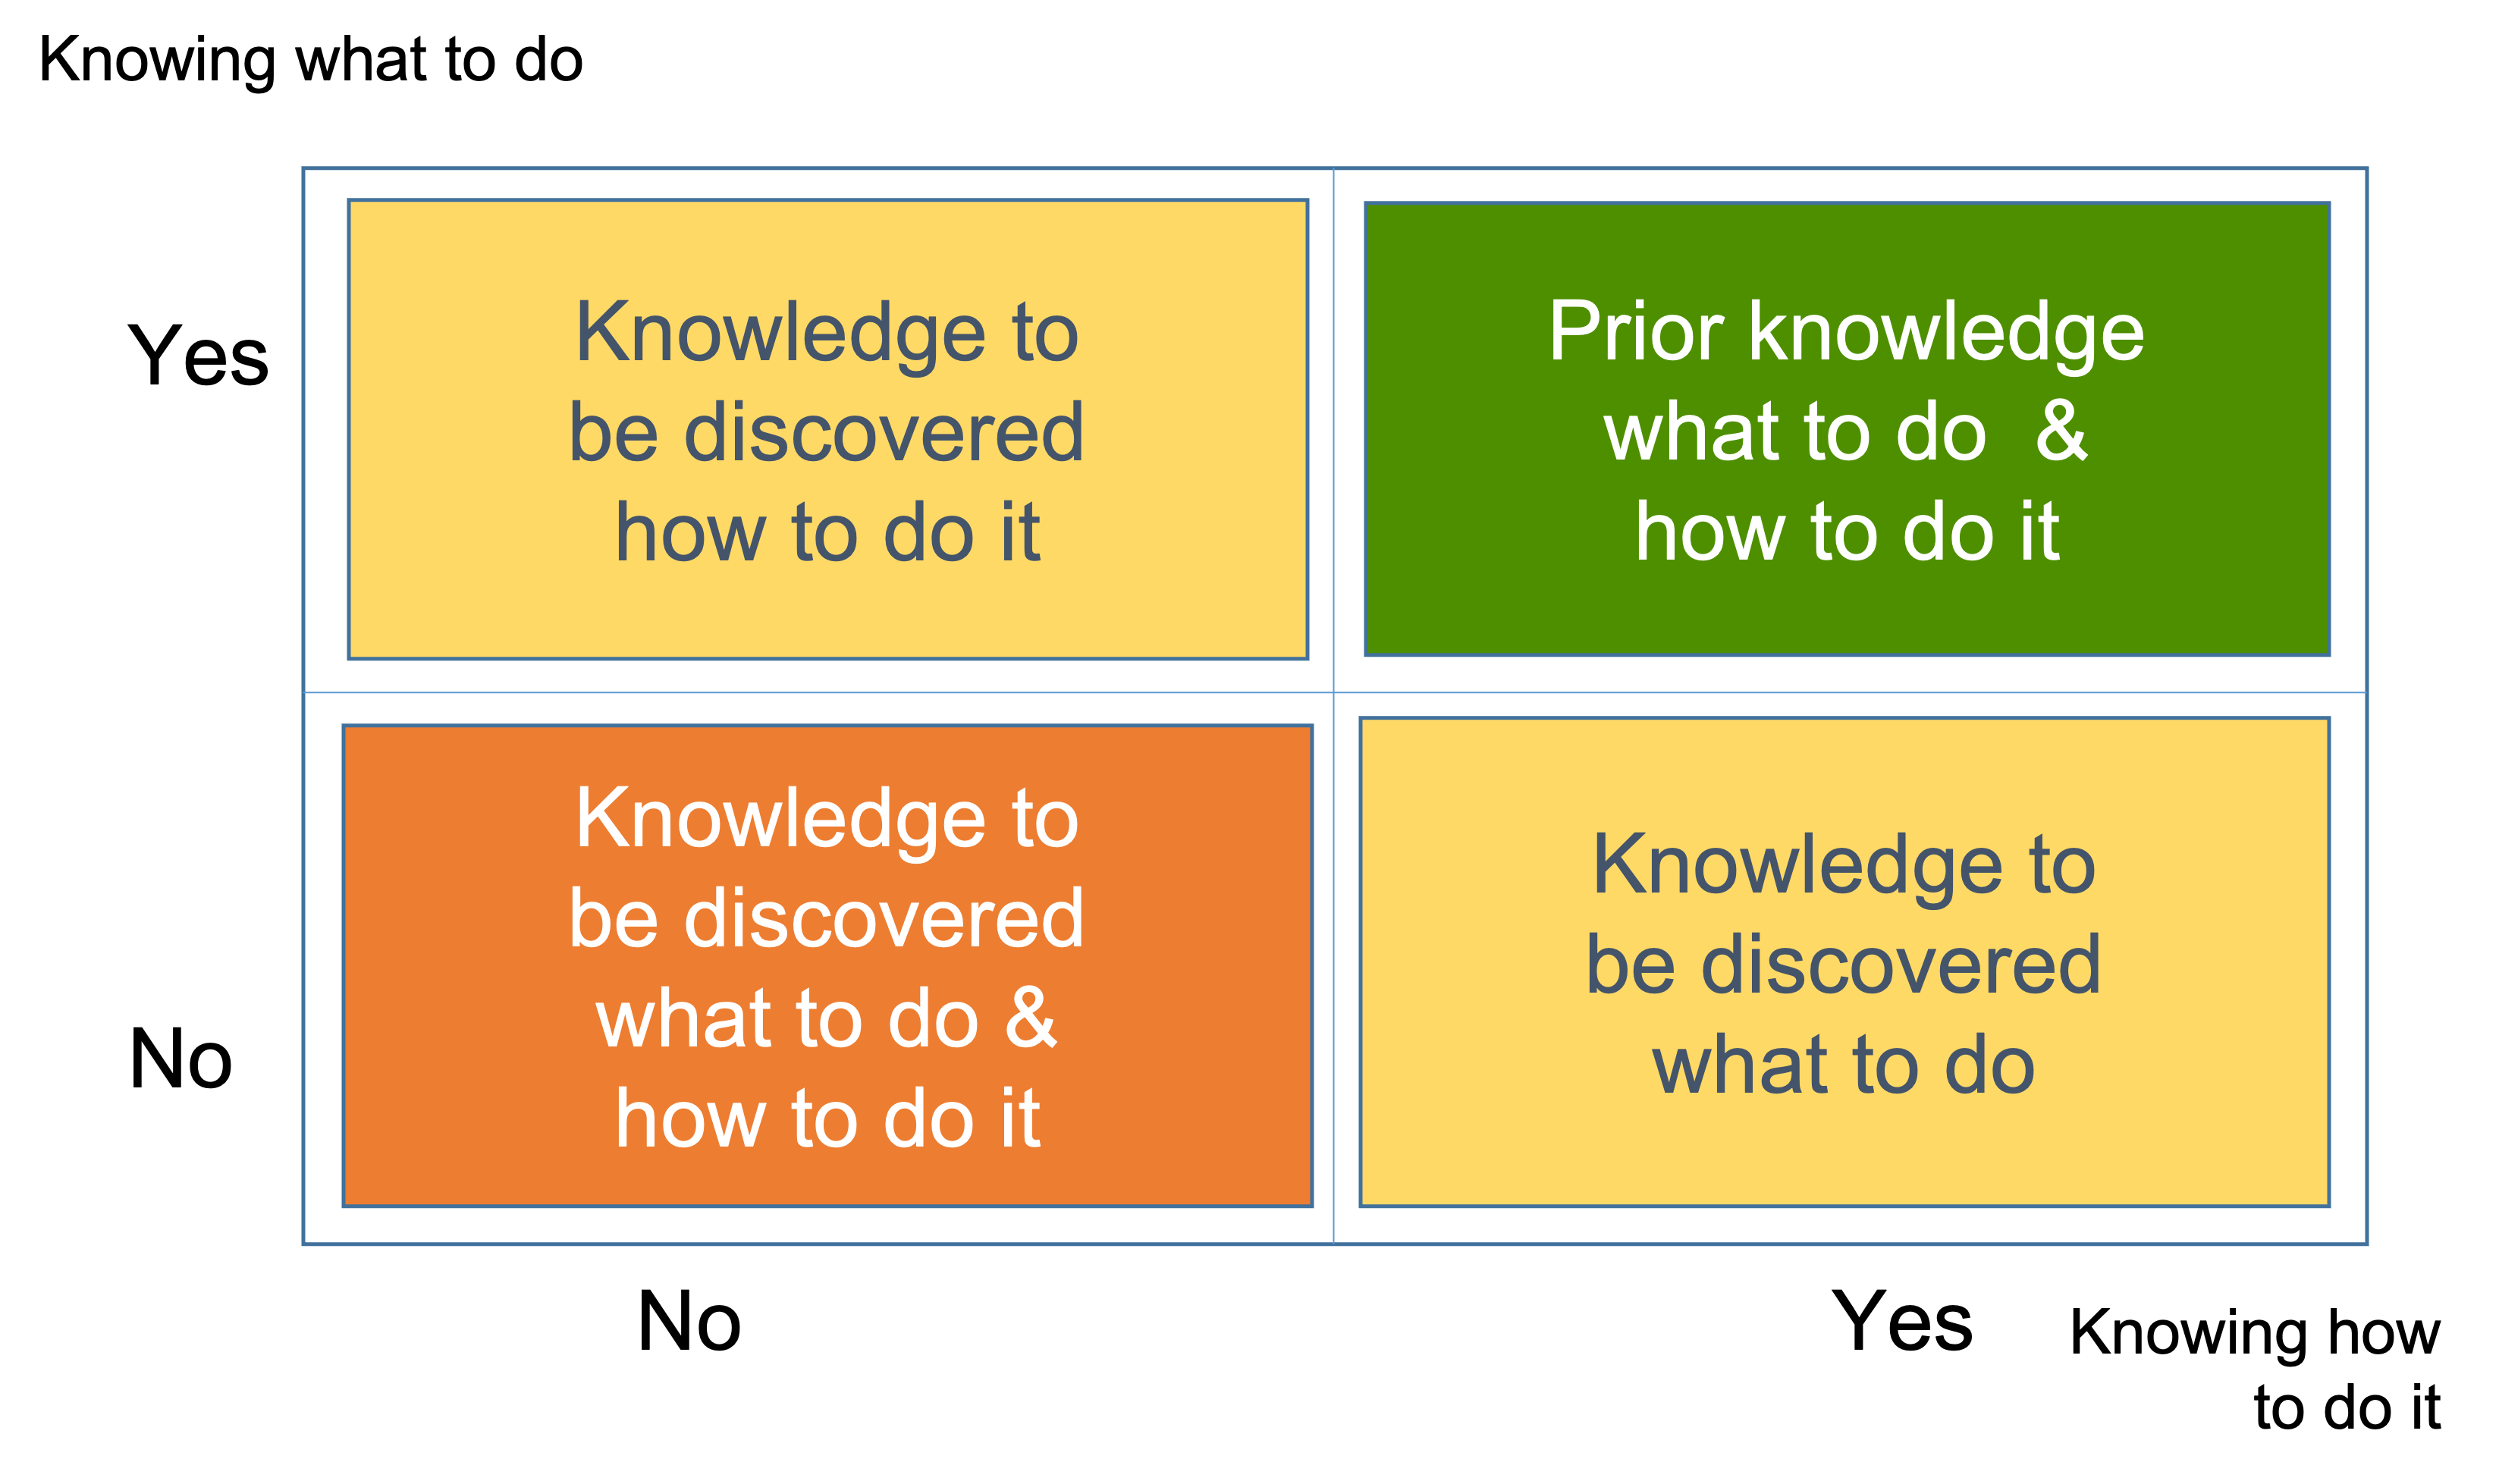
We need to split the yellow and orange boxes based on the number of alternatives. That will make the number of boxes nine instead of four and give us the Complexity profile (CP).
The Complexity profile (CP) of our project is presented on Figure 13. It represents the perplexity of both Capability and Client about the user stories.
Movement from Complex through Clear
"Lack of knowledge…that is the problem. You should not ask questions without knowledge. If you do not know how to ask the right question, you discover nothing." ~ W. Edwards Deming
A complexity profile is a manuvareble space. Each movement is a clarification. Clarification is a knowledge discovery process. All possible movements between domains are presented below.
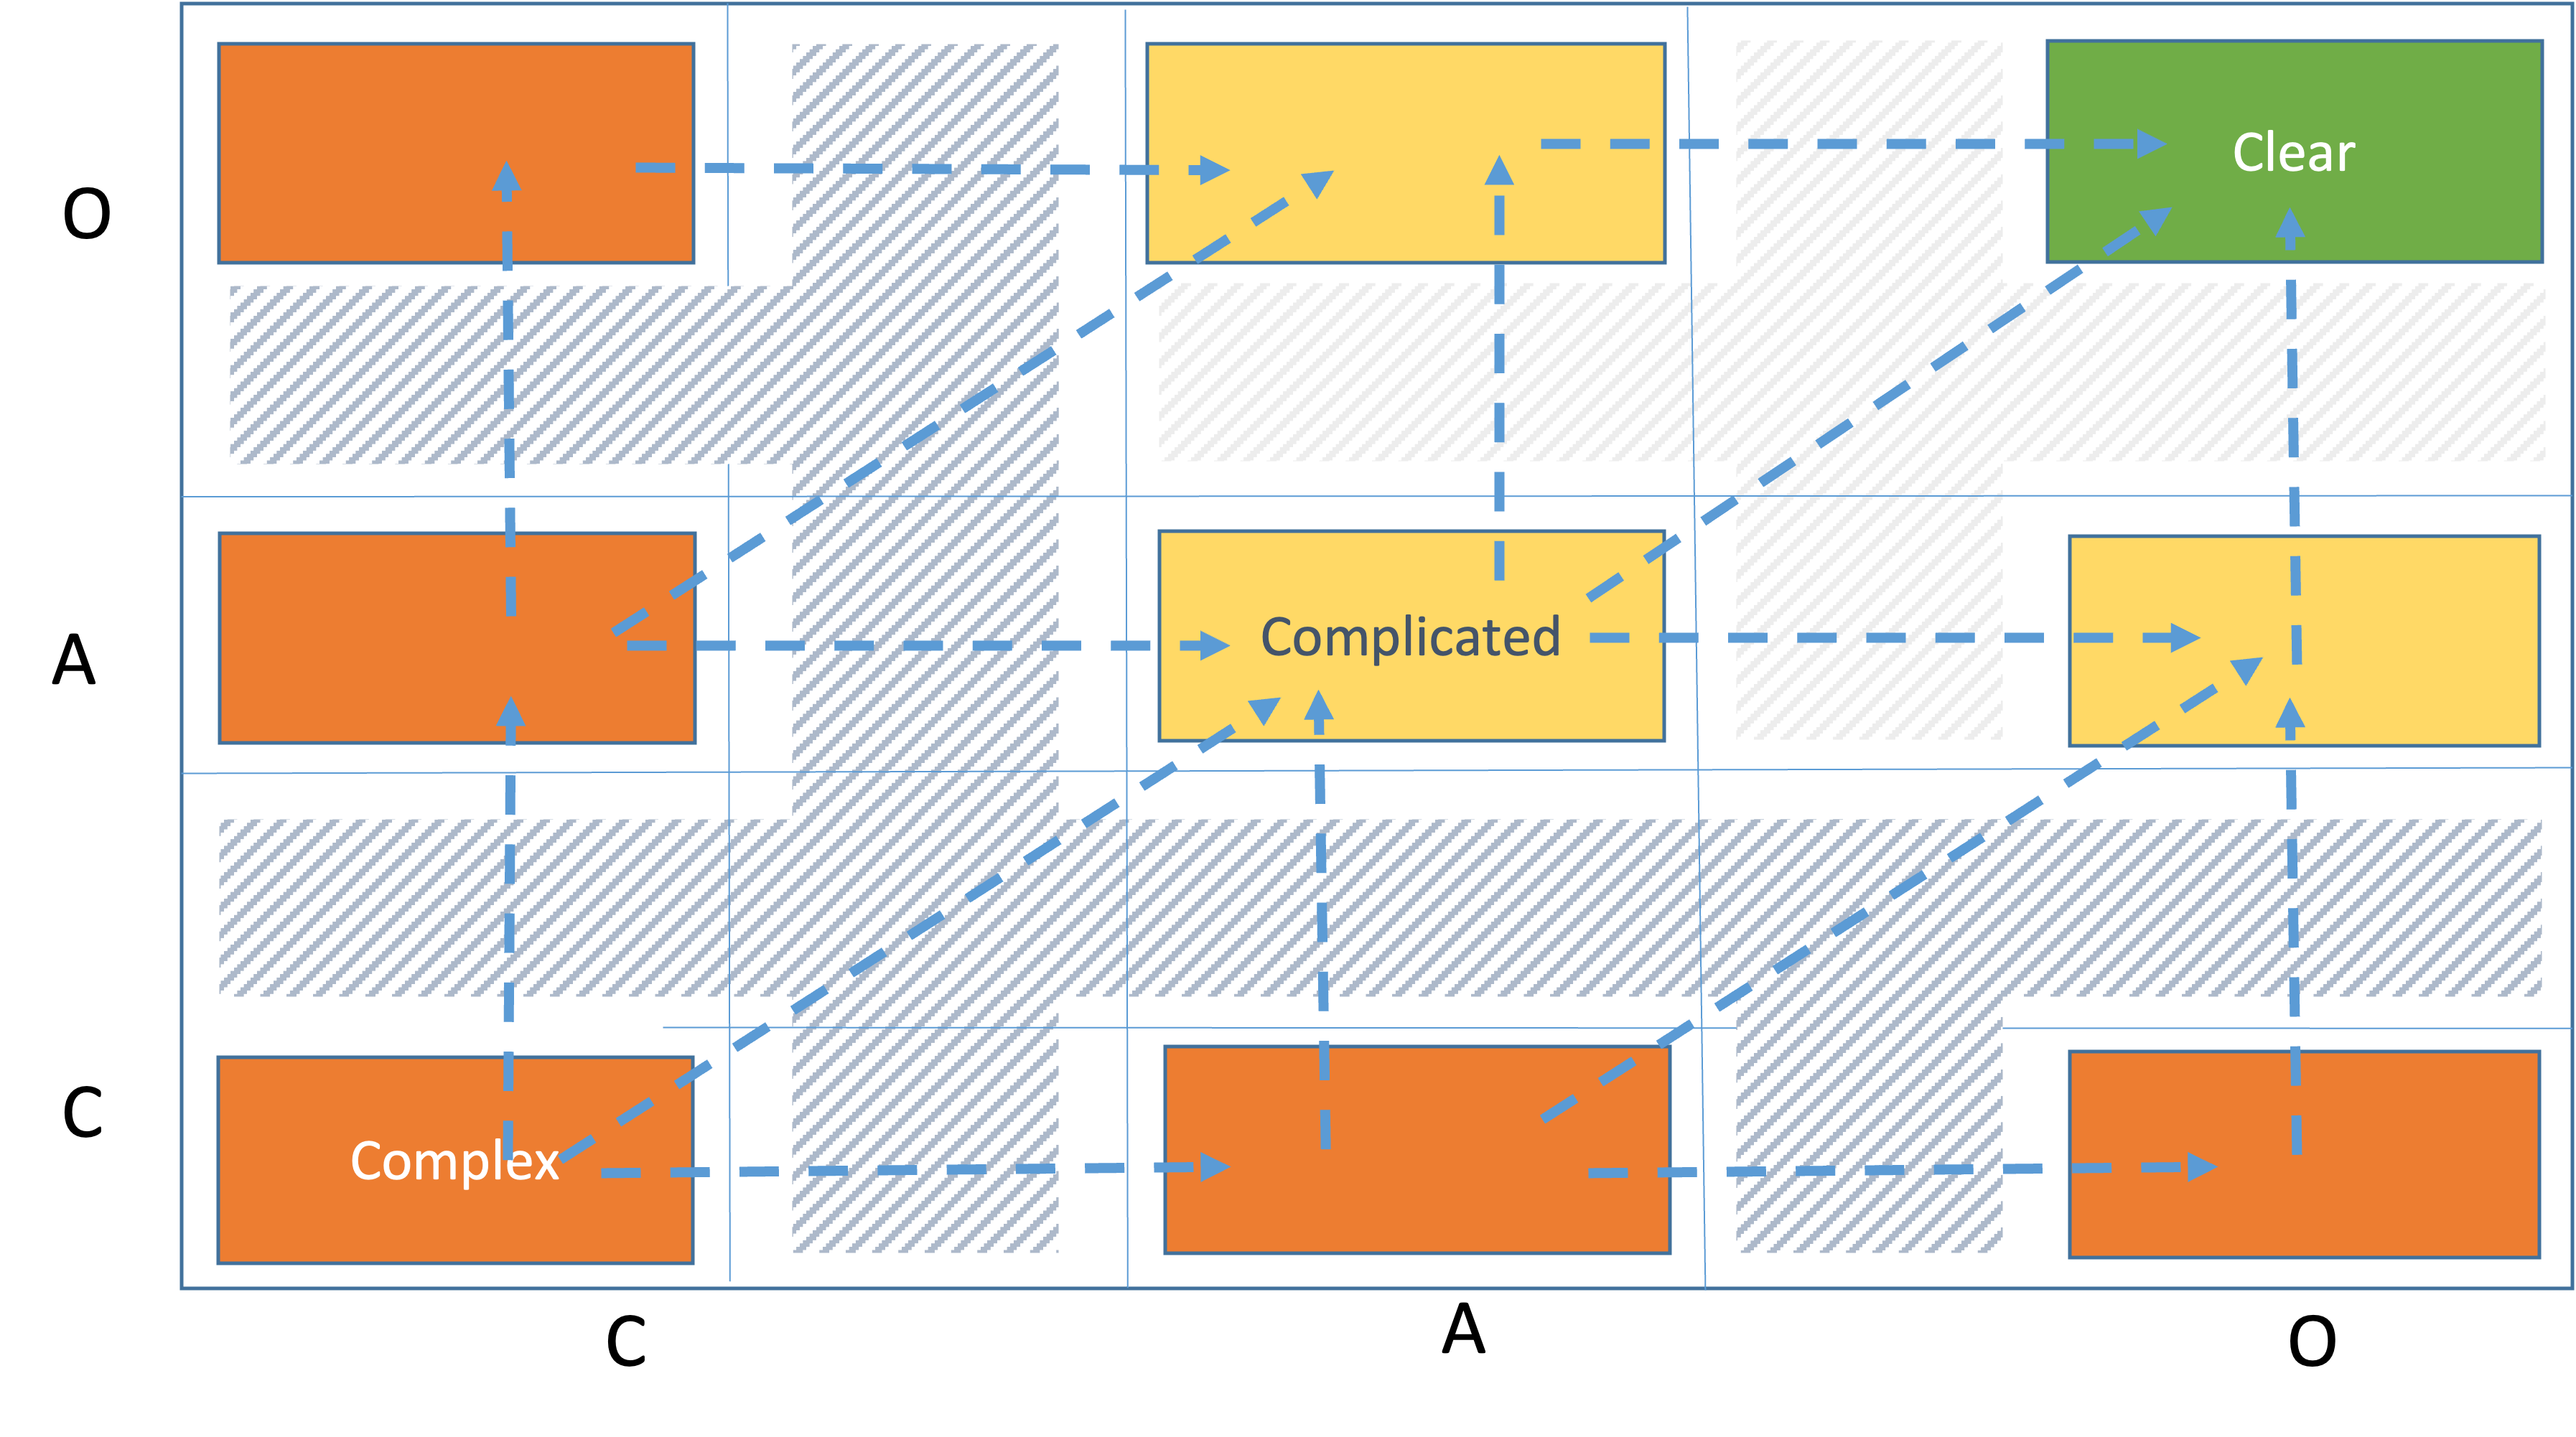
For example, if we want to move a user story from cell CC to cell AA we have several alternative routes:
- Linearly CC -> CA -> AA which means we clarify first from capability then from client perspective
- Linearly CC -> AC -> AA, which means we clarify first from client then from capability perspective
- Diagonally from CC to AA, which means we clarify both from capability and from client perspectives
We also see the transition states between the cells. They are presented in stripes. An user story is in a transition state when it has left a cell but hasn't got into a new cell yet. That means work is being done to clarify the user story.
To clarify a complex user story we employ numerous experiments in parallel which will provide the missing information we need.
Each experiment should be:
- Coherent - to the individual and not the group as a whole, although the group must accept that it is a valid view point.
- Safe-to-fail. That means if it fails we'll be able to recover.
- Finely grained, tangible
As an example, here is a set of axes for experiments that could provide enough knowledge for both Client and Capability perspectives:
- The particular technologies to be used. That is very common in software development where technologies are constantly changing and maturing.
- The way of articulating the problem to be solved — a better model could make the solution obvious.
- The people from the client company to build relationships with.
- The people in the team — their aspirations or fears, their motivation, their relationships with one another and out into the wider organization.
- The client company's organizational constraints i.e. policies, rules, procedures.
- The culture of the client company.
- The third party dependencies and associated risks.
For example, if from a Capability perspective a user story is complex we may decide to do a Proof of Concept (PoC). We do that by preparing a concept with a couple of alternatives. Then the card will follow CC -> AC, and stay in transition until the PoC provides some missing information. If the results from the PoC have narrowed the perplexity we have made the user story complicated and the card will make AC -> AA. Another example, if a user story is complex from client perspective then the Capability could work with the Client by presenting alternatives. This is what software development experts do - provide alternatives not only about how to do but also what to do. When providing alternatives to the client about what to be done we have the chance to move the work through the CP in a direction that best suits our capabilities. One may say that clients who don't know what they want are the best!
Knowledge discovery funnel
"The organization and the people within it need to discover a quantity of knowledge that they do not have, and factor that knowledge into something that works." ~ Phillip Glen Armour[12]
We see that the complexity profile serves us as a map to show how we can move to reach our target level of perplexity. It helps us act in order to move toward reduced perplexity.
This dynamic can be presented in a simpler way as a movement through a funnel as shown on Figure 15.
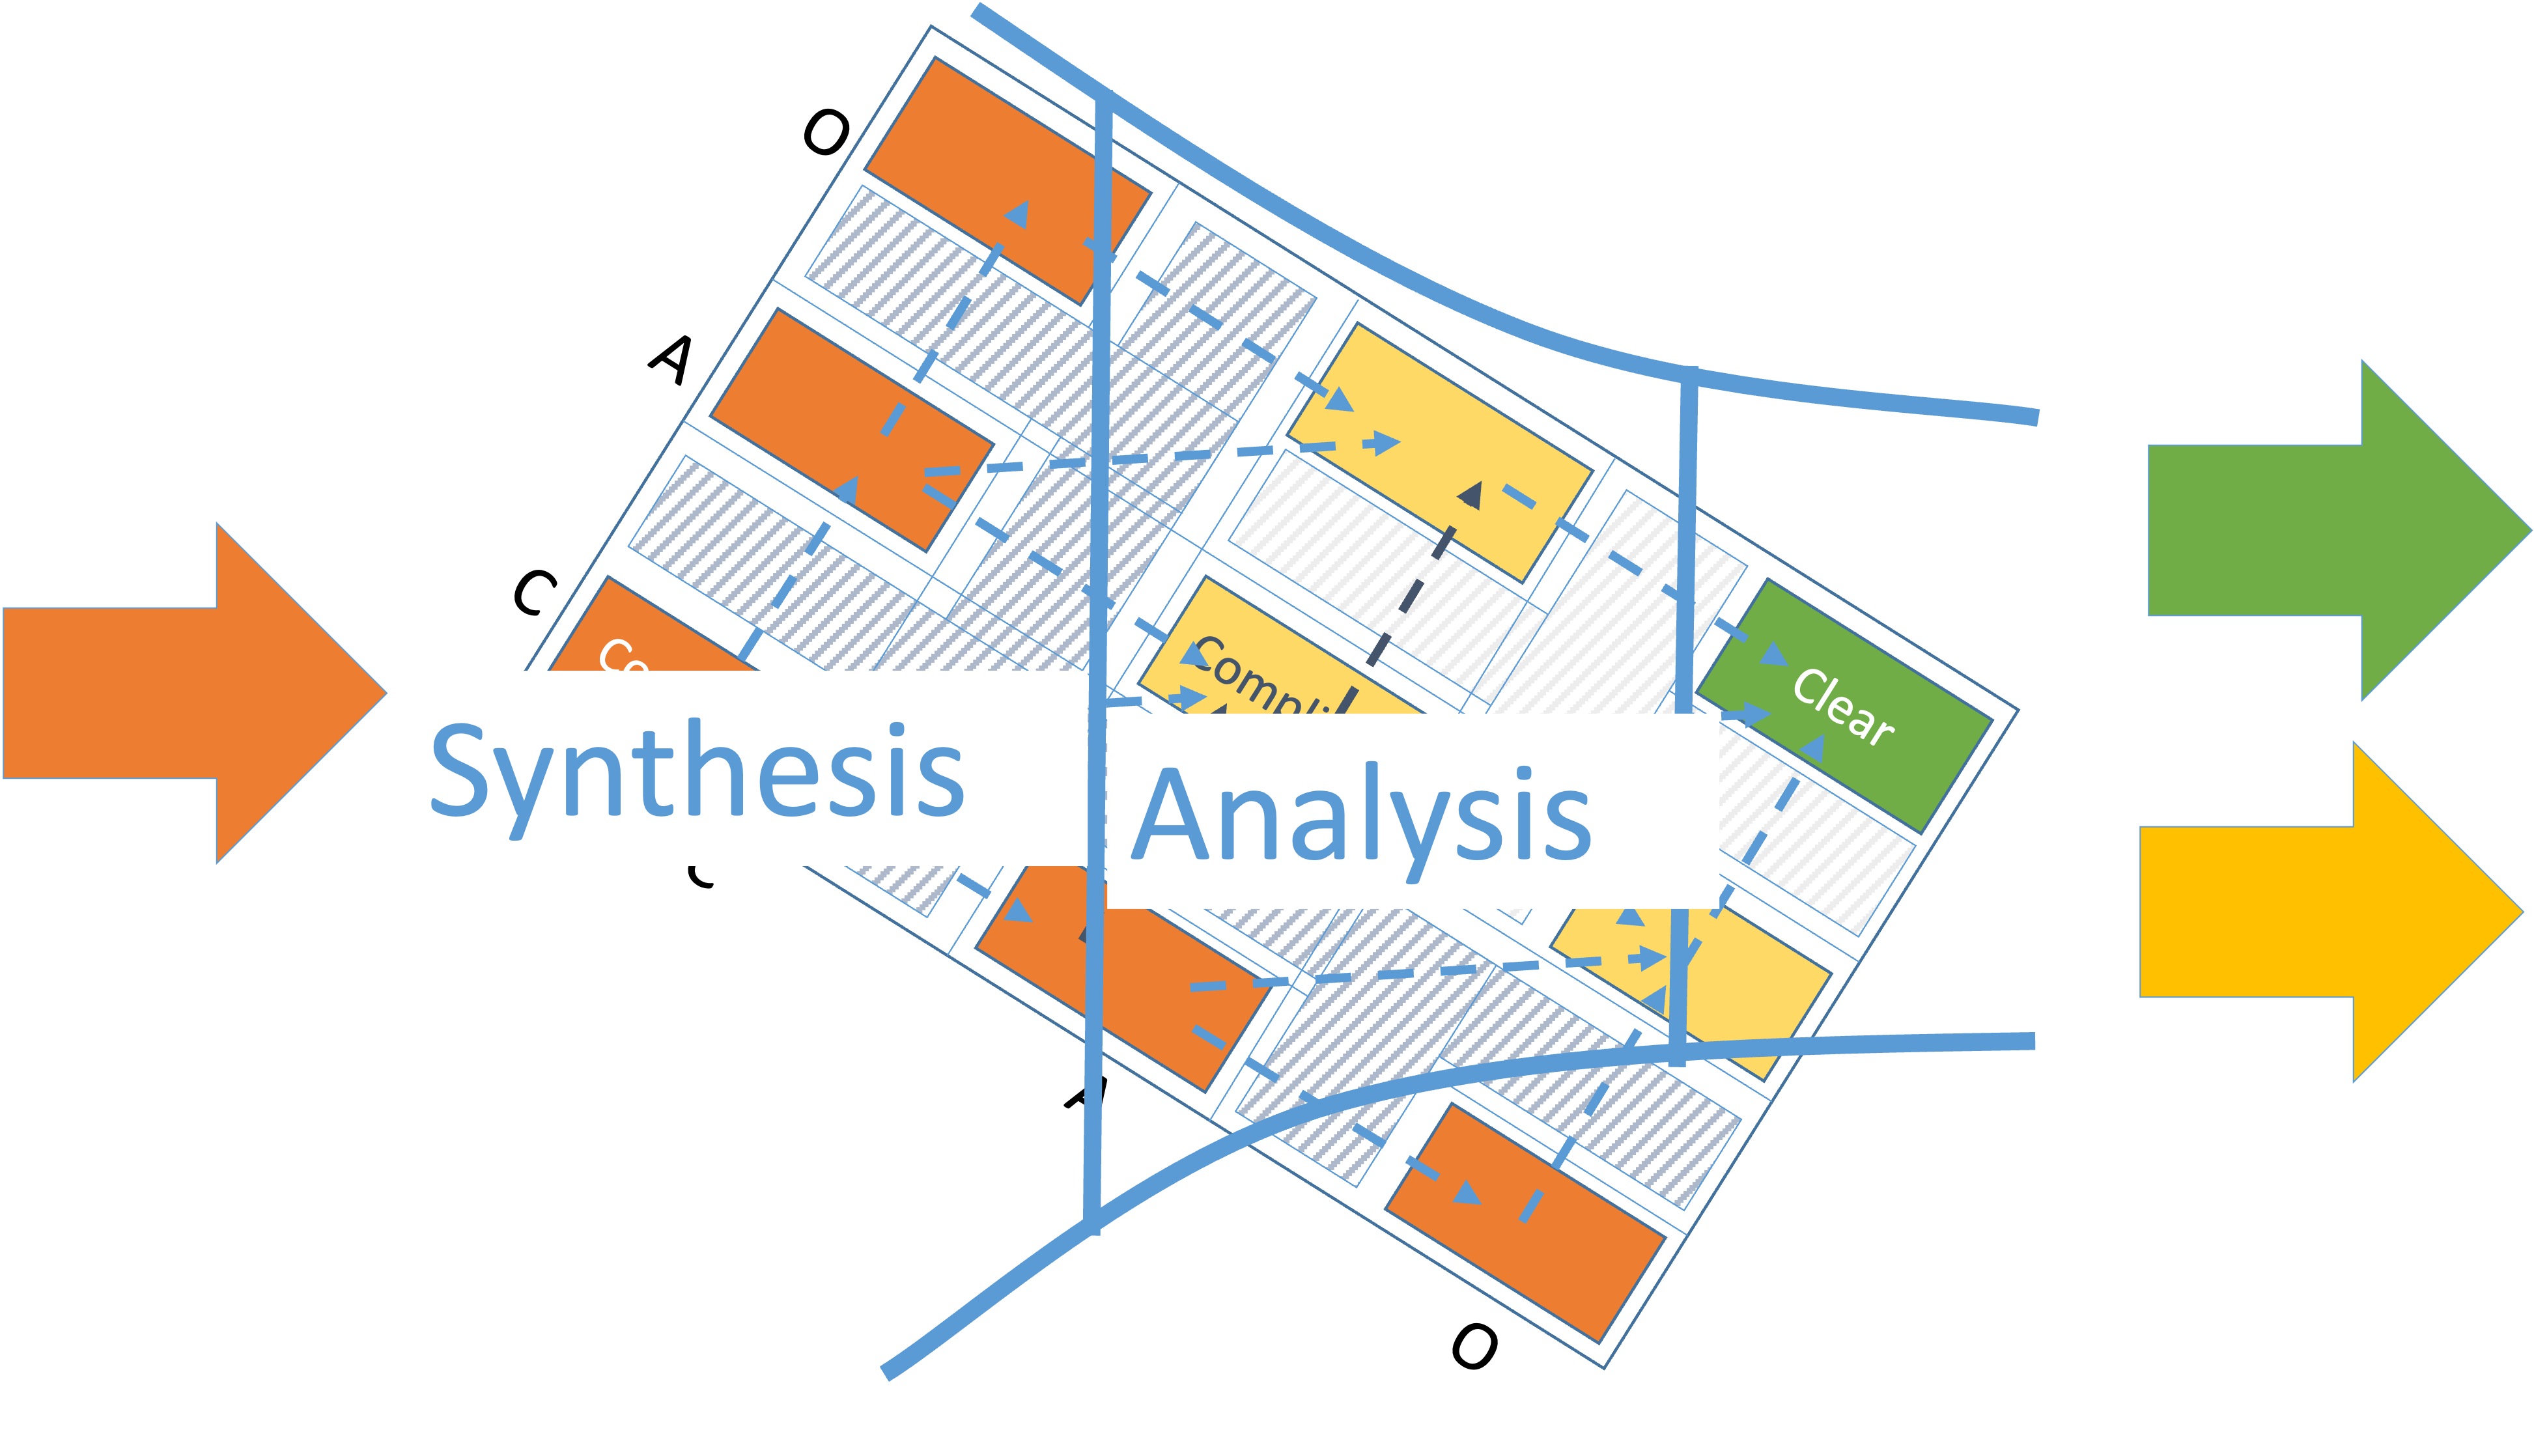
We have rotated the complexity profile 45 degrees so that the lines of movement from complex to complicated and from complicated to clear are horizontal.
Clear stories let delivery to focus on capturing and codifying existing knowledge.
The flow through the funnel should not be in a rush. Especially if the knowledge gaps are numerous, complex, and interrelated. It must enable efficient and effective learning to close the identified knowledge gaps. Otherwise, bad decisions would be made and cause rework that would be very costly to the project. Delaying decisions will help you deal with making critical decisions with insufficient knowledge and simultaneously keep multiple options open until knowledge gaps are closed.
Synthesis
In philosophy, synthesis refers to the process of combining different concepts to create a new, more comprehensive understanding of reality.
- Objects (substances) refer to the basic building blocks of reality. They are independent entities that exist and persist through time, and have properties that determine their nature and identity.
- Properties, on the other hand, are qualities or attributes that belong to objects. They are what make objects what they are and distinguish them from other objects. Examples of properties include color, shape, size, and texture.
- Relations refer to the ways in which objects are connected to one another. Relations can be between objects or between objects and properties. Examples of relations include causality, spatiotemporal proximity, and functional dependency.
By considering the objects, properties, and relations that exist in the problem domain, software developers can synthesize a more comprehensive solution that better captures the underlying reality of the problem.
In the first step of synthesis we take the thing we want to understand as a part of a larger whole, hence it is put together with other things, not taken apart. We need to consider the parts not on their own, but in relation to the whole. We need to identify the contours of a system.
“Matter tells space how to curve, and curved space tells matter how to move.” ~ John WheelerWe describe the space itself, not its features. Features of the system will emerge from the space if you did this. In the second step of synthesis, we explain the behavior of the larger whole. So if we are trying to understand a business, we have to first explain the market system the business is a part of. In the third step of synthesis, the behavior or properties of a part is explained by revealing its role or function in the system that contains it.
As an example, consider the problem domain of a new e-commerce web site. The objects in this domain include products, customers, orders, and payment methods. These objects have properties such as product name, price, quantity, customer name, address, payment type, and so on. The relations between these objects include:
- Products and customers: A customer can purchase one or more products.
- Products and orders: An order contains one or more products.
- Orders and customers: An order is made by a customer.
- Orders and payment methods: An order requires a payment method to be completed.
By considering the objects, properties, and relations in this problem domain, a software developer can synthesize a new e-commerce web site that better captures the underlying reality of the problem. For example, the developer may decide to implement a feature that allows customers to easily view their purchase history, based on the relation between orders and customers. Or the developer may decide to implement a feature that displays related products, based on the relation between products.
Analysis
Analysis is a systematic and detailed examination of a subject or issue, with the aim of breaking it down into its component parts, understanding their relationships and interconnections, and examining their properties and characteristics. The goal of analysis is to gain a deeper understanding of the subject being studied and to identify patterns, structures, and relationships that are not immediately apparent.
In the context of software development, analysis refers to the process of evaluating and breaking down a problem or system into its component parts in order to understand its requirements, constraints, and design considerations. This information can then be used to inform the design and development of a new system or solution that better meets the needs and requirements of the problem domain.
Analysis means obtaining answers to known questions.
Let's consider the objects "Products" and "Customers" in the problem domain of an e-commerce web site, and the relation between them, which is "A customer can purchase one or more products."
To analyze these obkects and their relation, we can start by asking questions about their properties and the ways in which they interact. For example:
- What properties do products have? Some properties may include name, description, price, image, category, brand, and so on.
- What properties do customers have? Some properties may include name, email, address, payment information, purchase history, and so on.
- How does the relation between products and customers affect the design of the e-commerce web site? The relation between products and customers may influence the way that the site is structured, the features that it provides, and the information that is displayed to users.
Based on this analysis, we can synthesize a solution that better captures the underlying reality of the problem domain. For example, the solution may include features such as:
- A product catalog that allows customers to easily browse and search for products.
- A customer account system that stores and manages customer information, such as purchase history and payment information.
- A checkout process that allows customers to purchase products and manage their orders.
By considering the objects, properties, and relations in the problem domain, and synthesizing a solution based on this analysis, we can create an e-commerce web site that provides a better experience for customers and meets their needs more effectively.
Synthesis vs. Analysis
Analysis yields information about the structure of a system, and how it works. That's knowledge, know-how, not understanding. If we apply analysis to a system, we begin by breaking it apart and we lose all of its essential properties. We cannot explain the behavior of a system by analysis. Analysis cannot produce understanding of systems. We cannot examine a system by looking at its parts, you must look at it as a part of a larger whole. We can reveal its structure and all individual actions, but we can't say why it works the way it does. Explanation never lies inside the system, it lies outside.
Unfortunately, analysis and thought are frequently treated as synonyms, but analysis is only one way of thinking; synthesis is another. We should use the synthesis to achieve a whole system's perspective. Synthesis does not mean “studying a whole as a synthesis of its parts” but “studying a whole as part of a larger system.” Synthesis yields understanding, analysis yields knowledge, and it was that distinction that was critical for the emergence of the systems thinking. It uses both, but to understand systems, particularly those that involve people, synthetic thinking is required.
Discovery kanban board
For our products we strive to have the proper combination of complex, complicated and clear options.
We can manage the movement of user stories on a kanban board as presented on Fig. 16.
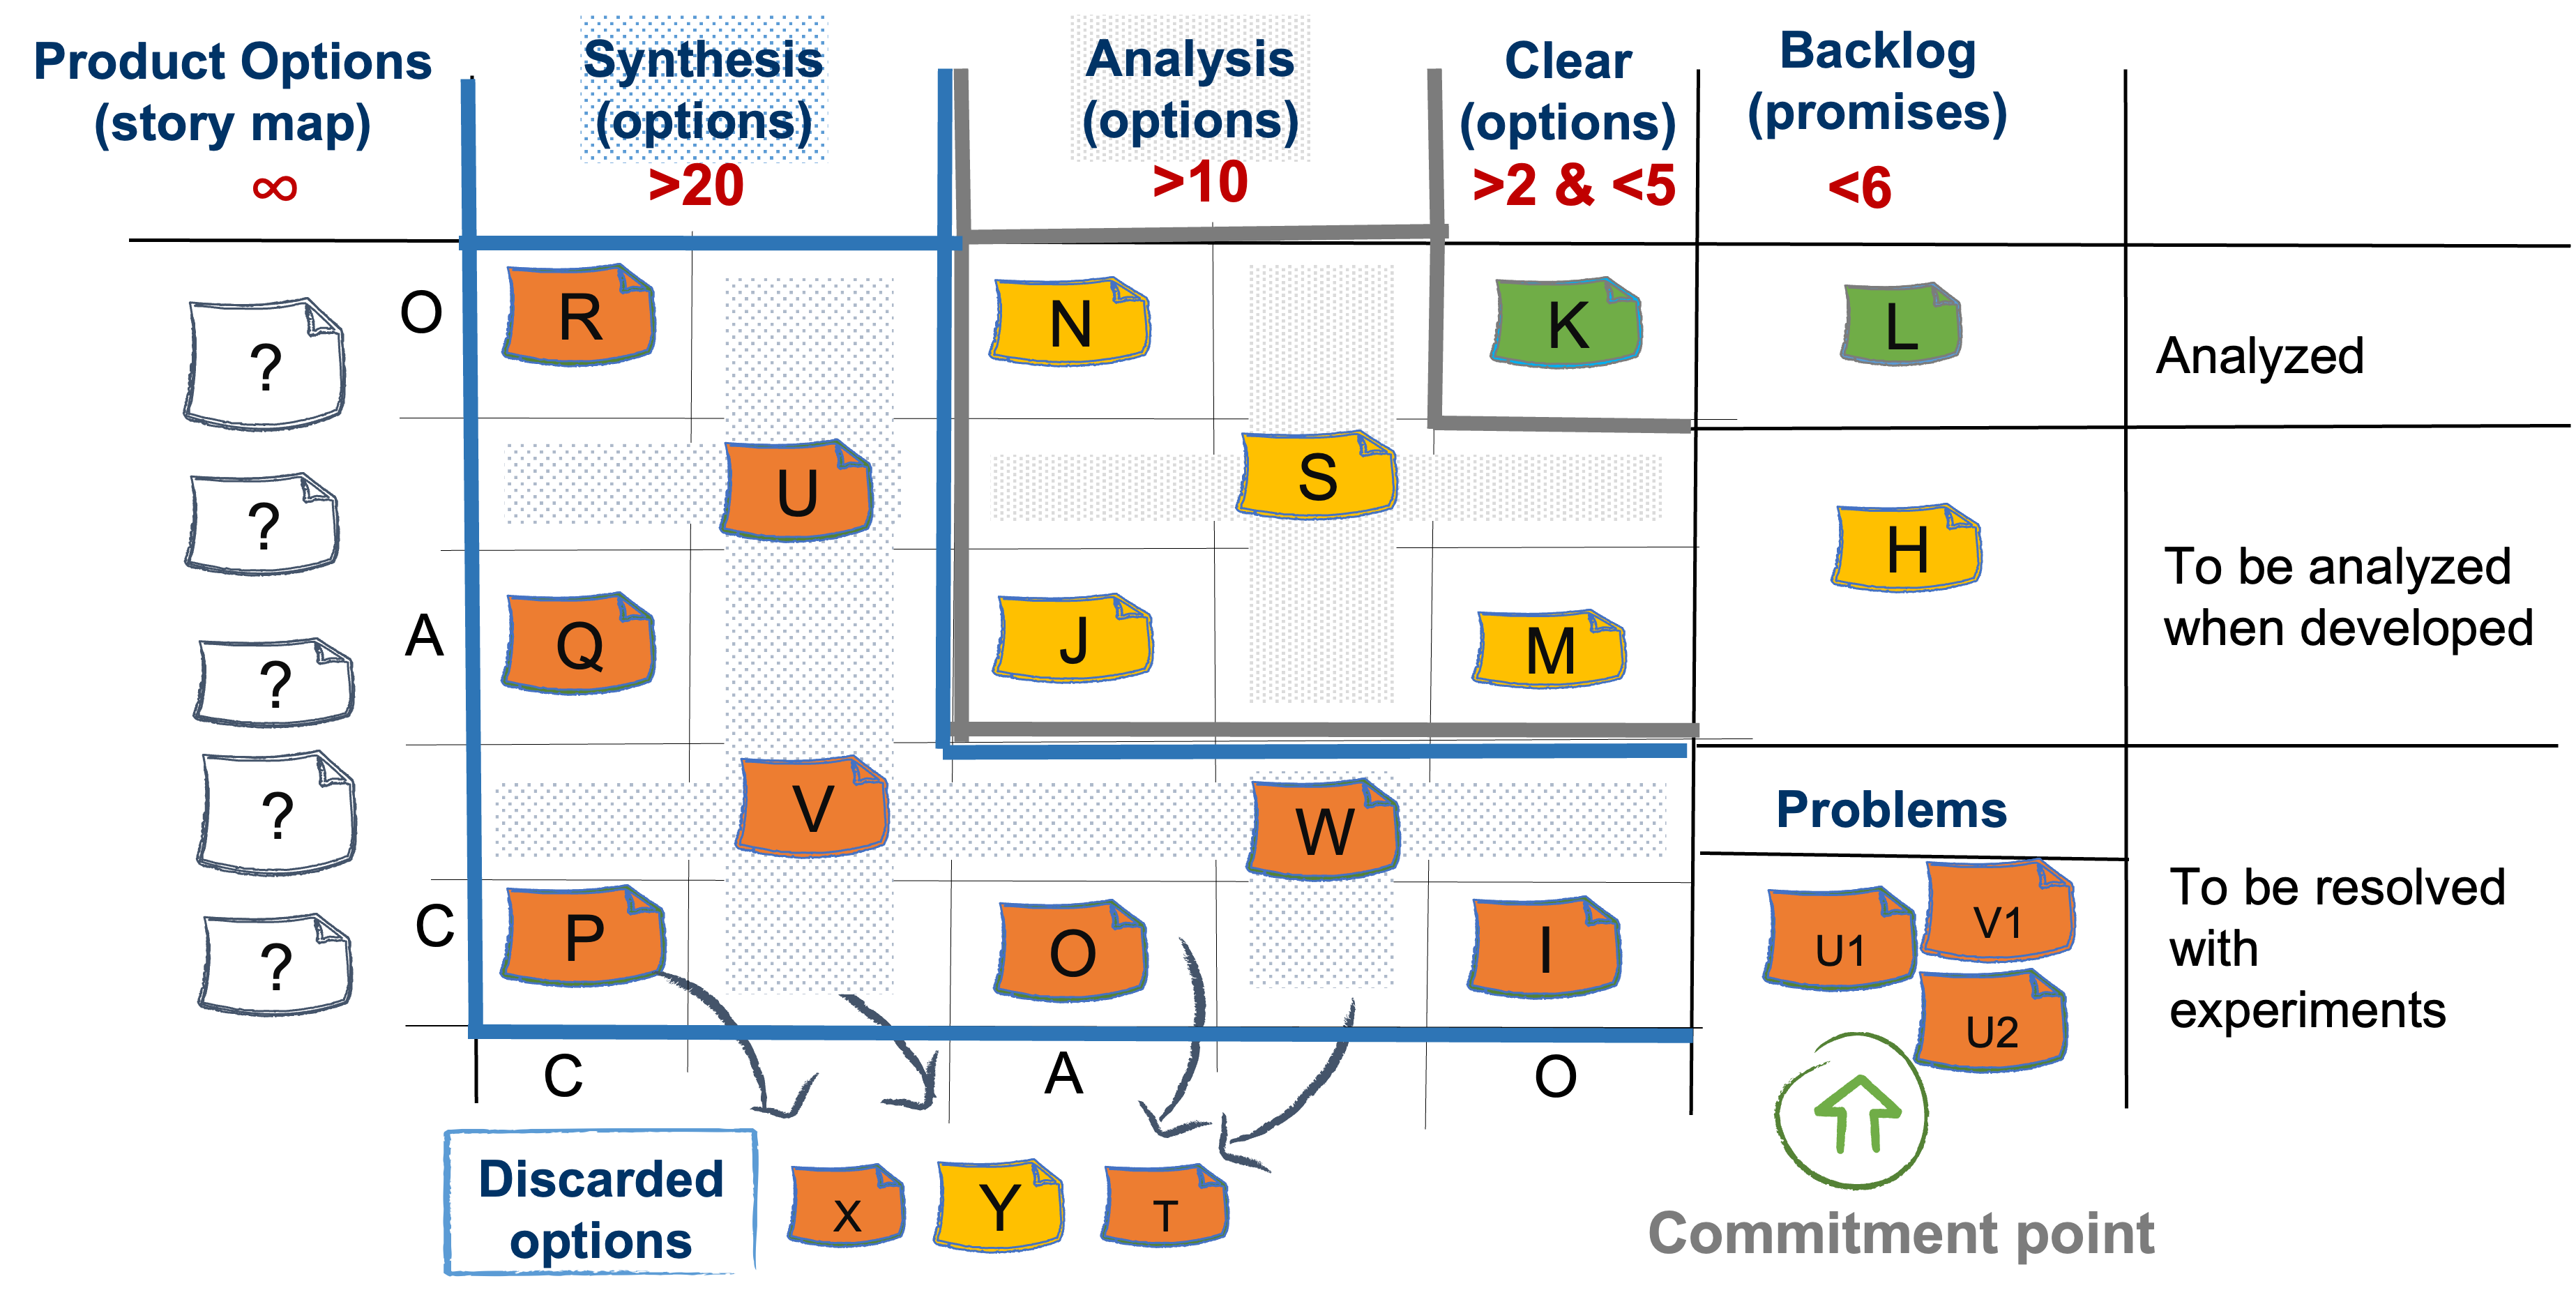
On the board we have the Knowledge discovery funnel as the Discovery kanban board[7]. The requests for new things to be developed enter here. We'll call them options in order to show that it is not mandatory for them to be delivered at all.
Cards in orange represent complex options. Each complex option needs to go through synthesis and analysis in order to enter the Backlog part of the board. Complex options enter the funnel and get out as either complicated or clear following the below workflow on Figure 17.
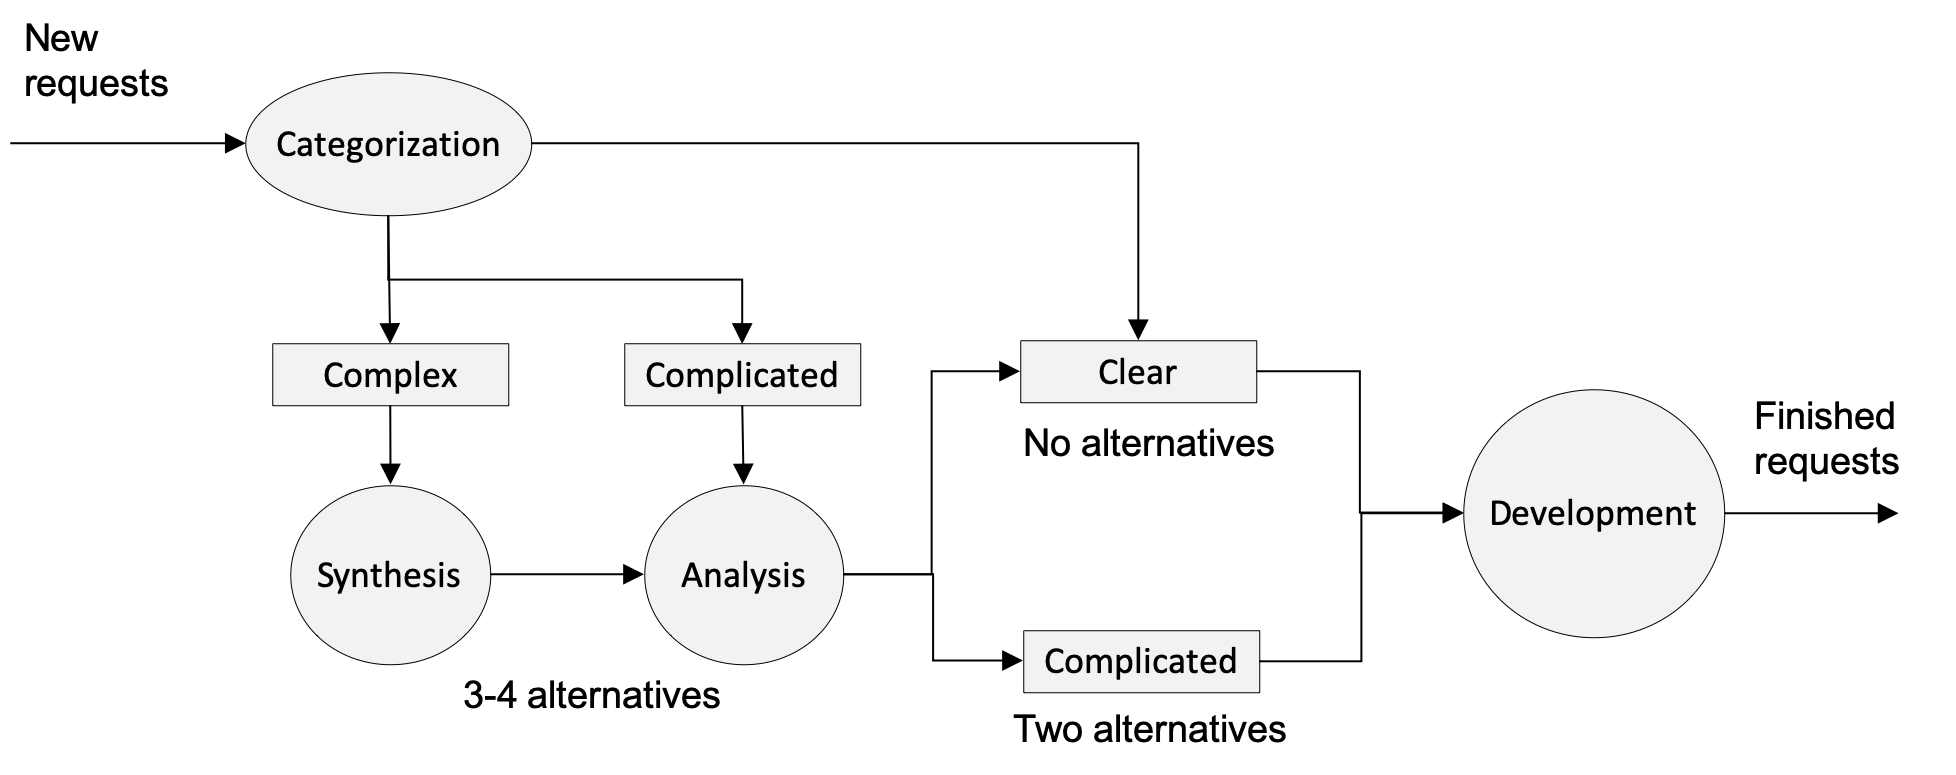
Here is how the process works. First step is to take one option and categorize it. Categorization means we place it at the proper cell in the complexity profile of the Discovery board. As we saw earlier the complexity profile acts like a funnel.
Cards in green are clear options and can directly enter delivery.
Cards in amber are complicated options. It is not mandatory for all complicated options to become clear. A complicated option may enter delivery when it is considered that the analysis can be done during the delivery. That could happen for two reasons:
- When an option is clear from client perspective and complicated from capability perspective because there are a couple of alternatives how to implement it. The choice of an alternative can be left to the delivery system to make.
- When the option is complicated from client perspective because there are small details to be decided e.g. text message content, colors etc. Those can be cleared during delivery.
An option cannot enter the delivery system directly from Synthesis. A complex option should never exit the funnel, because it will clutter the delivery process. The delivery system is not supposed to do the work of the discovery system, because the delivery system has to work only on clear goals.
It is also possible on the complexity profile cards to move “backwards” say from complicated to complex. For example, we have a complicated option with a couple of alternatives about what to do. The client is considering which alternative to choose when new information from the market arrives and suddenly none of the alternatives is viable anymore. The client is back to the spot where they don't know what they want. The option is again complex.
Kanban system
The WIP limits are set at the top of each column. The numbers show the minimum number of options that need to be present at any given time. For instance, the column Synthesis has to have at least 20 options. They could be a hundred but never less than twenty. We see that the minimum values get smaller as we move to Analysis and Clear. This is because we are operating a funnel. We need a lot of options to enter the funnel because only a fraction of them will leave it as delivery promises. We see that the funnel starts at 20, then becomes 10 and ends in 2-5 options. Why do we want to have 20 complex and only between 2 and 5 clear options? Because clear things are obvious for everybody else and hence not valuable to work on.
We have a pull system on the Discovery side. That means if we don't have at least 20 complex options we have to do some work and find new ones. But the low limit on Clear will prevent us from picking easy-to-find but non-valuable clear options. We don't want non-valuable, clear options to flood the delivery system with non-valuable delivery requests.
Experiments
Both analysis and synthesis of an option may require some experiments or probes e.g. a Proof of Concept (PoC).
How do we show on the board that we probe for an option? We put the option card in a transition cell between CC and AA on the Discovery board. The experiments are tracked on a Experiments kanban board. If the experiment provides the missing information then the option card is moved into an AA cell on the Discovery board. If not then it stays in transition. It could be the case that it is decided to abandon the option. That is presented as the “Discarded options” area of the kanban board.
Action and performance feedback
After a clear goal for a user story has been established i.e. what to do and how to do it, it is important to ensure that each individual developer has a balance between their abilities and the complexity of the user story. This balance should be on a personal, individual level, with a slight tilt towards challenges. To achieve this, we aim to have a missing information between 2 and 4 bits, which corresponds to user stories that are considered "complicated" and require some analysis by the developers.
To ensure that the balance is achieved, it is important to have a way to measure the complexity of a user story and personal abilities using bits of information. However, measuring the perplexity a developer feels when looking at a user story is difficult, if not impossible.
One way to evaluate whether a developer's abilities and work complexity were in balance is by measuring the Knowledge Discovery Efficiency (KEDE) after the work has been completed, as explained here By analyzing KEDE, we can determine whether the project management process is making developers happy. If it is not, we can make changes to our process accordingly.
Development kanban board
We can visualize and manage the Knowledge Application work on a kanban board.
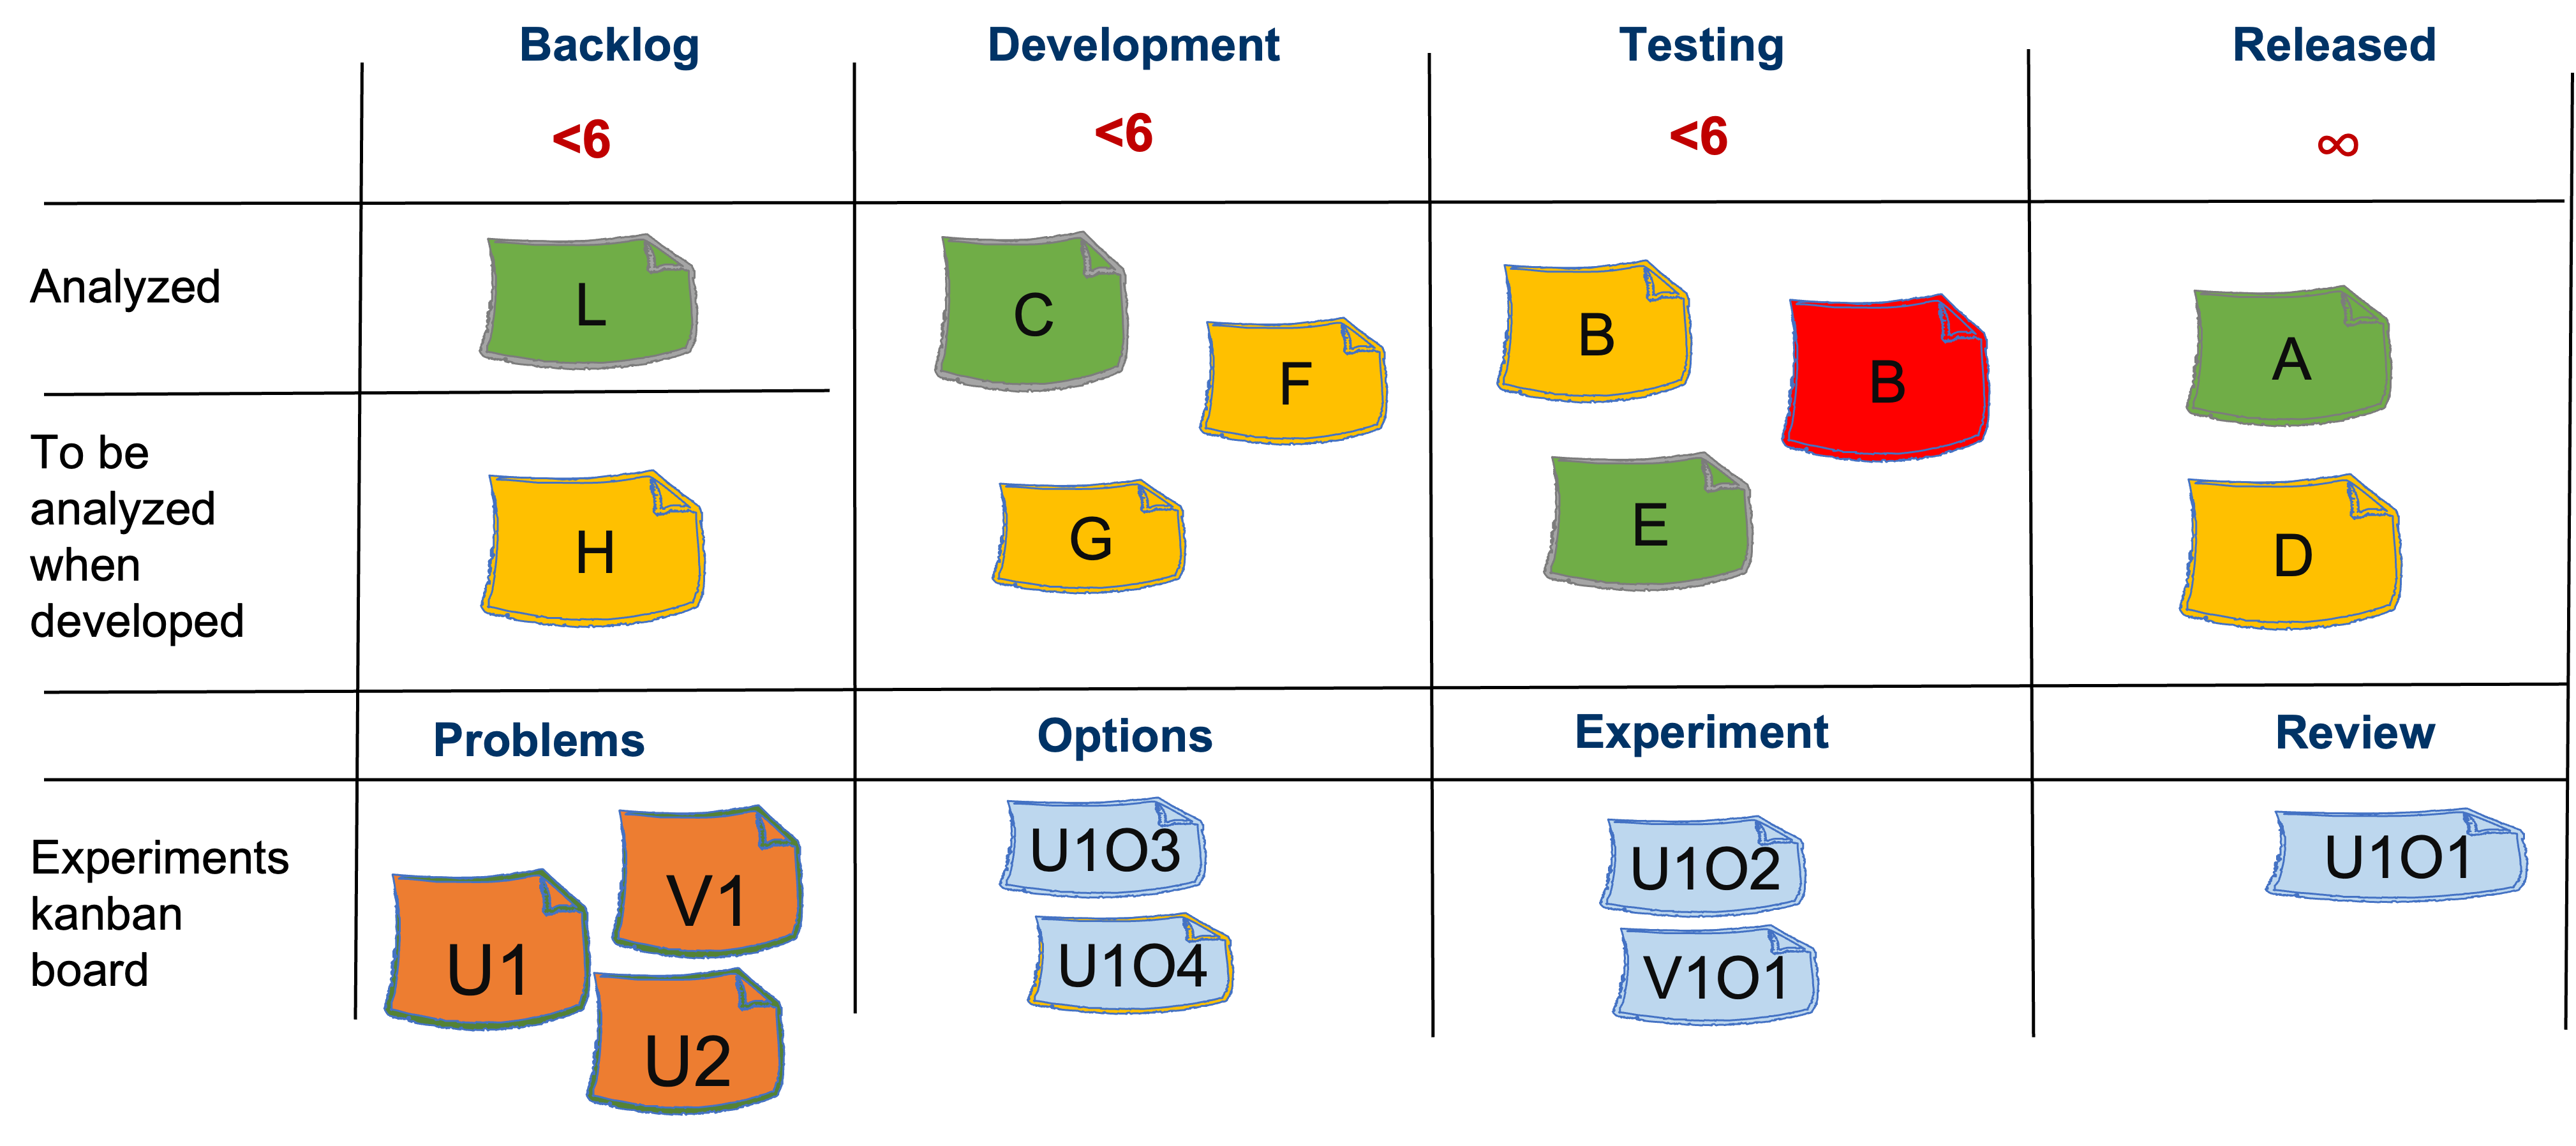
Experiments kanban board
How do we show on the board that we probe for an option? For that we use the Experiments kanban board presented at the bottom. This kanban board can be physically detached from the Delivery kanban board. A new experiment card is placed in the Problems column in the lower left hand corner of Figure 18. The experiment card follows the Problems - Options - Experiment - Review path.
Here is how the experiments are worked and tracked on the Experiments kanban board. We can use a great approach called POPCORN Flow[9].
Once we pick the problem we plan to focus on, we move the card to the “Options” column, which is next to the right of the “Problems” column. It is unlikely that a problem is so simple that there is only one option available to solve it. Thus, the problem that made its way into the "Options" column should be split into several possible options for solving it.
We then choose one option that seems to promise the best outcome. We move that option to the "Experiment" column to the right. Each experiment should be defined with three attributes:
- Action: which action is the experiment proposing?
- Duration: how long is the experiment expected to run?
- Expectation: What is the expected desired outcome of the experiment?
We can have additional columns like for the committed, worked on and finished experiments. We don't show that here because that is another large topic.
When the experiment is finished, it moves to the column to the right – “Review”. During the review, we ask some questions, such as:
- What did we expect to happen (i.e., the hypothesis)?
- What had actually happened?
- What did we learn?
- What opportunity do we perceive?
The problems, options and experiments must obey the constraints of the Work in Progress (WiP) for the delivery team.
End-to-end kanban board
We can manage the movement of user stories on a End-to-End kanban board as presented on Figure 19.
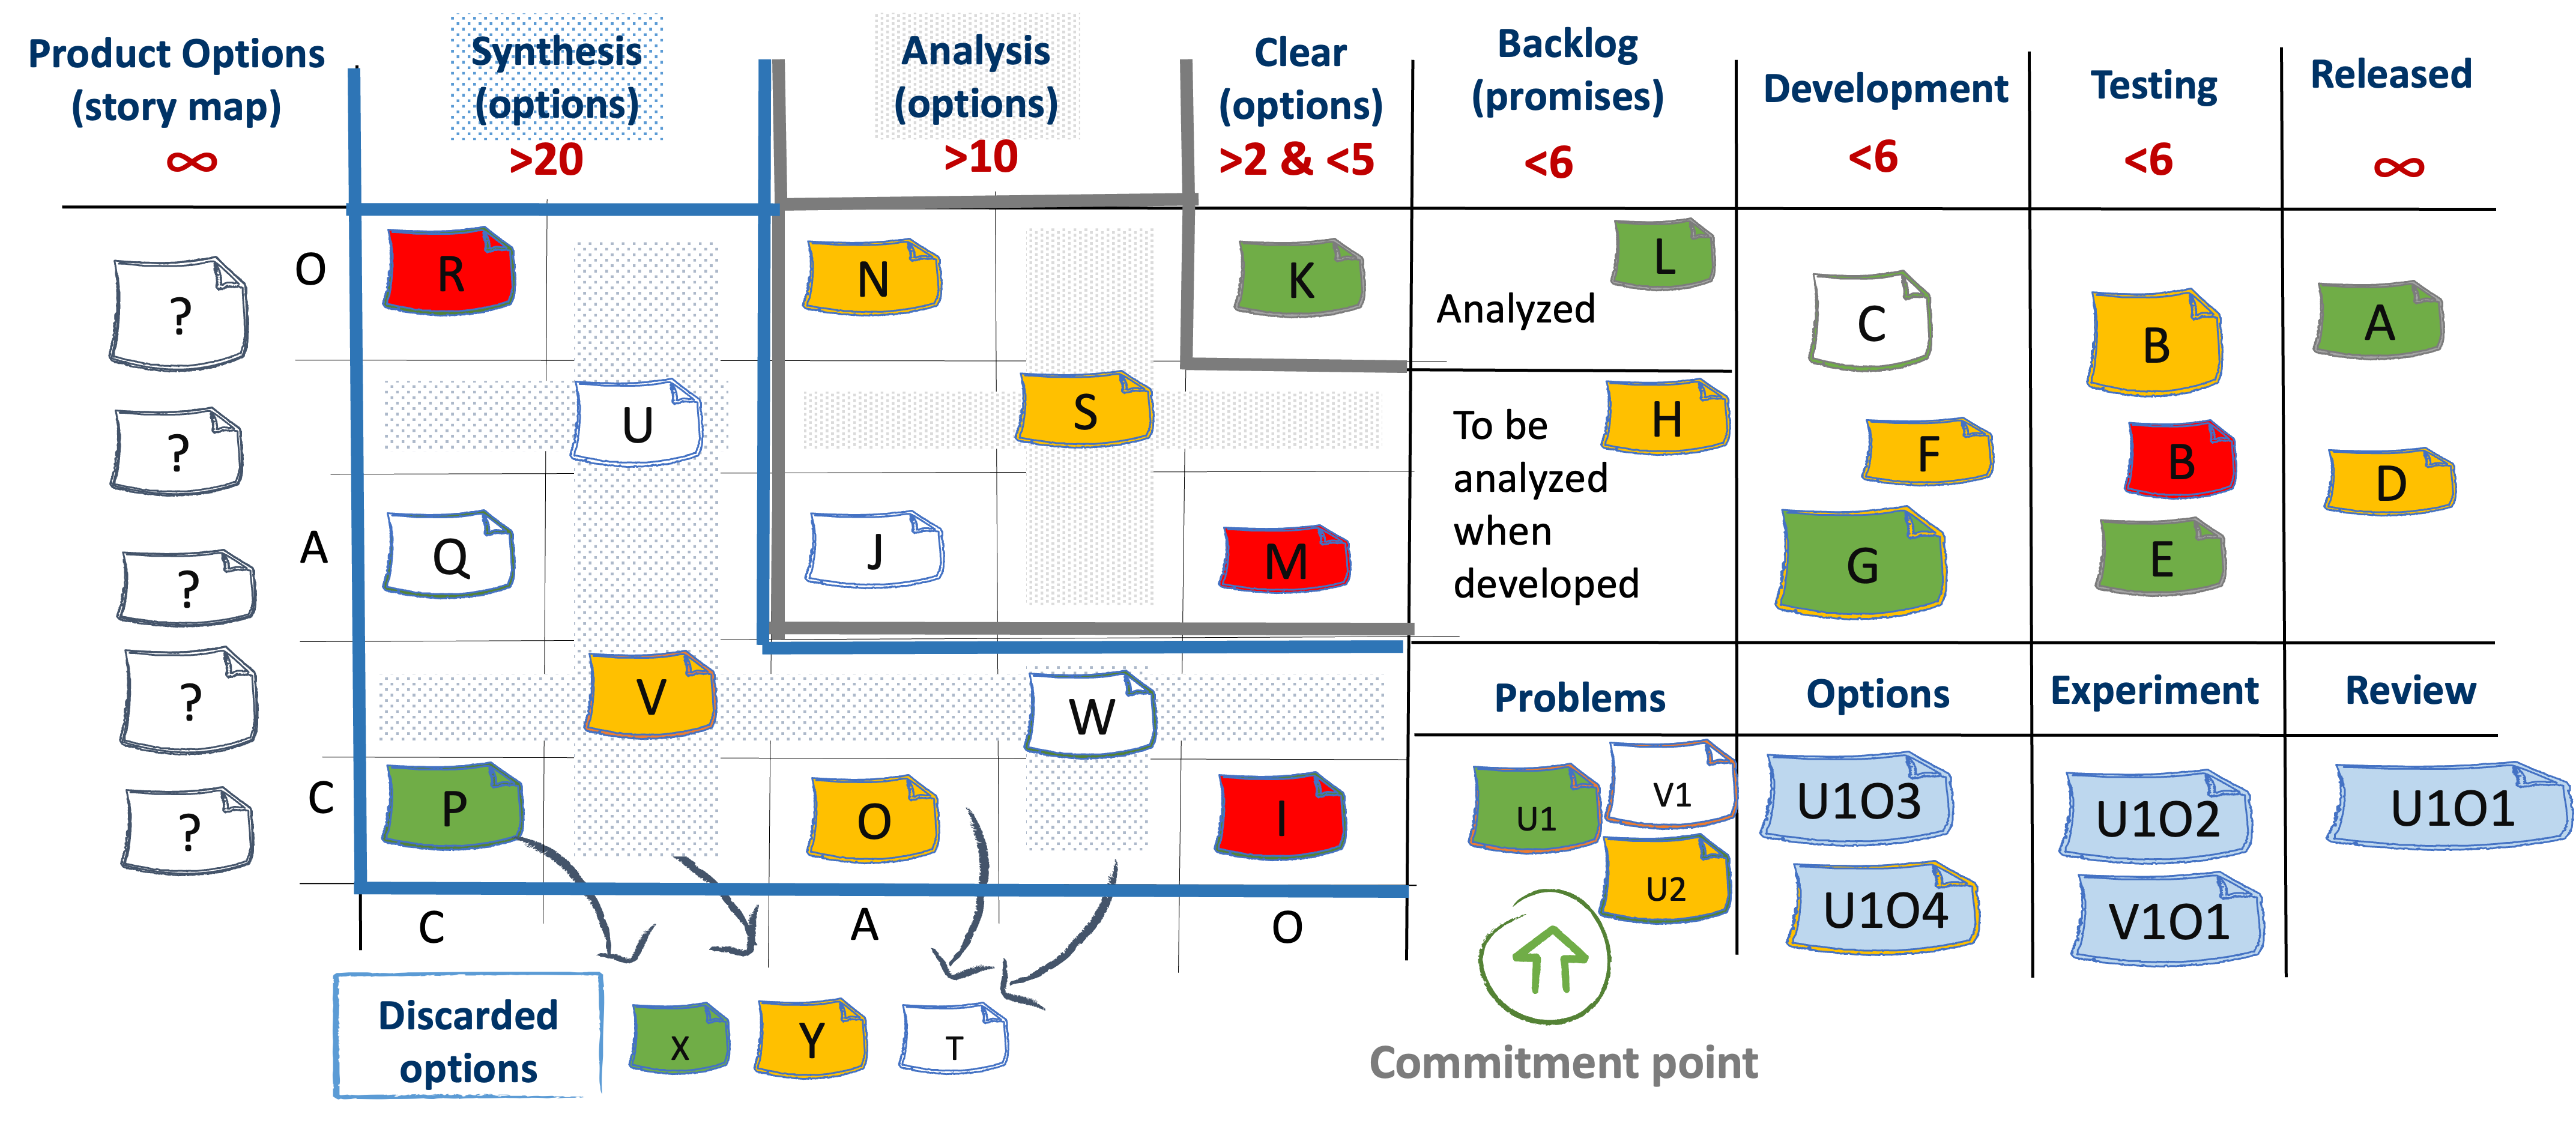
The left hand Discovery part of the board tracks exploring options. The right hand Delivery part of the board tracks promises to deliver.
On the board an option can leave the discovery part and enter the delivery part either from Analysis or from Clear. Cards in green are clear and can directly enter delivery.
Let's not forget that in the delivery part we are dealing with promises. Promises should not be canceled because the delivery system has a limited and expensive capacity. In the discovery part we are dealing with options. Options by definition can be discarded. That is presented as the “Discarded options” area of the kanban board.
Staffing
The process presented here would shine a bright, glaringly light on what people did not know. This could quite uncomfortable for many and they could responded as many of us would do, by avoiding it altogether and working on something on which they could "make progress," on something they knew. For most of us, given a straight choice of working on something that is easy, something that plays to our strengths and demonstrates how competent we are, and working on something that is hard, something we have no clue about, and ultimately shows us and everyone else just how little we understand about the system, we are probably going to choose the former[12]. This is not only a natural, human tendency; it is also exacerbated by some of the pressures we experience in development, the desire to demonstrate "progress" and most of all by the organization's and management's expectation of producing a product[12].
The bottom line is always that processes do not do the work, people do. Not only do they come with their own proprietary thought processes and experience, they also come with a host of other characteristics: motivation, ethical basis, fortitude, helpfulness, resourcefulness, rapidity of thought, capacity to give and receive feedback, etc. These characteristics may be skills or they may be capabilities. These are not the same thing. People are created differently and through application of their skills, through life experience, and through their inclinations, end up with different capabilities. But the source of the problem is not in differences. In fact, it is the differences rather than the similarities that make project teams effective[12].
We need different people to work on different entries in the complexity profile. The difference is the level of perplexity they can handle both from Capability and Client perspectives. For instance:
- if the problem is clear then we need a junior person, who can read a recipe book and follow it. She will need stable requirements and all the exact tools and technologies from the book.
- If the problem is complex we need a senior person, who can cope without a recipe, with changing requirements and with whatever is available in terms of tools and technologies.
When we need to adapt we need more diversity in the system because then we've got more evolutionary capacity. It's not a coincidence that for the living organisms the mutation rates increase under stress - more diversity more, adaptability. The requisite diversity is the optimal level of diversity for the context we are in. Diversity means inefficiency an organization needs to have. If overfocused on efficiency the organization loses adaptive capacity.
Diversity can help us answer the question posed by Brooks' Law[13]. The question is, "if I have a project that is running late, should I add people to it to speed it up?" Our answer is, "it depends on how you manage knowledge discvery." If the project scope is partitioned into work items classified using the Complexity Profile explained here, then you'll have Clear and Complicated work that can be given to the newcomers. That will free up your present developers to do more Complex work clarifying. Then the answer is "yes." The answer would be "No" if the addition of people will require that your current staff take time away from being productive to instruct the newcomers, resulting in a net drop in productivity. Hence, Brooks' Law: adding manpower to a late project makes it later.
Initial vs. Continuous Discovery
The Initial Knowledge Discovery runs without Delivery i.e Knowledge application. It may result in a Product Vision, Product Strategy, and initially validated Business Model that has a chance of achieving the Product-Makret Fit. The Initial Knowledge Discovery can serve as a base for investment decisions.
After the Initial Knowledge Discovery we establish a regular feedback loop to continuously revisit and update the categorization of the user stories in progress and categorize the newly added user stories.
It needs to be emphasized that we don't get a full process specification, and analyze it all before starting delivery. Instead, we do the Initial Knowledge Discovery oly to have the categories for the project defined. For that we need a small subset of the requirements for the project. After that we run a continuous iterative process that flows through Knowledge Discovery and Delivery user stories in small batches.
If the project team is a Scrum team then the batch could be a Sprint backlog.
Product management
The Knowledge Discovery can be run by Product managers and Product owners. Then it can be called Product Discovery.
For each option in the Product Options part of the End-to-end board the following questions need to be asked.
- Value. Will it create value for the customers?
- Usability. Will users figure out how to use it?
- Feasibility. Can it be done?
- Ethic. Should we do it?
Dual-Track Agile
Jeff Patton and others in the Agile product space have been big proponents of an approach called Dual-Track Development or Dual-Track Agile. In that setup, there are two streams that run in parallel:
- Product Discovery - to discover the product to build
- Product Delivery - to deliver that product to the market
The difference with the approach presented in this article is that here we don't have two activities in parallel. Instead we have two activities Discovery and Deliver running sequentially, but at their own pace and with their own variation.
Works Cited
1. Goldratt, E. M. (2012). The Goal: A Process of Ongoing Improvement - 30th Anniversary Edition (3rd edition). North River Press.
2. Bakardzhiev, D. (2016). Adaptable or Predictable? Strive for Both - Be Predictably Adaptable! InfoQ. https://www.infoq.com/articles/predictably-adaptable/
3. Schaffer, O. 2013. Crafting Fun User Experiences: A Method to Facilitate Flow. Human Factors International Whitepaper. Retrieved from: http://www.humanfactors.com/whitepapers/crafting_fun_ux.asp
4. D. Snowden (2019), Cynefin & perception, https://thecynefin.co/cynefin-perception/
5. Kant, S.-L. (2014). The Distinction and Relationship between Ontology and Epistemology: Does It Matter?. Politikon: The IAPSS Journal of Political Science, 24, 68-85. https://doi.org/10.22151/politikon.24.4
6. Anderson, D. J., & Carmichael, A. (2016). Essential Kanban Condensed. Lean-Kanban University.
7. Steyaert, P. (2018). Essential Upstream Kanban (Illustrated edition). Lean-Kanban University.
8. Kurtz, C. F., & Snowden, D. J. (2003). The new dynamics of strategy: Sense-making in a complex and complicated world. IBM SYSTEMS JOURNAL, 42(3), 22.
9. Q&A with Claudio Perrone on PopcornFlow
10. Dual Track Development is not Duel Track
11. The Mindset That Kills Product Thinking
12. Armour, P.G. (2003). The Laws of Software Process, Auerbach
13. Brooks, F. P. (1995). The mythical man-month: Essays on software engineering. Addison-Wesley
How to cite:
Bakardzhiev D.V. (2022) Improve productivity and happiness on a software development project. https://docs.kedehub.io/kede-improvements/knowledge-discovery-management.html
Getting started


