Evaluating Copilot's Impact on Productivity
A Knowledge-centric approach
Related Articles
Abstract
In software development, success hinges on bridging the gap between individual expertise and the knowledge needed to achieve results.
GitHub Copilot is an AI-powered code completion tool developed by GitHub in collaboration with OpenAI. It is designed to assist developers by providing suggestions for code and functions within various programming environments.
Despite its potential to boost productivity significantly, the actual effectiveness of Copilot in enhancing developer productivity remains a topic of much debate and speculation. The difference between what people expect from Copilot and what it actually delivers is notable.
As such, there is a pressing need for organizations to validate Copilot's impact on enhancing developer experience and realizing talent potential, as well as to quantify its financial effectiveness.
To address this challenge, we suggest adopting a Knowledge-centric Perspective on software development. This means seeing knowledge as the fuel that drives the software development engine. Central to this perspective is the concept of the 'knowledge gap' - the difference between what a developer knows and what they need to know to effectively complete tasks. This gap directly influences developer's' work experience, talent utilization and productivity.
Viewed from the Knowledge-centric Perspective perspective, Copilot is a source of knowledge. It competes with prior knowledge, StackOverflow, ChatGPT, Google Search, books, and advice from colleagues.
What Copilot fundamentally does is aid developers in efficiently bridging the knowledge gap between what they know and what they need to know to effectively complete tasks. In this way, Copilot might contribute to a flatter learning curve for developers by exposing them to best practices and new coding patterns in their work context, as opposed to the more passive learning that might occur when consulting documentation or forums.
These metrics capture the nuanced ways Copilot could influence the software development process, from reducing cognitive load to facilitating collaboration and reducing delivery times:
- How to prove the Impact on Delivery Time: It is an assumption that Copilot saves time until it is proven that developers give back any saved time from using Copilot back to the org
- How to measure the impact of Copilot on Developer Eficiency: Measures how much of the required knowledge for completing tasks is covered by the prior knowledge.
- How to measure the impact of Copilot on Collaboration: Measures how the number of contributing software developers affects the efficiency of a knowledge discovery process.
- How to measure the impact of Copilot on Cognitive Load: Measures how many potential solutions a developer considers for a particular problem.
- How to measure the impact of Copilot on Happiness: Gauges if developers are in a 'flow' state, where they're fully engaged and challenged. This state is achieved when there is a balance between individual capability and work complexity, with a slight inclination towards challenges. Imagine a scale: on one side is the required knowledge and on the other is the prior knowledge. If they are in balance a developer is in a state of Flow.
- How to measure the impact of Copilot on Productivity: Measures the ratio between value delivered and the knowledge developers needed to discover to deliver that value. High productivity is achieved when less knowledge needs to be discovered for an outcome to be produced.
- How to measure the impact of Copilot on Rework: Quantifies the Information Loss Rate, which is the ratio of lost bits of information to the total perceived information. An increased 'information loss rate' signals a higher rate of errors and more time and effort wasted on rework.
Those metrics allow us to test the below hypotheses:
- Copilot improves the capability of both individual developers and teams.
- Copilot improves developer experience in terms of Happiness i.e. being in the Flow state.
- Copilot improves developer experience by reducing Cognitive load.
- Copilot improves Delivery time in the long run.
- Copilot improves Collaboration by breaking down the walls between source code repositories.
- Copilot improves Productivity by speeding up knowledge discovery.
Those hypotheses show our belief that the true value of Copilot extends beyond mere time-saving. Copilot can contribute to improved collaboration, increased productivity, reduced waste, decreased cognitive load, and foster an environment where developers can achieve a state of Flow.
Introduction
GitHub Copilot is an AI-powered code completion tool developed by GitHub in collaboration with OpenAI. It is designed to assist developers by providing suggestions for code and functions within various programming environments. Copilot uses a neural code synthesis approach to code completion to generate suggestions by using a language model to predict what the user might type next (the completion) from the context of what they are working on at the moment (the prompt)[9]. It's a leap forward in terms of intelligent coding assistance, offering more than just auto-completion; it's about understanding and generating contextually relevant code.
Despite these promising features, the actual effectiveness of GitHub Copilot in enhancing developer productivity remains a topic of much debate and speculation. There's a gap between the perceived potential of such tools and their real-world impact. Quantifying this impact is crucial for several reasons:
- For developers, it's important to understand how such tools can help them realize their full potential and enjoy their work.
- For organizations, it's important to have empirical data to justify the integration of Copilot into their workflows. Without concrete evidence, it's challenging to gauge whether the tool is a worthy investment.
- For researchers, insights gained from such an analysis can inform the development of future AI-based tools, ensuring they are more aligned with the needs of developers and organizations.
In this paper, we adopt a Knowledge-centric approach to evaluate the impact of GitHub Copilot on aspects of software development such as developer productivity, work experience, and talent utilization. This analysis aims to provide a nuanced understanding of how such AI-powered tools influence the software development process, offering insights that are valuable for further research. Additionally, our findings aim to contribute to a broader discourse on the practical value and effectiveness of AI tools like Copilot, not only in enhancing productivity but also in enriching the overall software development experience
Definitions
- Acceptance rate is the fraction of completions shown to the developer that are subsequently accepted for inclusion in the source file[1].
All other definitions are available in the KEDE Glossary
Methodology
This section outlines our approach to analyzing Copilot's impact. It details the key concepts used. Here, we explain how we theoretically assess the potential influence of Copilot without relying on empirical data.
Introducing the Knowledge-centric perspective
To evaluate the impact of Copilot on developer productivity, we adopt the Knowledge-centric perspective on software development. This approach considers knowledge as the fuel that drives the software development engine. Central to this perspective is the concept of the 'knowledge gap' - the difference between what a developer knows and what they need to know to effectively complete tasks. This gap directly influences developer's' work experience, talent utilization and productivity.
Bridging this knowledge gap is a dynamic process, defined as the Knowledge Discovery Process. This process is about discovering and transforming invisible knowledge into visible, tangible output. It is like a 'black box': its internal mechanisms may not be fully transparent, but the results it produces are clearly observable.
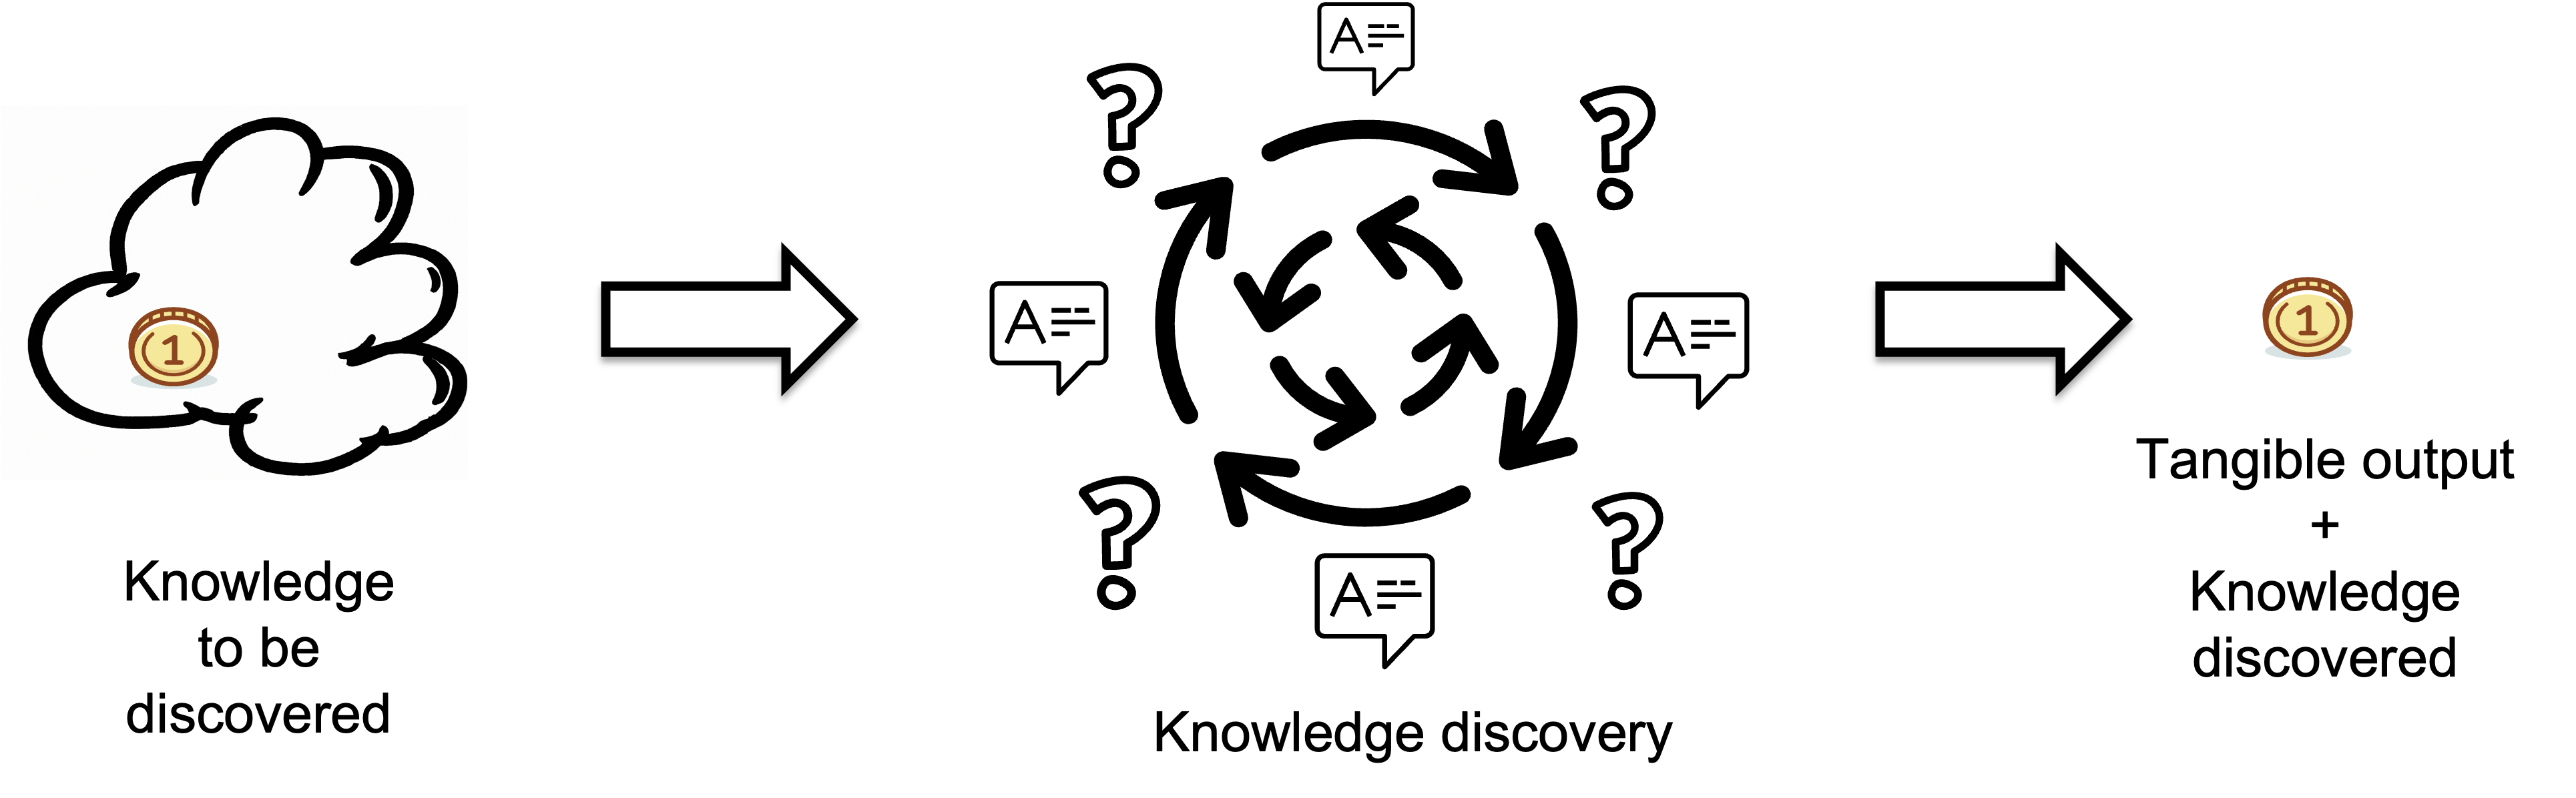
The tangible output contains the knowledge gained, encapsulating new information acquired through the process. Conversely, the input represents the missing knowledge or information that needs to be discovered. Knowledge discovery begins by identifying the gaps in understanding, essentially tackling the question, 'What do we need to know?' This highlights the gaps in understanding or information that need to be filled. By pinpointing the unknown – the questions without answers – the knowledge discovery process seeks to bridge these gaps. The knowledge discovery process is complete when the missing information is found and applied to the task at hand, thereby closing the knowledge gap.
Critical to illuminating the impact of the knowledge gaps on the developer work experience is the concept of Flow, as defined by psychologist Mihaly Csikszentmihalyit[4]. Flow is a state of heightened focus and immersion in activities, crucial for optimizing productivity and job satisfaction. Achieving Flow requires balancing the complexity of tasks with the individual capabilities of the developer[5]. When individual capability significantly exceeds task complexity, the knowledge gap becomes too narrow, leading to wasted potential and boredom. On the other hand, if task complexity surpasses individual capability, the knowledge gap widens, leading to stress and low productivity. A well-balanced gap keeps developers in the Flow state, fully immersed and focused on their work, leading to higher productivity and job satisfaction.
The Knowledge-centric perspective is a systems perspective, because it takes into account all of the behaviors of a system as a whole in the context of its ecosystem in which it operates. This includes team dynamics, organizational knowledge resources, development tools, and the overall work environment. Understanding and optimizing these systemic elements are essential for facilitating effective knowledge discovery and helping developers maintain a state of Flow. This systemic view underlines the importance of considering the interconnectedness of individual, team, and organizational factors in enhancing developer productivity and work experience.
A crucial aspect of our approach involves measuring the knowledge gaps that developers bridge in completing tasks, quantified in bits of information. This measurement approach allows for meaningful comparisons across different contexts, programming languages, and applications. It provides a tangible metric to assess the effectiveness of knowledge acquisition and application in the software development process.
Organizational Knowledge Resources
A critical component of the Knowledge-centric perspective is the effective utilization and management of organizational knowledge resources. These resources encompass the existing knowledge, expertise, and insights available within an organization. They include not only formal documentation like databases, manuals, and standard operating procedures but also the tacit knowledge that resides in the experience and skills of individual team members.
There are two categories of organizational knowledge resources: those providing knowledge alone versus those offering both knowledge and tangible output. In the context of software development, tools like GitHub Copilot belong to the second category as they provide immediate, actionable output in addition to knowledge.
By providing context-relevant code suggestions, Copilot aids in transforming the 'invisible' knowledge into 'visible' and tangible output (working code).
As an AI tool that provides coding suggestions and assists in code generation, Copilot effectively acts as an extension of an organization's knowledge base, particularly in the realm of coding practices and patterns.
In bridging knowledge gaps, Copilot serves as an interactive repository of coding knowledge. It offers developers immediate access to a vast array of coding solutions and examples, gleaned from the extensive data it has been trained on. This directly enhances a developer's ability to tackle complex tasks and find efficient solutions, thereby reducing the time and cognitive effort required for research and trial-and-error.
Importantly, Copilot is a source only of "How to do" knowledge. The "What to do" knowledge is still the responsibility of the developer to discover.
Knowledge Discovery Efficiency (KEDE)
If we want to quantify the balance between individual capabilities and task complexity we can use Knowledge Discovery Efficiency (KEDE).
Imagine a scale: on one side is the required knowledge and on the other is the prior knowledge. They will be balanced if they are equal, implying that the knowledge to be discovered equals zero. When balanced, no further knowledge is needed; when imbalanced, knowledge acquisition is required.
This balance directly influences developers' efficiency, impacting their work experience and productivity.
KEDE functions much like a thermometer for an organization, observing it from the outside, akin to a black box. The mathematics underlying KEDE dictate that its values can range between 0 and 100.

- A KEDE near 0 indicates a significant knowledge gap or barriers to applying known solutions.
- A KEDE near 100 shows optimal preparation and application of prior knowledge.
- A typical expert software developer might score around 20, indicating a balance between using known methods and learning new ones.
KEDE can provide a reading of your organization's "temperature," but not diagnose the reason for a fever, so to speak. To understand the cause, organizations need a physician - someone who can delve inside the black box, like a manager or coach.
We don't consider usage based metrics
The most popular metrics used to measure the impact of Copilot are based on usage. The most common metrics are:
- Acceptance rate is the fraction of completions shown to the developer that are subsequently accepted for inclusion in the source file[1].
- Chars accepted is the number of characters accepted by the developer from Copilot's suggestions[1].
From a software development process perspective: measuring chars accepted is like measuring keystrokes. The chars may never get into a commit. Only commits represent tangible output for the process. The measures of persistence should account only for code committed. Measuring chars accepted is a good indicator about Copilot itself as a tool. That metric can serve its developers to get it better.
There are two issues with Contribution speed measure:.
- It is an intermediate result metric: This is because intermediate results aren't guaranteed to be comparable or to become outcomes at all e.g. the code suggestion may never be committed and subsequently deployed. Imposing such flawed models and metrics constrains learning, predictability, and improvement possibilities The only assured outcome is that they will lead to the typical problems like Goodhart's Law.
- It is a local measure: The idea that enhancing coding efficiency will automatically translate into system-level improvements is a common misconception. It's akin to believing that speeding up a single gear will make the entire machine work better. Enhancing the speed at which developers complete tasks, while valuable, addresses only a fragment of the broader system. In most scenarios, the bottlenecks and challenges at the system level extend far beyond individual task efficiency. Issues like organizational structure, communication breakdowns, and strategic misalignment often play a more significant role than the speed of coding.
- It is not a system level metric: the time saved is not only at individual level - the developer who uses Copilot, Time is saved for the senior developers who have to explain to the junior developers how to do things. Thus, we need to look at team level, for the whole organization.
- It is a measure of speed, not capability: Capability is about the efficient knowledge discovery, not about the time saved. The time saved is a byproduct of the knowledge discovered. The knowledge discovered is the fuel that drives the software development engine. The time saved is the result of the efficient use of that fuel.
From a Knowledge-Centric perspective, Copilot is just another source of knowledge. It competes with other sources of knowledge such as prior knowledge, StackOverflow, ChatGPT, Google Search, books, and co-workers. As such, Copilot is part of the knowledge discovery process inside a software development organization. Thus, its effectiveness cannot be measured in isolation. We need to measure the whole system instead.
Because of that in this essay we formulate hypotheses about the impact Copilot might have on developer productivity, work experience and talent utilization.
Evaluating Copilot's Impact
In this aretice, we are using a "conceptual analysis" approach, where we apply theoretical frameworks to logically explore the potential impacts of GitHub Copilot on software development productivity. This approach is valuable for setting the groundwork for future empirical studies and for providing a deep, theory-driven understanding of the topic. Specifically, we adopt the Knowledge-centric Perspective to evaluate the impact of GitHub Copilot on aspects of software development such as developer productivity, work experience, and talent utilization.
We shall look at both Short-Term and Long-Term gains. Short-Term gain from Copilot is saving time. That is relatively easy to measure. Long-Term gains are more difficult to quantify because they can be seen only after some time. That's why we will look for leading indicators, which will show us what to expect in the long-term. Since Copilot is a knowledge resource we will look for changes in the organizational knowledge.
Impact on Delivery Time
Copilot does save individual developer time for Coding tasks in controlled studies[10][11]. That is also obvious for all its users.
Thus, we present our working hypothesis about Copilot's impact on Delivery time:
- Hypothesis 4: Copilot improves Delivery time in the long run.
There is no proof that time saved by each individual is given back to the organization. Let's clarify what does 'giving back' mean. We assume developers would never spend company time on anything other than company work. That is not enough to assume that the time they save from using copilot will be returned to the organization. That is because developers must be able or rather be allowed by the system they work in to give the time back.
It is an assumption that Copilot saves time until it is proven that developers give back any saved time from using Copilot back to the org
Importantly, Copilot is a source only of "How to do" knowledge. The "What to do" knowledge is still the responsibility of the developer to discover. That means time saved from Copilot might be spent on discovering What knowledge e.g. waiting on an email (about What to do) from the customer.
Google Case Study: Quantifying the time saved
Google’s CEO, Sundar Pichai shared that AI tools have made Google engineers roughly 10% faster[22]. Google measures this by assessing the increase in engineering capacity - how much extra time engineers are getting back thanks to AI (in hours per week), IFor a standard 40-hour workweek, a 10% boost means each engineer gets back on average about 4 hours of work time per week. This sounds impressive — after all, who wouldn’t want a double-digit productivity bump?
Time saved can be potentially measured by counting the number of chars accepted i.e. Contribution speed (accepted_char_per_hour). That is the measure Github's research accepted[1].
We are interested to see if saved time was used for knowledge discovery. That can be confirmed by visual inspection of the learning curve. If the learning curve levels off that would mean knowledge was discovered and developers have started applying it.
Another quantifiable signal would come from Knowledge Discovery Efficiency (KEDE) values. They should increase with a certain percentage, which can be calculated using the Efficiency Multiplier.
Sundar Pichai’s 10% velocity boost means each engineer saves per workday, as illustrated in the table below.
| Number of developers | 27,000 |
| Saved hours/developer/week | 10% of 40 hours = 4 |
| Saved hours/developer/day | 4 hours / 5 days = 0.8 |
When we apply these 0.8 hours per developer per workday to the Efficiency Multiplier formula, it indicates an expected 7% improvement in the average daily KEDE.
(1)
This shows that a 10% time savings should have translated into an 11.1% increase in Knowledge Discovery Efficiency, because the extra hours amplify your team’s ability to close knowledge gaps.
Impact on Capability
In this section we examine how Copilot's features improve software development capability. We then discuss how we can confirm if Copilot's code suggestions contribute to an increase in capability. Then we propose a means to measure the impact of Copilot on capability.
First we present our working hypothesis about Copilot's impact on capability:
- Hypothesis 1: Copilot improves the capability of both individual developers and teams.
What is capability?
There has been a lack of precision in the way capability and performance are applied and measured. Moreover, the terms capacity and capability have been used interchangeably. Thus, to clarify the terminology it is important to distinguish the three constructs of activity: capacity, capability, and performance. As most scientific knowledge on people and organizations have their roots in core behavioral sciences we will adopt their definitions.
Capacity describes what a person can do in a standardized, controlled environment. Capability describes what a person can do in a specific environment. Performance describes what a person actually does in a specific environment. The person-environment interaction is the discriminating element between capacity, capability, and performance[12].
In software development, it is crucial to recognize the dual nature of the work involved: both knowledge work and manual work. While the manual aspect results in tangible output, such as source code, it is the knowledge work that forms the core of software development. This knowledge work encompasses the cognitive processes of problem-solving, understanding new technologies, designing algorithms, and conceptualizing solutions, which are less tangible but fundamentally vital. This includes not just applying existing technical knowledge but also the ability to acquire new knowledge, collaborate effectively, and innovate. The capability of a software developer, therefore, extends far beyond the speed of typing.
A capable software developer is one who can navigate the evolving landscape of technology with a robust and adaptive knowledge base. They can not only implement code but also contribute to the ideation and design of software, bringing innovation and efficiency to the development process. This capability is marked by a blend of technical proficiency, creative problem-solving, and the ability to continuously learn and adapt.
To improve the capability of software developers, we must focus on enhancing their comprehensive knowledge base. This involves training that goes beyond the surface level of learning syntax or tools. It should encompass cultivating deep problem-solving skills, adaptability to new technologies and methodologies, and proficiency in conceptualizing comprehensive solutions to complex problems.
A learning organization is skilled at creating, acquiring, and transferring knowledge, and at modifying its behavior to reflect new knowledge and insights[17]. It is responsive, understanding the need to keep up on things and to pivot from time to time[16]. How adaptive an organization is depends on its capability. Being a learning organization enables agility, adaptability, resiliency and the ability to meet the evolving needs of organization's stakeholders and the marketplace as a whole. The knowledge, skills and practices are held by people. Leaders must be capable of organizing individuals into a learning organization. A learning organization starts with the CEO and must be enabled through HR processes.
How do we measure capability?
Thus, in order to measure capability we need to measure the efficiency of the Knowledge Discovery process that fuels it.
As we presented in the Methodology section, there is a way to measure the knowledge discovered (missing information) in software development, using the scientifically backed and patented matric - Knowledge Discovery Efficiency (KEDE).
The diagram below presents a time series of Weekly KEDE values for a company.
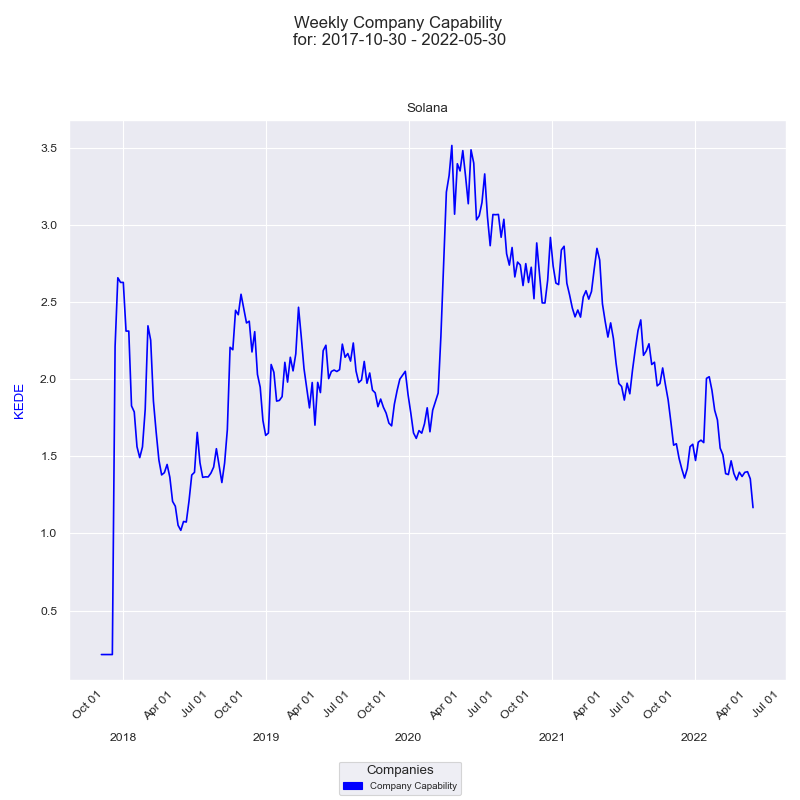
On the diagram above we have presented Knowledge Discovery Efficiency (KEDE) for each of the developers who contributed through the selected time period. On the x-axis we have the weekly dates. On the y-axis we have Weekly KEDE values. The dark blue line is the average weekly KEDE for all developers.
We provide practical examples here, to demonstrate how this measurement approach is applied in real-world software development scenarios.
How could Copilot improve capability?
Copilot provides context-relevant code suggestions. By offering developers immediate access to a vast array of coding solutions and examples, Copilot effectively acts as an extension of an organization's knowledge base.
Thus from a Knowledge-centric perspective there are two ways Copilot could improve capability:
-
Acquisition of knowledge:
Copilot provides access to knowledge that developers did not possess before.
This is the case when developers are working in a new domain or with a new technology.
Copilot can help them climb the learning curve faster i.e. accumulate knowledge faster.
Copilot enhances their learning experience, allowing for the absorption of new techniques and approaches. This continuous learning aspect is a key element of maintaining an evolving and dynamic knowledge base within an organization.
This hypotheis is backed by studies:
- 52% of developers using Copilot reported that it helped them improve coding language skills[25].
- GitHub Copilot has a sizable productivity impact on developers that grows over time. In the first three months, developers accept approximately 30% of code recommendations. As developers overcome any learning curves and become more comfortable with the tool, they use it for even greater impact and accept more code suggestions[18].
- The learning process does not appear to be diminishing after six months, which shows potential for even greater impact over time[18].
-
Application of knowledge:
Copilot provides access to knowledge that developers did possess before.
This is the case when developers are working in a domain or with a technology they are familiar with.
Copilot can help them produce the tangible output (type the code) faster i.e. save time.
Research found that accepting code completion suggestions is beneficial for developers as it allows them to finish writing a code block faster and can save time searching for less-commonly used syntaxes[18].
From a Knowledge-Centric perspective, the time saved depends on the knowledge developers have. This is true, because in order to accept the Copilot's suggestions developers need to have the knowledge to understand them. Thus, we need to measure the knowledge discovered, not the time saved.
Acquisition of knowledge
Knowledge acquisition doesn't save immediate time, but it saves time in the future, because developers accumulate knowledge today that will help them tomorrow. Prior knowledge is a critical factor in learning efficiency, influencing up to 60% of learning outcomes. This knowledge forms the foundation upon which new information is acquired.[14]. Additionally, prior knowledge of different domains can jointly support the recall of arguments[15].
The question is how can we measure the time saved in the future? The proper way to measure that is by looking at the learning curve developers have to climb.
Learning rate is the rate at which new knowledge is discovered. It is measured in bits of information discovered per unit of time. The higher the learning rate the faster the knowledge discovery process is. The faster the knowledge discovery process is, the higher the productivity is.
The following are three distinct types of learning curves commonly observed in software development projects. We present them visually on the diagram below.
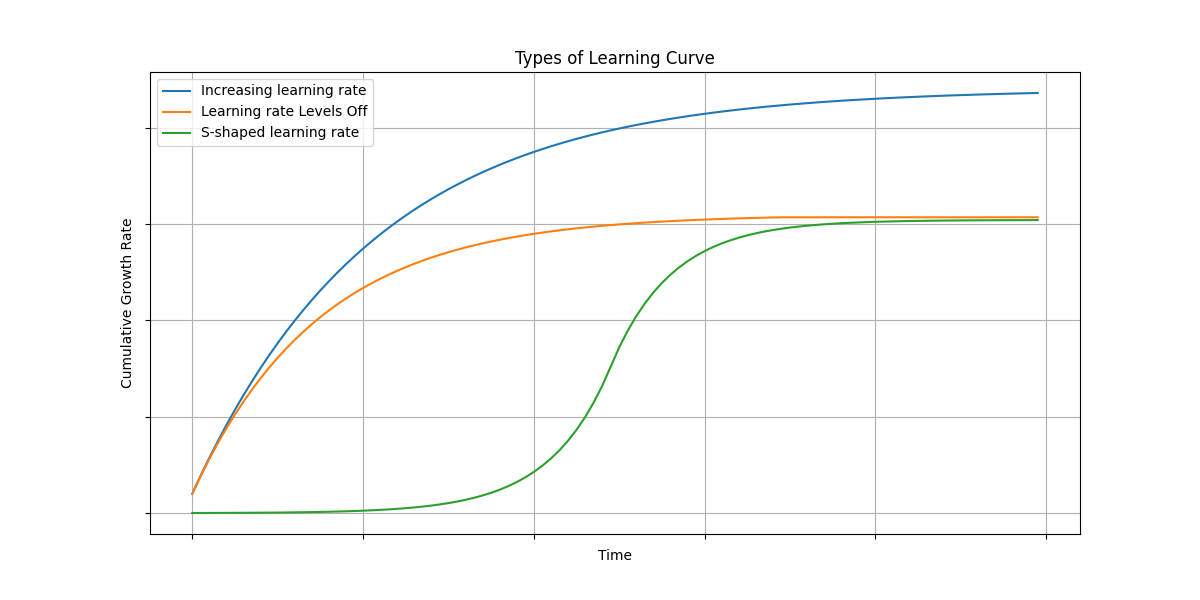
Each type provides insights into the dynamics of knowledge discovery and application, reflecting different project environments and stages of development.
Learning curves refer to "learning" in the broadest sense of the word. The term "learning curve" may be misleading because it suggests that knowledge discovery occurs through traditional school-like "learning." In fact, most software development processes improve, even when no obvious "learning" is going on.
Learning turves apply to all sizes of teams. Learning curves apply to individual developers Learning carves also apply to process traits other than productivity, such as quality and Rework rates..
"If you want to improve faster than your current learning curve predicts, how will you achieve it?" We cannot simply choose the learning rate we want. The learning rate is a function of the knowledge discovery process itself. To improve the learning rate we must improve the process by involving a new source of knowledge - such as Copilot.
With GitHub Copilot itself, we have a similar pattern. Researchers found that over time, the acceptance rate steadily increased as developers became more familiar with the tool[18]. Initially, developers using Copilot will have many questions or points of learning as they adapt to its suggestions and capabilities. Steadily, users become more accustomed to developing software with it.
Impact on Developer Happiness
In this section we examine how Copilot's features align with the conditions for achieving Flow. We then discuss whether Copilot's code suggestions and automation capabilities contribute to a clear and attainable goal, a balance between skill level and challenge, and provide clear and immediate feedback. We then Formulate hypothesis about how Copilot might either facilitate or hinder the attainment of Flow for developers. Discuss potential implications for productivity and satisfaction.
- Hypothesis 2: Copilot improves developer experience in terms of Happiness i.e. being in the Flow state
This hypothesis is backed by studies:
- Improving developer satisfaction. Between 60–75% of users reported they feel more fulfilled with their job, feel less frustrated when coding, and are able to focus on more satisfying work when using GitHub Copilot[13].
- Conserving mental energy. Developers reported that GitHub Copilot helped them stay in the flow (73%) and preserve mental effort during repetitive tasks (87%)[13].
- "Cycling through GitHub Copilot suggestions and manually editing the suggested code is an amazing flow."[1]
- "It says, ‘How can I facilitate your thinking process?’ rather than, ‘How can I take away your thinking process and just give you code?"[1]
- developers’ statements of productivity are closely tied to acceptance rate[19][20][21]
Firstly, we examine how Copilot's features align with the conditions for achieving Flow.
Flow is a state of heightened focus and immersion in activities, crucial for optimizing productivity and job satisfaction. Achieving Flow requires balancing the complexity of tasks with the individual capabilities of the developer[5]. When individual capability significantly exceeds task complexity, the knowledge gap becomes too narrow, leading to wasted potential and boredom. On the other hand, if task complexity surpasses individual capability, the knowledge gap widens, leading to stress and low productivity. A well-balanced gap keeps developers in the Flow state, fully immersed and focused on their work, leading to higher productivity and job satisfaction.
To enter and maintain a flow state, the following conditions should be met[5]:
- The opportunity for action, with a clear and attainable goal. In order to have a clear and attainable proximal goal, a developer needs to know what to do, how to do it, and where to go next.
- An action with a balance between skill level and challenge, meaning that the activity is neither too easy nor too difficult.
- Clear and immediate feedback, so that successes and failures are apparent and behavior can be adjusted as needed.
To maintain the flow state, it's also important to provide the developer with an environment free from distractions.
From the three conditions for Flow, Copilot doesn't provide a clear and attainable goal, and clear and immediate feedback. The goal is not clear because Copilot is a source of How knowledge, and not of What knowledge. Feedback is expected from activities such as running the suggested code in a unit test, or any other way of testing the code. That is not provided by Copilot. Thus, Copilot provides only a way to balance between skill level and challenge.
Moreover, Copilot's code suggestions and automation capabilities may hinder the attainment of Flow for developers. This is because it may disrupt the Flow state with unrequested suggestions, This may lead to a lack of focus and immersion in the task at hand, thereby hindering productivity and satisfaction.
Prior knowledge is needed to use Copilot effectively as found by research. Check the below quotes:
- "Our finding shows Copilot can compete with humans in coding and even though it can become an asset in software projects if used by experts. However, it can also become a liability if it is used by novices, who may not be familiar with the problem context and correct coding methods. Copilot suggests solutions that might be buggy and difficult to understand, which may be accepted as correct solutions by novices. Adding such buggy and complex codes into software projects can highly impact their quality"10].
- "Yet, while a massive surge in productivity is possible, our research finds time savings can vary significantly based on task complexity and developer experience. Time savings shrank to less than 10 percent on tasks that developers deemed high in complexity due to, for example, their lack of familiarity with a necessary programming framework. A similar result was seen among developers with less than a year of experience; in some cases, tasks took junior developers 7 to 10 percent longer with the tools than without them"[11].
Quantifying happiness
To ascertain whether developers achieve a state of Flow, it's essential to assess the presence of three key conditions: a clear and attainable goal, a balance between skill level and challenge, and clear and immediate feedback. Assessing these conditions in real-time, as a developer works on a task, is impractical due to the inaccessibility of the developer's cognitive process.
However, a post-task completion analysis offers a viable alternative, as all three Flow conditions are intricately linked to knowledge. Specifically:
- Goals: Understanding the task involves knowing what to do, how to do it, and the next steps to take.
- Skill and Challenge Balance: This is about the knowledge a developer possesses versus what they need to know to complete tasks effectively.
- Feedback: This pertains to recognizing the correctness of actions and making necessary adjustments.
This knowledge is categorized into two types: 'prior knowledge' (what the developer already knows) and 'required knowledge' (what the developer needs to know for the task). The 'knowledge gap' is the difference between these two, measured in bits. Therefore, measuring the knowledge acquired post-task can indicate whether the developer was in a state of Flow. We quantify this knowledge gap in bits of information, allowing us to measure the knowledge to be discovered. This approach facilitates meaningful comparisons across different contexts, programming languages, and applications.
The Knowledge Discovery Efficiency (KEDE) metric is employed for this purpose, as explained in details here..

KEDE is calculated for each developer individually and signifies the knowledge that they lacked before beginning the task. A low KEDE score implies that the developer did not possess the requisite knowledge to tackle the task, while a high KEDE score suggests that the developer was adequately prepared.
Typically, values less than 50 point towards an imbalance leaning towards anxiety, indicative of overly challenging tasks. Conversely, values over 50 suggest an imbalance towards boredom, where tasks are not sufficiently challenging. An ideal state of Flow is indicated by a KEDE value of 50, representing a perfect balance.
Interestingly, KEDE measurements propose a somewhat counterintuitive relationship between efficiency and developer happiness. The most efficient developers, those who require less discovery of new knowledge, may also be the ones who are most prone to boredom.
Imagine a scale: on one side is the required knowledge and on the other is the prior knowledge. They are in balance when the knowledge to be discovered equals one bit, with balance values ranging from 0 to 1.
For practicality, we express this balance as a percentage. For instance, a 40% balance suggests that the developer is 60% away from achieving Flow.
We provide practical examples here, to demonstrate how this measurement approach is applied in real-world software development scenarios.
Impact on Cognitive Load
Cognitive load refers to the total amount of mental effort required for a task, such as software development[27]. Rooted in cognitive psychology, this concept is closely related to cognitive control, the processing capacity of the conscious mind, and working memory capacity.
- Hypothesis 3: Copilot improves developer experience in terms of Cognitive load
The processing capacity of the conscious mind refers to the amount of mental resources that are available to process and understand information. While a great deal occurs below the threshold of our awareness, and this has an impact on how we feel and what our life is going to be like, in order for something to become encoded as part of your experience, you need to have paid conscious attention to it[35].
Working memory, often referred to as the "mental scratchpad", is a cognitive system that allows individuals to temporarily store and manipulate information in their minds. It plays an important role in a variety of mental tasks, including problem-solving, decision-making, and learning.
In 1956, cognitive psychologist George Miller proposed that the number of items humans can actively hold in their conscious awareness at once is limited to about seven[30]. However, more recent research suggests that the limit may be closer to four or five items[34]. This has been interpreted to mean that the human brain can hold about 2 to 3 bits of information in working memory at a time, where each bit represents a binary decision.
The precise limit is determined by each individual's memory capacity, with activity from low-capacity individuals reaching this plateau sooner than that from high-capacity individuals[31]. Cognitive capacity is directly related to cognitive ability[32][33].
The cognitive load can increase significantly when individuals are presented with a large number of options, a phenomenon known as "choice overload" or the "paradox of choice."[37]. This leads to hindered decision-making and a reduced likelihood of selecting rational and objective options[28][29].
The number of bits in the working memory is not only determined by the number of alternatives but also by other features of the choice set, such as the number of attributes that alternatives are differentiated upon[36]. In addition, there are limits to the cognitive processing capabilities of the mind and limited working memory.
To quantify how a large number of options affects cognitive load, we can consider the "search space" of options contributing to the "perplexity" of the decision task. The larger the search space (i.e., the more options there are), the higher the perplexity, and the more cognitive resources are required to make a decision. This can increase cognitive load and potentially lead to choice overload.
Perplexity, commonly used in natural language processing and machine learning, refers to the uncertainty or unpredictability of a model's output. In a broader sense, perplexity can be understood as a measure of the complexity, difficulty, uncertainty, or unpredictability of a problem or task. A person might be in a state of perplexity when trying to solve a difficult puzzle or find an object in a large search space. A more complex or difficult task might have a greater number of possible states or options to consider, which might increase the feeling of uncertainty or confusion.
In this context, perplexity might be thought of as a measure of the search space i.e. average number of possible states, in the sense that a more complex or difficult task might have a greater number of possible states or options to consider, which might increase the feeling of uncertainty or confusion. For example, if one is trying to find a specific item in a large room or warehouse, the search space would be the number of potential locations where the item could be found.
To quantify perplexity, we need to know how many options a software developer sees when looking at a work item before starting the work. This task can be challenging, if not impossible, since it involves understanding the individual's thought process!
However, we can measure the knowledge discovered after completing the work. This knowledge equals the difference between the prior knowledge a software developer had and the knowledge required to develop the work item.
Knowledge Discovery Efficiency (KEDE) measures the discovered knowledge. From KEDE, we can assess the perplexity a software developer experienced while working.
Taking into consideration how KEDE correlates with perplexity, we can say that::
For instance, if a knowledge worker has KEDE=100, it means she had to find a coin in only one box.
This situation reflects a perplexity of 1, indicating there was only one possible answer to the question: "Where is the gold coin?" This is the minimum value.
However, if a knowledge worker has KEDE=20, it implies she had to find a coin among 16 boxes, indicating a tolerable perplexity level.
But if a knowledge worker had KEDE=1, equivalent to answering 99 binary questions, it means she had to find a coin among approximately 6.3x1029 boxes!
To contextualize, there are an estimated 1022 to 1024 stars in the Universe[5]. The number of boxes was significantly greater than the number of stars in the Universe! We can infer that the software developer faced an exceedingly high level of perplexity.
Recall that when we have n equally sized boxes the average number of questions needed to find the coin location is:
Thus, by using KEDE, we can quantify in bits of information the cognitive load a software developer experienced while working.
In essence, KEDE provides a robust mechanism for quantifying cognitive load in software development tasks. By calculating the knowledge gap that developers must bridge to complete tasks, we can gauge the complexity of these tasks and, in turn, gain insights into the cognitive load placed on developers. Such insights can be invaluable in optimizing development processes and improving overall developer experience.
We provide practical examples here, to demonstrate how this measurement approach is applied in real-world software development scenarios.
Impact on Collaboration
Shortening feedback loops is a common goal in many software development methodologies, such as Agile and DevOps, as it leads to faster detection of issues, quicker implementation of changes, and overall improved efficiency.
Collaboration involves the active engagement of multiple individuals or teams to achieve a common goal. It allows the sharing of unique perspectives, experiences, and skills, thereby facilitating a more diverse and comprehensive problem-solving approach. In software development, for example, collaboration could involve developers, testers, designers, project managers, and clients working together to deliver a successful product.
Collaboration and feedback loops are interconnected, each influencing and enhancing the other in a kind of virtuous cycle, as explained here. Effective collaboration leads to shorter, more efficient feedback loops, and efficient feedback loops enhance the effectiveness of collaboration. This cycle, when facilitated and managed properly, can greatly enhance team productivity and the overall quality of the end product or service.
- Hypothesis 5: Copilot improves knowledge sharing across the org (breaking down walls between repositories)
Collaboration can be measured
Software development is a complex process that requires the collaboration of multiple team members. Measuring the efficiency of this collaboration, however, is not straightforward. It's a multifaceted task that can't be reduced to a single metric.
There are tools available that, from 'inside the black box', measure the efficiency of practices— such as Continuous Integration/Continuous Deployment (CI/CD), Pair Programming, and Code Reviews— that are designed to facilitate and enhance collaboration and shorten feedback loops in software development. However, it's also crucial to remember that it's both possible and valuable to gauge the effectiveness of collaboration from outside this 'black box'.
The number of contributing developers can be determined by counting those actively participating in a project over a certain period of time.
The efficiency of information acquisition, on the other hand, can be understood in terms of how rapidly and effectively missing information is acquired and integrated into the team's work. This can be reflected in the time taken to incorporate missing information, the completeness or accuracy of the understanding of new information, and the impact of the new information on the team's productivity or the quality of their output.
Missing information can be acquired from two types of sources[38]:
- Personal Sources: Those that communicate information personally including insights, experiences, and skills of team members. When people collaborate, they share and combine their knowledge, skills, and experiences, leading to a more effective problem-solving process and achievement of shared goals. In this sense, collaboration amplifies individual contributions by creating a collective intelligence that exceeds the sum of its parts.
- Impersonal Sources: These are non-human sources that communicate information to broad audiences, including books, research papers, digital databases, API documentation, StackOverflow responses, coding libraries, and online audio and video. This type of information is vital as it provides a broader, often more objective viewpoint, and can provide data and insights that may not be available within the collaborating group.
In a well-functioning collaborative environment, both personal and impersonal sources of information are considered and used to acquire knowledge, solve problems, and make informed decisions. It's important to note that when we measure the efficiency of information acquisition, we are considering both these categories of sources. This means we account for all channels through which new information can be gained, thereby providing a comprehensive view of the organization's level of efficiency of information acquisition.
Knowledge Discovery Efficiency (KEDE) is a metric that can be used to measure the efficiency of information acquisition in software development. We will refer to an organization's efficiency of information acquisition as its 'capability.'
We provide practical examples here, to demonstrate how this measurement approach is applied in real-world software development scenarios.
Impact on Productivity
In this section we examine how Copilot's features improve software development productivity. We then discuss how we can confirm if Copilot's code suggestions contribute to an increase in productivity. Then we propose a means to measure the impact of Copilot on productivity.
First we present our working hypothesis about Copilot's impact on productivity:
- Hypothesis 6: Copilot improves Productivity.
In software development, rethinking productivity is crucial. A memorable anecdote from "The Mythical Man-Month" illustrates this perfectly. A general walks into a room filled with software developers and sees them engaged in discussion, not typing away. Then the general asked why everybody is talking and nobody is working? It's a common misconception that productivity in software development is solely measured by how furiously one can type. In reality, the essence of a developer's job extends far beyond the keyboard. It involves a significant amount of knowledge work: brainstorming, strategizing, researching, and yes - thinking!
Quantified productivity represents the efficiency in achieving desired outcomes - it's about maximizing output while minimizing input. But what constitutes real output in software development? It isn't just about the number of lines of code or features delivered, but the value it brings - be it business gains, customer satisfaction, or technical innovation.
Traditional inputs like time and capital are essential, but they miss a critical aspect unique to software development - the acquisition and application of knowledge. Here, knowledge is king. Adopting a Knowledge-centric perspective, we define these terms as follows:
- Output is the value delivered. It can be measured as money, business gains, customer satisfaction, technical innovation etc.
- Input is the knowledge developers needed to discover to deliver that value. Knowledge discovered is measured in bits of information.

High productivity is achieved when less knowledge needs to be discovered for the outcome to be produced.
The concept of Perceived productivity suggests measuring productivity on multiple dimensions and using self-reported data[2]. However, this approach often correlates productivity with satisfaction and happiness as indicated by research. A 2021 study, found that developers' own view of productivity is akin to having a fulfilling day marked by focus, meaningful progress, and a sense of achievement at day's end,6]. Further research underscores the importance of these outcomes for developers and their correlation with enhanced performance[7, 8].
Developer work experience and overall well-being are important, but they are not the same as productivity. The ability to stay focused on the task at hand, make meaningful progress, and feel good at the end of a day's work are captured by the Happiness level, based on the concept of the Flow state.
For the purposes of this article we define developer productivity as quantified productivity, focusing on the outcomes and the knowledge required to achieve them.
Impact on Rework
In the realm of software development, rework is an inevitable part of the process. It's a reflection of the iterative nature of development, where we continuously refine and improve our work based on new insights, feedback, and changing requirements. However, unchecked or excessive rework can lead to inefficiencies, delays, and increased costs. It's a form of waste that we strive to minimize in our pursuit of lean and efficient development processes. Therefore, measuring rework is of paramount importance. It allows us to quantify the extent of this waste, identify its sources, and devise strategies to reduce it.
In this context, we introduce two concepts for measuring rework: 'lost information' and 'information loss rate'. These metrics stem from the field of Information Theory and provide a perspective on rework from a knowledge-centric standpoint.
'Lost information' represents the knowledge that we initially perceived to be gained during the development process but turned out to be incorrect or misleading. It's the information that, in hindsight led us down the wrong path and resulted in rework.
Imagine you're developing a feature based on certain assumptions or information you have at hand. You invest time and resources into building it, only to find out later that the assumptions were incorrect or the information was misleading. The feature doesn't meet the requirements, or it doesn't integrate well with other parts of the system, or it doesn't deliver the expected value. You have to go back, undo or modify what you've done, and do it again correctly. The initial information that led you to build the feature incorrectly in the first place is what we refer to as 'lost information'.
Lost information is a reflection of the gaps in our understanding, the inaccuracies in our knowledge, and the miscommunications in our interactions. It's a measure of the 'noise' in our development process that obscures the 'signal' and leads us away from the optimal path.
For instance, consider a stacked bar chart that presents how rework for a developer is distributed across different software development projects.
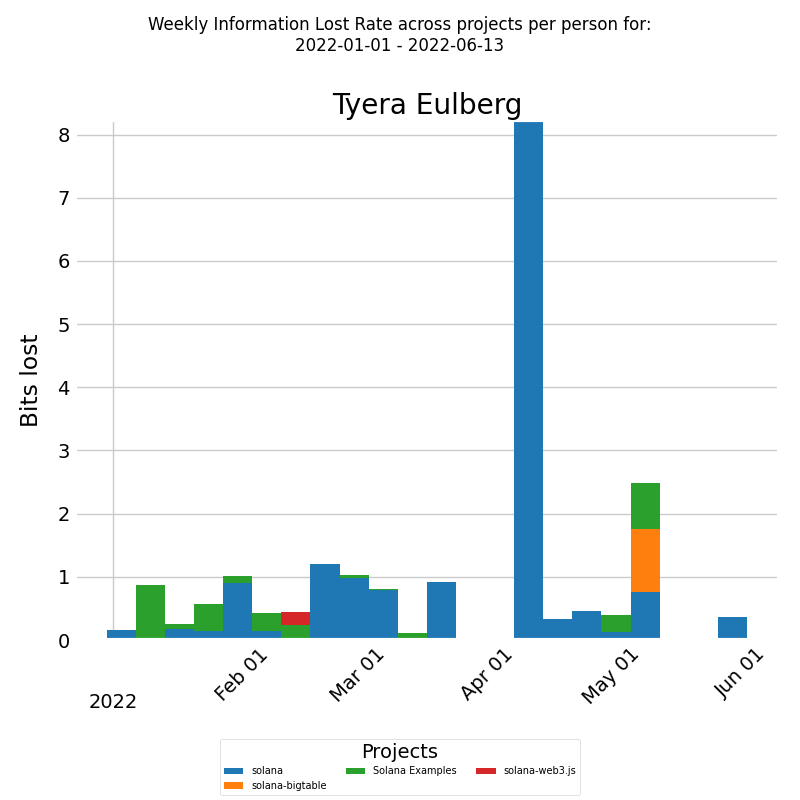
The x-axis shows the week dates and the y-axis shows the amount of bits of information lost per week. Each bar represents the bits lost per week by the selected developer, which is further divided into boxes. Each box corresponds to the fraction of bits lost per week by the developer for a particular project. The color of each box represents a different project. This way, we have a clear visualization of how much bits of information the developer replaced for each project during the selected time period. The information loss rate for each project can be compared.
By visualizing and analyzing the information loss rate, we can identify the projects where the rework is high, and where our knowledge management can be improved. We can see where our perceived knowledge is most misaligned with the actual knowledge, where our assumptions and communications are most prone to errors, and where our learning and adaptation are most needed.
These insights can guide our efforts to reduce rework and improve efficiency. They can help us focus our resources on the most impactful areas, refine our strategies, and track our progress. They provide a concrete, quantifiable basis for our continuous improvement in the knowledge-centric software development process.
For a more detailed understanding of how to leverage these insights to reduce rework, you can refer to this article. This resource provides a comprehensive guide on how to apply the concepts of 'lost information' and 'information loss rate' to effectively minimize rework in your software development projects.
Conclusion
In conclusion, our exploration of GitHub Copilot through the lens of a Knowledge-centric Perspective reveals its profound potential to transform software development. By providing real-time, context-aware suggestions, Copilot not only enhances the speed and efficiency of coding but also serves as a pivotal tool for knowledge discovery and application. This GenAI-powered assistant stands out by seamlessly integrating into developers' workflows, reducing interruptions, and facilitating a learning environment that encourages the absorption of new coding practices and patterns.
The introduction of Knowledge-Centric Metrics—such as Knowledge Discovery Efficiency (KEDE), Collaboration, Cognitive Load, Happiness (Flow State), Productivity, and Rework—offers a nuanced framework for assessing Copilot's impact. These metrics move beyond traditional evaluation methods, offering insights into the quality of the development experience, team dynamics, and the overall effectiveness of software development processes.
We suggest that Copilot has the capability to significantly improve individual and team performance, enhance developers' happiness, reduce cognitive load, reduce delivery times, foster collaboration, and boost productivity by streamlining the process of knowledge discovery. These benefits collectively suggest that Copilot is much more than a time-saving tool; it is a catalyst for creating a more collaborative, efficient, and satisfying development environment.
Future research should focus on applying these Knowledge-Centric metrics in real-world settings to validate our hypotheses further. This empirical approach, coupled with qualitative feedback from developers, will provide a comprehensive understanding of Copilot's role in modern software development. As organizations strive to maximize their technological investments, this article underscores the importance of adopting advanced, data-driven evaluation methods to truly gauge the impact of AI tools like GitHub Copilot on the software development lifecycle.
By bridging the knowledge gap with efficiency and precision, Copilot not only augments the developers' toolkit but also redefines the boundaries of what is possible in software development. As we continue to navigate the evolving landscape of AI in technology, GenAI tools like Copilot will undoubtedly play a crucial role in shaping the future of coding, making it an exciting time for developers and organizations alike.
Appendix
Practical examples of measuring happiness
Consider the time-series diagram below, which illustrates developer's happiness for a selected period across all projects.
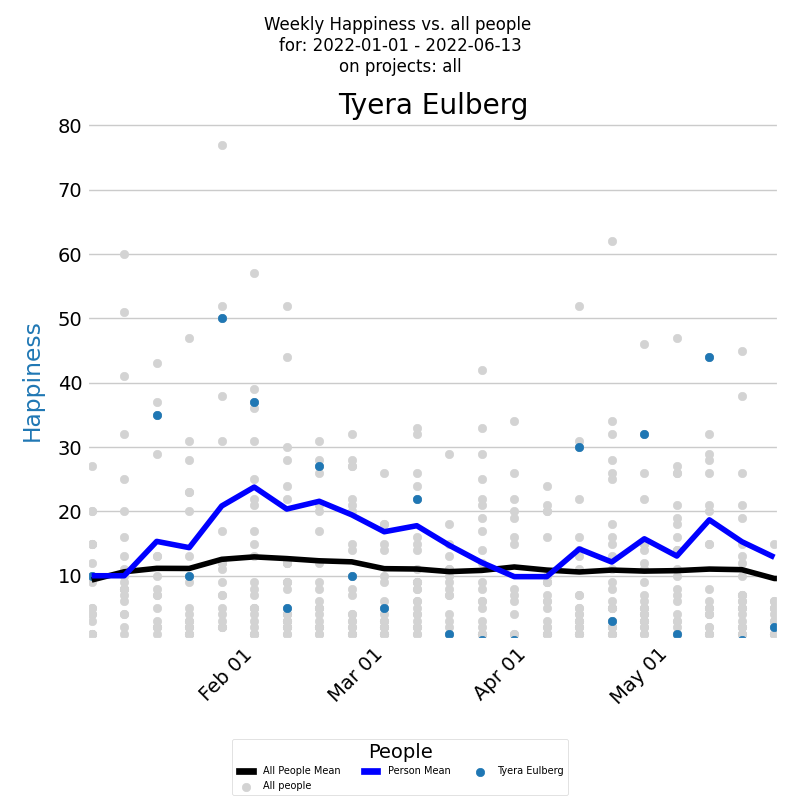
The x-axis of the diagram displays the dates of each week, while the y-axis shows the weekly happiness values. Each week's happiness level is represented by a blue dot on the diagram, giving you a clear visual representation of how the developer's happiness changes over time. Additionally, the dark blue line on the diagram represents the average weekly happiness for the developer, calculated using the Exponentially Weighted Moving Average (EWMA) method. By analyzing this line, you can gain a better understanding of the overall trend of the developer's happiness levels over time. But to gain a deeper understanding of a developer's happiness levels, it's important to compare them with the company averages. Each individual developer's weekly happiness is represented by a light gray dot, while the average weekly happiness calculated using EWMA is represented by a black line.
The time-series diagram reveals that the selected developer's average happiness levels consistently outpace the company's average, Interestingly, their happiness peaks at specific moments, ike a roller-coaster over time. Contrastingly, the company-wide data exposes a concerning pattern: a majority of developers experience their work in a state of anxiety, rather than happiness.
Along with the time series of the happiness it's very useful to see a histogram of weekly averaged happiness values, which displays the frequency distribution of happiness values over a selected period. The histogram below presents the weekly happiness values for a selected period, with the x-axis displaying the Weekly happiness and the y-axis showing the percentage of each particular value.
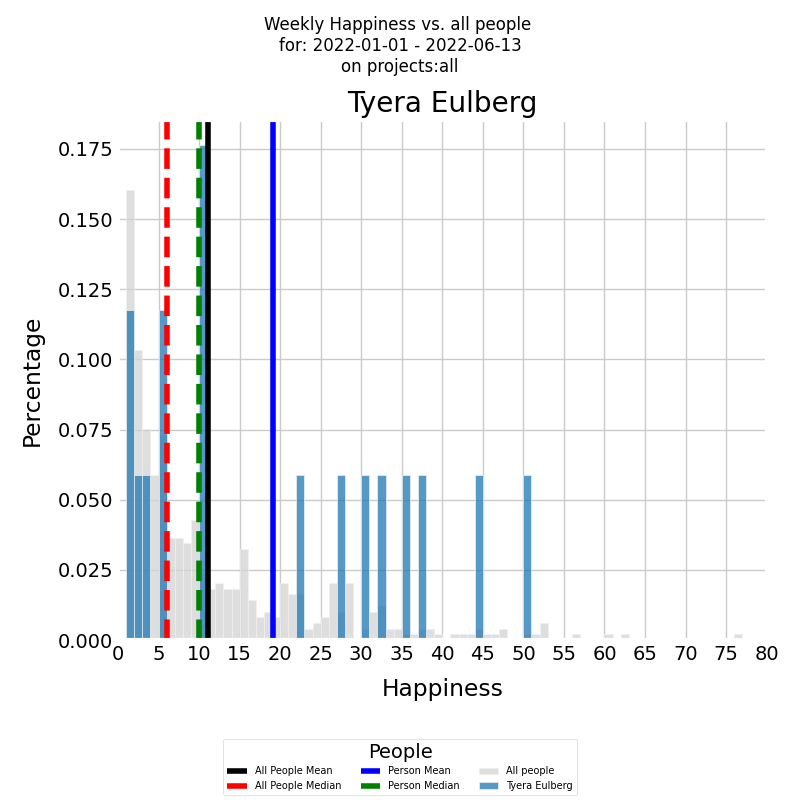
The histogram is presented in color for the developer, with the blue vertical line representing the average weekly happiness level for the selected period and the green vertical dashed line representing the median weekly happiness level. To gain a deeper understanding of the developer's happiness levels, it's important to compare them with the company averages. The same histogram can be generated for all other developers who contributed to all other company projects during the selected time period, with the histogram presented in gray. The black vertical line represents the average weekly happiness level for all other developers, while the red vertical dashed line represents the median weekly happiness level.
The diagram illustrates that the selected developer's average happiness levels are double the company's average. Interestingly, their happiness isn't concentrated at a single point but rather distributed uniformly across the spectrum. The company histogram, on the other hand, reveals a concerning pattern: most developers experience their work in a state of anxiety.
To gain insights into how a developer's mood is influenced by their work environment, we can examine the distribution of their happiness across different projects. The diagram below presents a stacked bar chart that allows you to look at numeric values across two categorical variables. The first category is the developer's weekly happiness, and the second category is the projects that the developer worked on during the selected time period. Each bar on the chart represents the weekly happiness of the selected developer, divided into a number of boxes, each one corresponding to the happiness that the developer felt on a particular project.
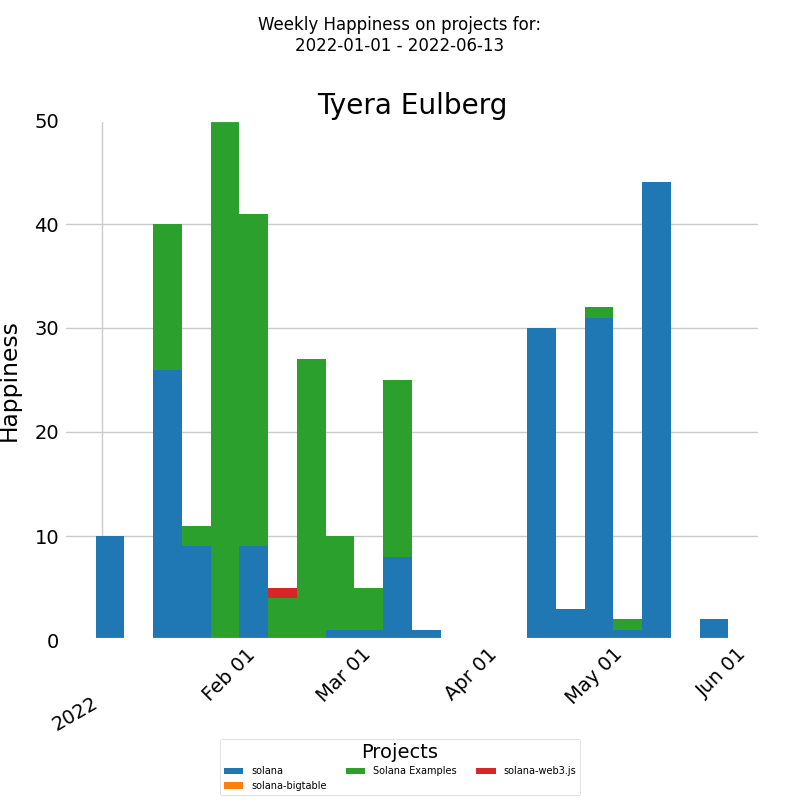
The x-axis of the chart displays the dates of each week, while the y-axis shows the weekly happiness levels. For this particular developer, their mood seems unaffected by the nature of the project, be it represented in green or blue. Thus, a holistic review of the entire company as a system may be necessary to identify patterns or trends impacting their happiness.
To address this, we suggest a two-pronged approach: First, investigate what factors contribute to the higher happiness levels of the selected developer and aim to replicate those conditions for the rest of the team to alleviate their anxiety. Secondly, identify periods when even the usually happy developer experienced anxiety, and work towards creating a more consistent and positive working environment. It's possible that addressing a single issue could alleviate both undesirable effects.
Practical examples of measuring cognitive load
Assessing a developer's cognitive load involves examining their it over time. The following diagram depicts a developer's weekly cognitive Load over a selected period across all projects.
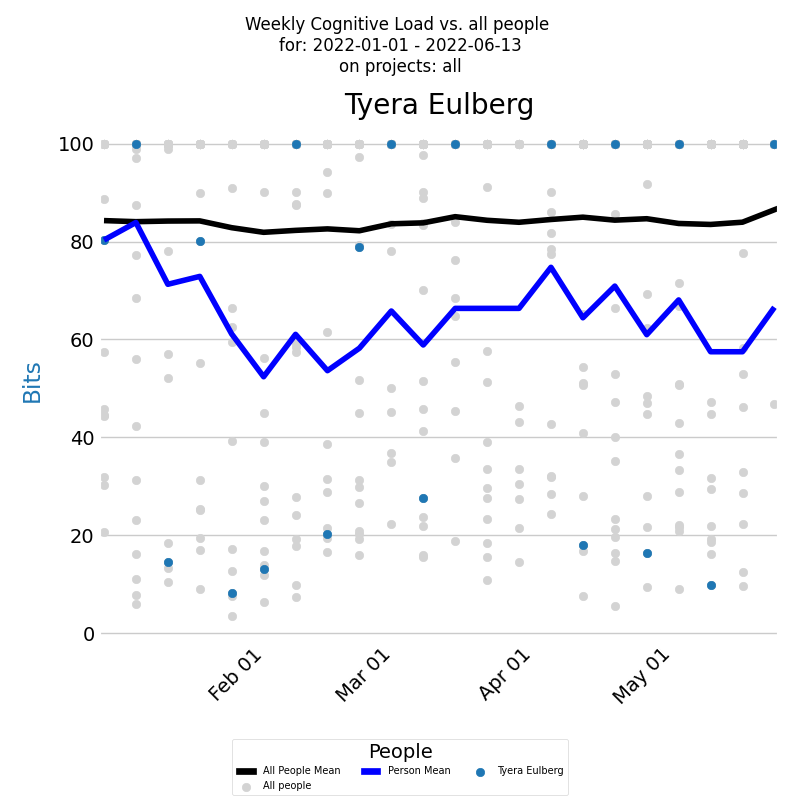
The x-axis shows the week weeks, and the y-axis denotes weekly cognitive Load values. The blue dot for each week represents a developer's cognitive Load. The dark blue line signifies a developer's average weekly cognitive Load. Comparisons with the company average can be made by examining cognitive Load for all contributing developers during this period, depicted by light gray dots. The black line signifies these developers' average weekly cognitive Load.
Examining the frequency distribution of a developer's averaged cognitive Load over time can be informative. A histogram, as shown below, can illustrate this distribution.
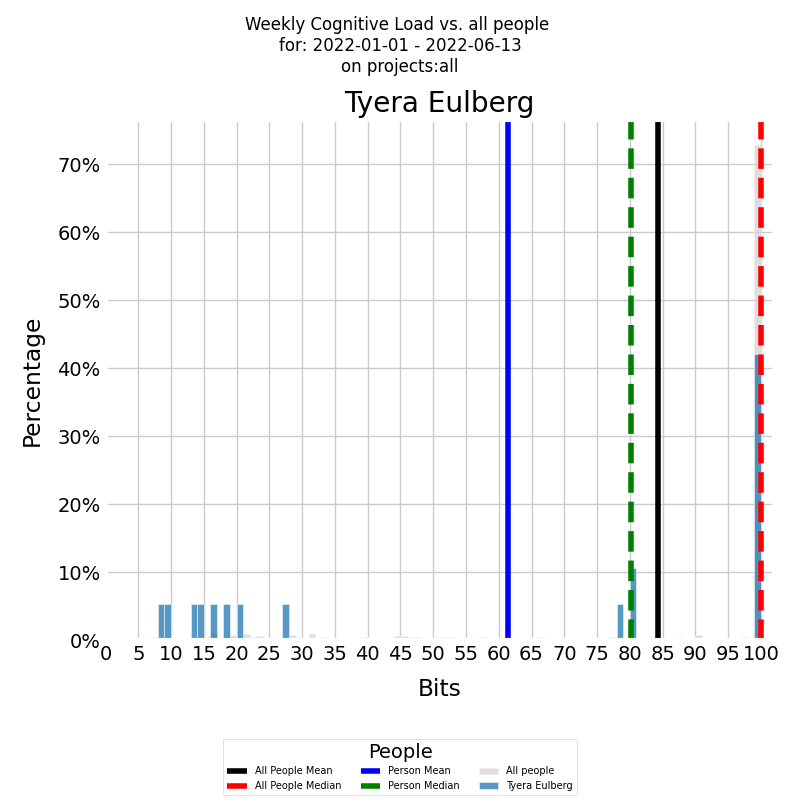
The x-axis displays the weekly KEDE, while the y-axis shows the frequency of each specific value. The colored histogram represents the developer's cumulative cognitive Load. The blue vertical line denotes the developer's average weekly cognitive Load for the selected period, while the green dashed line indicates the median weekly cognitive Load.
Both diagrams show that there were weeks, with a KEDE=10, when the selected developer experienced a cognitive load equivalent to searching in just 512 boxes. However, the developer's capability typically ranged between 2 and 4. This suggests that their cognitive load was akin to searching through approximately 16,777,216 boxes. Even though this cognitive load is considerable, it's still much lower compared to the average load within the company, where KEDE=1 corresponds to a number of boxes that exceeds the total number of stars in the Universe! Furthermore, the company's median cognitive Load is less than 0.5, indicating that half of the time, the cognitive load was intolerable!
As an initial measure, it would be beneficial to examine why the selected developer has a significantly better work experience than the rest of the company. Directly asking the developer could be a good approach, but for a deeper understanding of a developer's knowledge discovery efficiency, one should analyze its distribution across various projects. The diagram below shows a stacked bar chart of the developer's weekly efficiency divided by projects during a selected period.
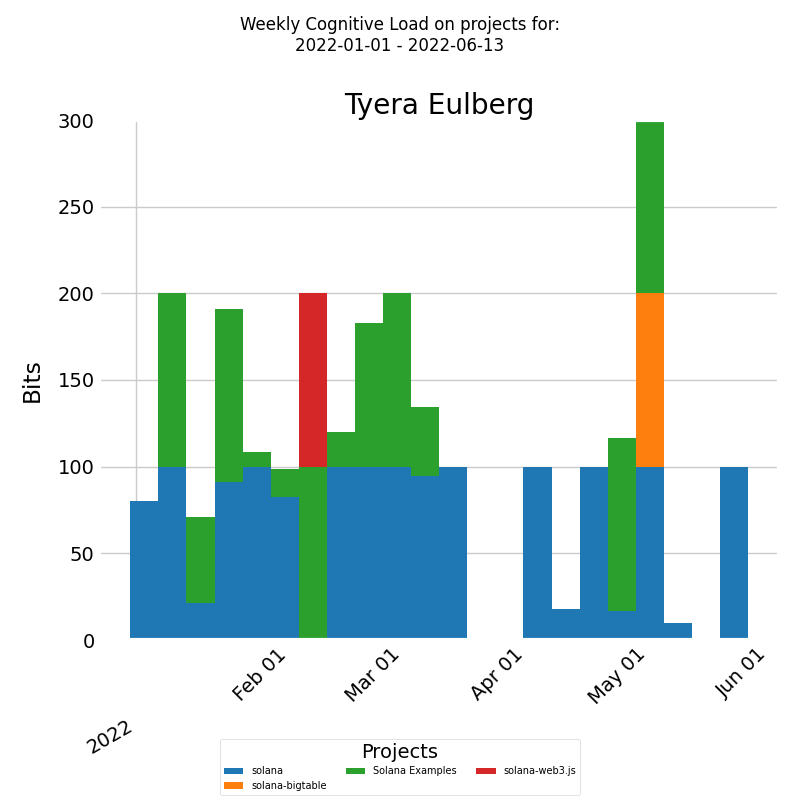
The x-axis denotes week dates and the y-axis indicates weekly cognitive Load. Each bar represents a week's cognitive Load for the developer, divided into segments according to the proportion of weekly cognitive Load for each project.
For this specific developer, their cognitive load appears to remain constant, regardless of the project. As a result, it may be necessary to conduct a comprehensive examination of the company as a whole to pinpoint patterns or trends affecting their job satisfaction.
In response, we recommend that the company's leadership investigate the factors contributing to such extreme cognitive loads for the average developer. Based on my experience as an engineering manager, these factors could include insufficient training, prolonged feedback loops, unclear requirements, etc.
Practical examples of measuring capability
In order to assess the capability of a developer, it's important to examine their KEDE over time. The diagram below provides a time series of KEDE of a developer for a selected period across all projects.
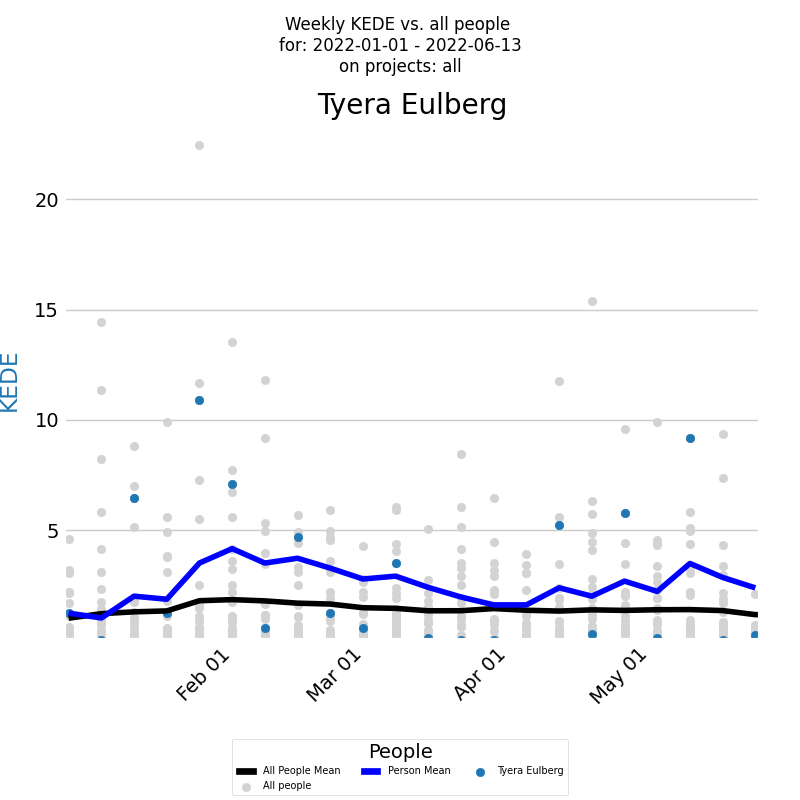
The x-axis displays the week dates, while the y-axis represents weekly KEDE values. The blue dot on the diagram for each week represents the developer's KEDE. The dark blue line on the diagram represents the average weekly KEDE for the developer, calculated using EWMA. To compare the developer's KEDE with the average of the company, you can view the Weekly KEDE for all developers who contributed code to any of the company projects during the selected time period. Each individual developer's weekly KEDE is presented as a light gray dot, and the black line represents the average weekly KEDE for those developers, calculated using EWMA.
When inspecting a developer's KEDE over time, it's also useful to see the underlying frequency distribution of their averaged values. A histogram can show how often each different value occurs. The diagram below presents such a histogram for a selected period.
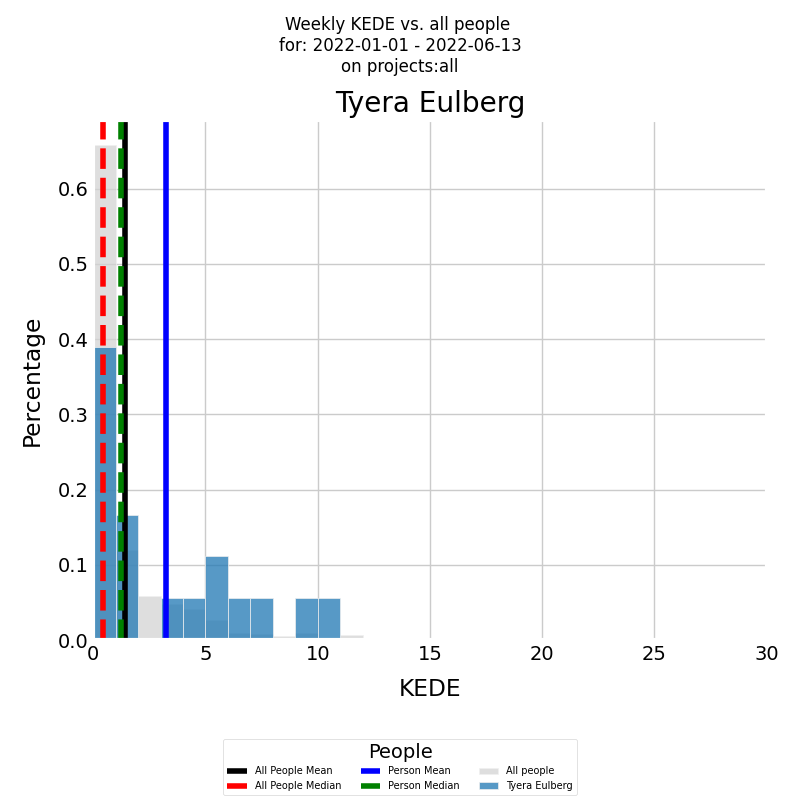
On the x-axis, you have the Weekly KEDE, and on the y-axis, you have the percentage of each particular value. First, the developer's summarized KEDE is presented by the histogram in color of the Weekly KEDE frequency for the selected period. The blue vertical line is the average weekly KEDE for the developer for the selected period, calculated by arithmetic mean. The median weekly KEDE for the developer for the selected period is presented by the green vertical dashed line.
Both diagrams clearly show that there were weeks, with a KEDE=10, when the selected developer experienced a cognitive load equivalent to searching in just 512 boxes. However, the developer's capability, as measured by KEDE, typically ranged between 2 and 4. This suggests that their cognitive load was akin to searching through approximately 16,777,216 boxes. Even though this cognitive load is considerable, it's still much lower compared to the average load within the company, where KEDE=1 corresponds to a number of boxes that exceeds the total number of stars in the Universe! Furthermore, the company's median KEDE is less than 0.5, indicating that half of the time, the cognitive load was intolerable!
As an initial measure, it would be beneficial to examine why the selected developer has a significantly better work experience than the rest of the company. Directly asking the developer could be a good approach, but for a deeper understanding of a developer's KEDE, one should analyze its distribution across various projects. The diagram below presents a stacked bar chart that allows for a detailed analysis of numeric values across two categorical variables. In this case, the first category is the developer's weekly KEDE, and the second category is the projects the developer worked on during the selected time period.
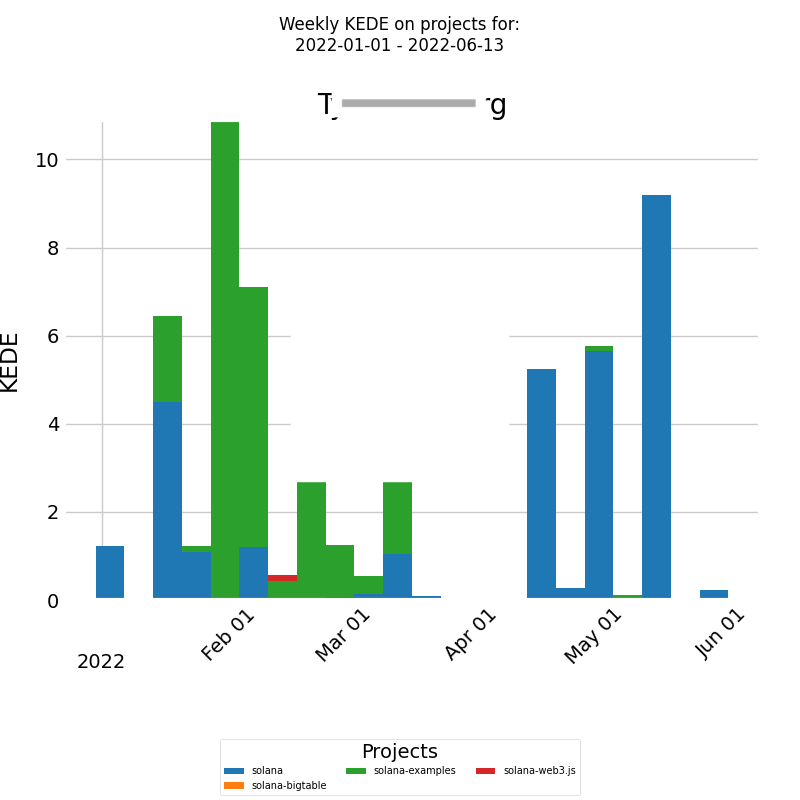
On the x-axis, we have the week dates, and on the y-axis, we have the weekly KEDE. Each bar represents the weekly KEDE of the selected developer divided into a number of boxes, each corresponding to the fraction of the weekly KEDE that the developer contributed to a particular project. For this specific developer, their cognitive load appears to remain constant, regardless of whether the project is denoted in green or blue. As a result, it may be necessary to conduct a comprehensive examination of the company as a whole to pinpoint patterns or trends affecting their job satisfaction.
In response, we recommend that the company's leadership investigate the factors contributing to such extreme cognitive loads for the average developer. Based on my experience as an engineering manager, these factors could include insufficient training, prolonged feedback loops, unclear requirements, etc.
Practical examples of measuring collaboration
Consider the time-series diagram below, which illustrates the interplay between an organization's size and its capability over time.
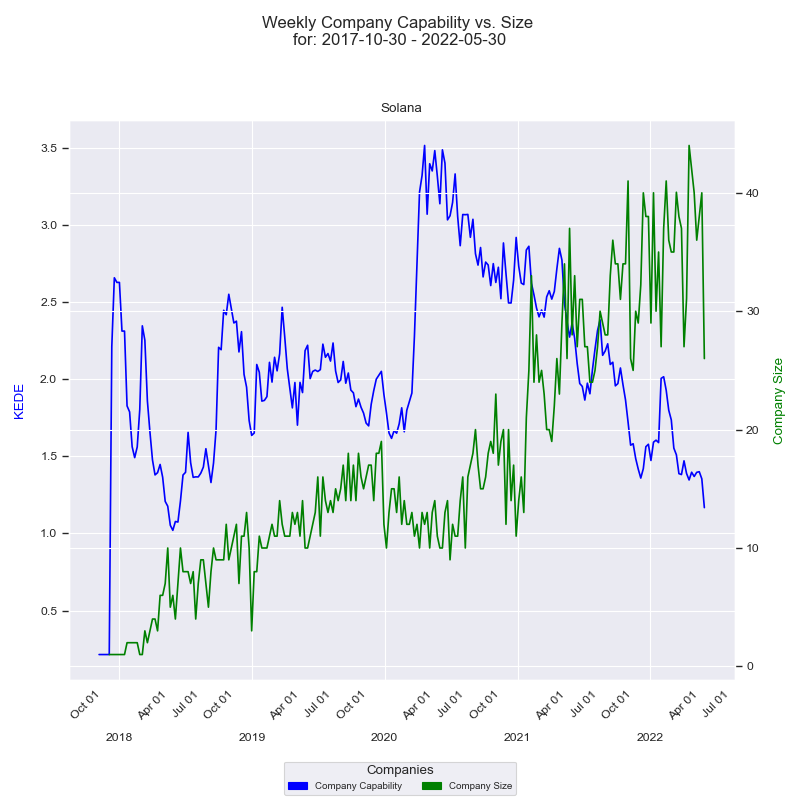
The x-axis represents the quarters, while the y-axis on the left displays the 'capability' in terms of Weekly KEDE values. The dark blue line in the diagram represents the average Weekly KEDE for all developers who contributed to the company's projects in a given week, calculated using Exponential Weighted Moving Average (EWMA). This line offers a visual representation of how the organization's capability fluctuates over time.
The right y-axis showcases the size of the company, depicted by the number of developers who contributed to the company's projects in a given week. The green line represents the company's size over time, with each point marking the count of contributing developers for that week. A detailed construction of the diagram can be found here.
The diagram displays a notable period where there is an inverse correlation between the company's size and its capability. Over the span of more than two years, the company size surged from 20 to 44, a substantial 120% increase. Conversely, during the same period, the capability steadily declined from 3.6 to 1.3, indicating a 64% decrease. The diagram illustrates a trend wherein the efficiency of information acquisition decreases as the number of contributing software developers increases.
Another way to visualize the relationship between the efficiency of information acquisition and the number of developers is through a histogram. This chart shows the frequency distribution of the company's 'capability' against the number of contributing developers over time.
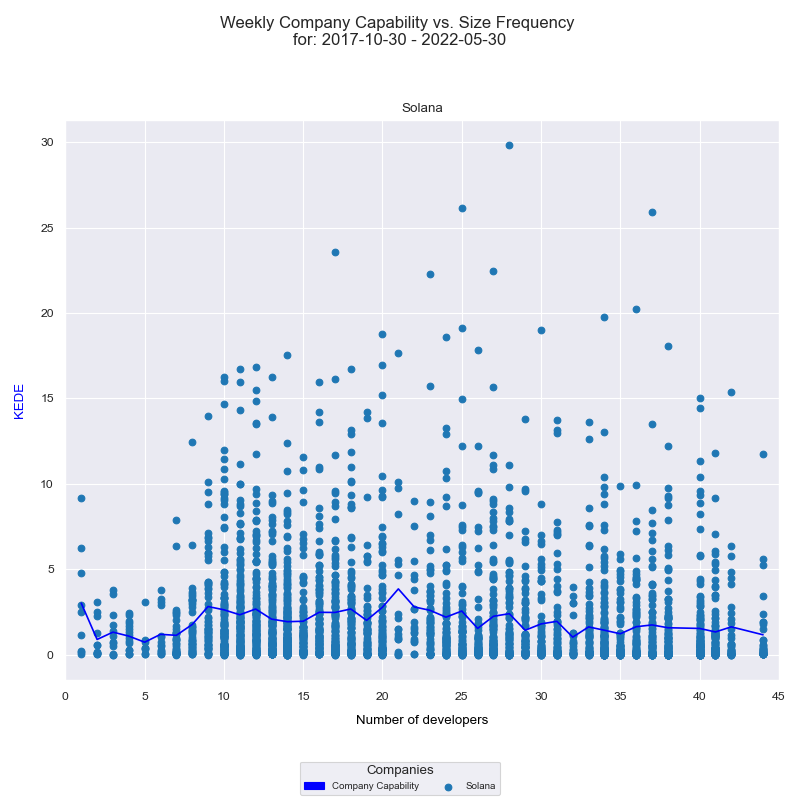
The x-axis displays the number of developers who contributed to any of the projects in a given week, while the y-axis represents the weekly KEDE values. Each individual developer's aggregated Weekly capability is presented as a light blue dot on the diagram, while the dark blue line represents the average weekly capability for all developers calculated by arithmetic mean. A detailed explanation of how this diagram was constructed can be found here. Analyzing this histogram, we once again observe that the efficiency of information acquisition tends to decrease as the number of contributing software developers increases.
Interpreting these two diagrams together, we might suggest potential issues with the level of collaboration in the organization. Challenges could arise in terms of communication, coordination, knowledge silos, individual contribution, or even information overload. While more contributors are generally beneficial, managing the complexity requires effective strategies, clear communication, and robust systems. However, it's crucial to remember that we are observing these trends from 'outside the black box'. The actual cause could be a combination of these factors, or even something entirely different. A more accurate understanding would require 'looking inside the box' to ascertain the underlying reasons.
Works Cited
1. Ziegler, A., Kalliamvakou, E., Simister, S., Sittampalam, G., Li, A., Rice, A.S., Rifkin, D., & Aftandilian, E. (2022). Productivity assessment of neural code completion. Proceedings of the 6th ACM SIGPLAN International Symposium on Machine Programming.
2. Nicole Forsgren, Margaret-Anne Storey, Chandra Maddila, Thomas Zimmermann, Brian Houck, and Jenna Butler. 2021. The SPACE of Developer Productivity: There's more to it than you think. Queue 19, 1 (2021), 20-48.
3. Bakardzhiev, D., Vitanov, N.K. (2025). KEDE (KnowledgE Discovery Efficiency): A Measure for Quantification of the Productivity of Knowledge Workers. In: Georgiev, I., Kostadinov, H., Lilkova, E. (eds) Advanced Computing in Industrial Mathematics. BGSIAM 2022. Studies in Computational Intelligence, vol 641. Springer, Cham. https://doi.org/10.1007/978-3-031-76786-9_3
4. Csikszentmihalyi, M. 1990. Flow: the psychology of optimal experience. United States of America: Harper & Row.
5. Schaffer, O. 2013. Crafting Fun User Experiences: A Method to Facilitate Flow. Human Factors International Whitepaper. Retrieved from: https://scholar.google.com/scholar?cluster=9760324565241258858
6. A. N. Meyer, E. T. Barr, C. Bird and T. Zimmermann, "Today Was a Good Day: The Daily Life of Software Developers," in IEEE Transactions on Software Engineering, vol. 47, no. 5, pp. 863-880, 1 May 2021, doi: 10.1109/TSE.2019.2904957.
7. Graziotin, D., Wang, X., & Abrahamsson, P. (2014). Happy software developers solve problems better: psychological measurements in empirical software engineering. PeerJ, 2, e289. https://doi.org/10.7717/peerj.289
8. D. Graziotin, X. Wang and P. Abrahamsson, "Software Developers, Moods, Emotions, and Performance," in IEEE Software, vol. 31, no. 4, pp. 24-27, July-Aug. 2014, doi: 10.1109/MS.2014.94.
9. Jacob Austin, Augustus Odena, Maxwell Nye, Maarten Bosma, Henryk Michalewski, David Dohan, Ellen Jiang, Carrie J. Cai, Michael Terry, Quoc V. Le, and Charles Sutton. 2021. Program Synthesis with Large Language Models. CoRR abs/2108.07732 (2021). arXiv:2108.07732 https://arxiv.org/abs/2108.07732
10. Dakhel, A. M., Majdinasab, V., Nikanjam, A., Khomh, F., Desmarais, M. C., & Jiang, Z. M. (2023). GitHub Copilot AI pair programmer: Asset or Liability? Journal of Systems and Software, 203, 111734 (23 pages). https://doi.org/10.1016/j.jss.2023.111734
11. Unleashing developer productivity with generative AI
12. Holsbeeke, L., Ketelaar, M., Schoemaker, M. M., & Gorter, J. W. (2009). Capacity, Capability, and Performance: Different Constructs or Three of a Kind? Archives of Physical Medicine and Rehabilitation, 90(5), 849–855. https://doi.org/10.1016/j.apmr.2008.11.015
13. Research: quantifying GitHub Copilot’s impact on developer productivity and happiness
14. Dochy, F., Segers, M., and Buehl, M. M. (1999). The relation between assessment practices and outcomes of studies: the case of research on prior knowledge. Rev. Educ. Res. 69, 145–186. doi: 10.3102/00346543069002145
15. Schmidt HK, Rothgangel M, Grube D. Prior knowledge in recalling arguments in bioethical dilemmas. Front Psychol. 2015 Sep 8;6:1292. doi: 10.3389/fpsyg.2015.01292. PMID: 26441702; PMCID: PMC4562264.
16. Senge, P.M. 1990: The Fifth Discipline , Random House, 1990
17. Garvin DA. Building a learning organization. Harv Bus Rev. 1993 Jul-Aug;71(4):78-91.
18. Dohmke, T., Iansiti, M., & Richards, G.L. (2023). Sea Change in Software Development: Economic and Productivity Analysis of the AI-Powered Developer Lifecycle.
19. Brynjolfsson, Erik, Danielle Li, and Lindsey R. Raymond. (2023). “Generative AI at Work”. No. w31161. National Bureau of Economic Research https://mitsloan.mit.edu/shared/ods/documents?PublicationDocumentID=9765);
20. Peng, Sida, et al. “The impact of ai on developer productivity: Evidence from GitHub Copilot”. arXiv preprint arXiv:2302.06590 (2023). https://arxiv.org/pdf/2302.06590.pdf;
21. Noy, Shakked, and Whitney Zhang (2023) “Experimental evidence on the productivity effects of generative artificial intelligence”. SSRN 4375283. https://economics.mit.edu/sites/default/files/inline-files/Noy_Zhang_1_0.pdf.
22. undar Pichai says AI is making Google engineers 10% more ...
23. Shraddha Barke, Michael B. James, and Nadia Polikarpova. 2023. Grounded Copilot: How Programmers Interact with Code-Generating Models. Proc. ACM Program. Lang. 7, OOPSLA1, Article 78 (April 2023), 27 pages. https://doi.org/10.1145/3586030
24. Vittorio Loreto et al. “Dynamics on expanding spaces: modeling the emergence of novelties”. In: Creativity and universality in language. Springer, 2016, pp. 59–83. url: https://arxiv.org/abs/1701.00994.
25. https://github.blog/2023-10-27-developers-are-the-first-group-to-adopt-ai-at-work-heres-why-that-matters/#tip-2-improve-collaboration-with-ai-powered-innersource
26. Octoverse Spotlight 2021: The Good Day Project—Personal analytics to make your work days better
27. Sweller, J. 1988. Cognitive load during problem solving: effects on learning. Cognitive Science 12(2), 257–85; https://onlinelibrary.wiley.com/doi/abs/10.1207/s15516709cog1202_4.
28. Besedeš, T., Deck, C., Sarangi, S., & Shor, M. (2015). Reducing choice overload without reducing choices. Review of Economics and Statistics, 97(4), 793-802.
29. Deck, C., & Jahedi, S. (2015). The effect of cognitive load on economic decision making: A survey and new experiments. European Economic Review, 78, 97-119.
30. Miller, G. A. The magical number seven, plus or minus two: some limits on our capacity for processing information. Psychol Rev 63, 81 (1956).
31. Vogel EK, Machizawa MG. Neural activity predicts individual differences in visual working memory capacity. Nature. 2004 Apr 15;428(6984):748-51. doi: 10.1038/nature02447. PMID: 15085132.
32. Fukuda K, Vogel E, Mayr U, Awh E. Quantity, not quality: the relationship between fluid intelligence and working memory capacity. Psychon Bull Rev. 2010 Oct;17(5):673-9. doi: 10.3758/17.5.673. PMID: 21037165; PMCID: PMC3050565.
33. Unsworth N, Fukuda K, Awh E, Vogel EK. Working memory and fluid intelligence: capacity, attention control, and secondary memory retrieval. Cogn Psychol. 2014 Jun;71:1-26. doi: 10.1016/j.cogpsych.2014.01.003. Epub 2014 Feb 14. PMID: 24531497; PMCID: PMC4484859.
34. Cowan, N. (2001). The magical number 4 in short-term memory: A reconsideration of mental storage capacity. Behavioral and Brain Sciences, 24(1), 87-114. doi:10.1017/S0140525X01003922
35. Levitin, D. J. (2015). The Organized Mind: Thinking Straight in the Age of Information Overload (Illustrated edition). Dutton.
“120 bits per second This estimate derives independently from Csikszentmihalyi (2007) and the Bell Labs engineer Robert Lucky, who made an independent estimate that regardless of the modality, the cortex cannot take in more than 50 bits/second—within an order of magnitude of Csikszentmihalyi’s. Csikszentmihalyi explains his estimate: “As George Miller and others have suggested, we can process 5–7 bits of information in one apperception; each apperception takes at least 1/15th of a second; hence 7 × 15=105 bits/second. Nusbaum has calculated that understanding verbal material takes on the average 60 bits/second.”
36. Greifeneder, R., Scheibehenne, B., & Kleber, N. (2010). Less may be more when choosing is difficult: Choice complexity and too much choice. Acta Psychologica, 133, 45-50. doi:10.1016/j.actpsy.2009.08.005
37. Schwartz, B., & Schwartz, B. (2004). The paradox of choice: Why more is less.
38. Choo, C. (1994). Perception and use of information sources by chief executives in environmental scanning, Library & Information Science Research, Volume 16, Issue 1
How to cite:
Bakardzhiev D.V. (2023) Evaluating Copilot's impact on developer productivity, work experience and talent utilization https://docs.kedehub.io/kede-manage/kede-copilot.html
Getting started


