Organizational dashboard
It keeps management's eyes on what is important to steering the organization
Overview
The organizational dashboard is a tool used by management to clarify and assign accountability for the “critical few” key objectives, key indicators, and projects needed to steer an organization toward success.
At the top of the Dashboard, there are several tabs as shown in the image below.
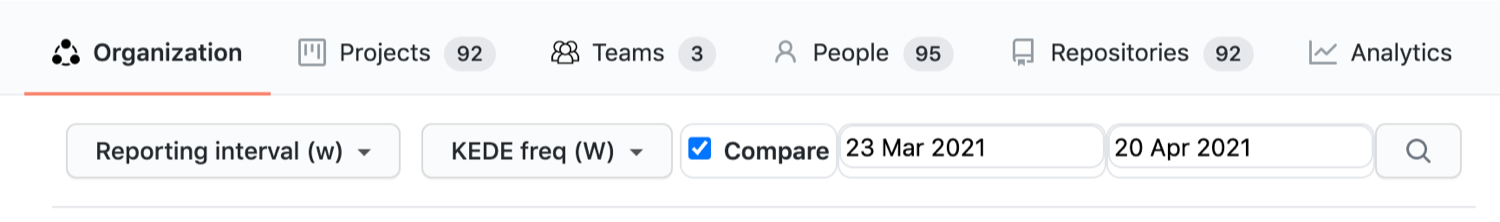
Here is all the information you need in order to analyze and measure the efficiency of your organization grouped into nine tabs:
- Organization. This tab contains the reports that are useful mainly for the CEO and the CTO/VP of Engineering. You can see how your company is performing.
- Projects. This tab contains the reports that are useful primarily for Program and Project Managers. You can see how your projects are performing and compare them. On the Projects tab is presented the number of your company's projects.
- Teams This tab contains the reports that are useful primarily for Engineering Managers and Team Leads. You can see how your teams are performing and compare them. The number of your company's teams is displayed on the Teams tab.
- People. This tab contains the reports that are primarily useful for Engineering Managers, Team Leads and Project Managers. You can see how your teammates are performing and compare them. The number of Active Users, defined as users who have committed code to repositories linked to your company in the four weeks before the latest commit, is displayed on the People tab.
-
Outliers
In software development, a "template" refers to a section of source code that bears striking similarity to code found elsewhere, often resulting from copy-pasting practices.
These templates can exist as standalone text files or snippets of code copied and inserted into text files.
To learn more about templates, please refer to the following explanation.
KEDEHub automatically detects and excludes such templates during the calculation of KEDE. However, there are instances where manual inspection is required to verify if suspected templates are indeed duplicates. To facilitate this process, KEDEHub provides a dedicated tool called "Outliers." Accessible through the application menu, this tool streamlines the identification and handling of suspected templates. You can reach it form the application manu as presented in the image below.
- Repositories. This tab allows you to see all Git repositories which are assigned to your organization. The number of repositories linked to the company is displayed on the Repositories tab.
- Analytics. This tab contains analytics tools that allow you to slice and group data about your projects, teams, and people.
- Forecasting. This tab allows you to forecast new projects.
- Security. This tab allows you to set up your company's security-related configuration.
Project Delivery Tracker
Project Delivery Tracker provides the necessary context to promote healthy discussion around how to balance competing priorities and finite resources.
Below is a screenshot of how Project Delivery Tracker looks like.
Each row of the table presents the metrics for a single project. A row is divided into four main columns: "Project Name," "Predictability," "Allocation," and "Process Quality." Each column is divided into several sub-columns as explained here:
- Predictability measures the accuracy with which the efficiency of an organization can be forecasted. Values range between 0 and 100. Higher values are better.
-
Project allocation metrics answer the question:
"What percentage of our team is allocated on each of our projects?"
-
 FTE (Full Time Equivalent)
measures work in units of full time employees. A project with 5 people spending half of their time on it will tally as 2.5 FTEs.
FTE (Full Time Equivalent)
measures work in units of full time employees. A project with 5 people spending half of their time on it will tally as 2.5 FTEs.
-
 Percentage allocation
is the percentage of all developers assigned to a peoject.
Percentage allocation
is the percentage of all developers assigned to a peoject.
-
 Estimated Cost
attaches dollar amounts to work estimates, using a baseline annual cost per engineer.
By chamging the default value of $650/day in the futter of the diagram, you can change the cost.
Estimated Cost
attaches dollar amounts to work estimates, using a baseline annual cost per engineer.
By chamging the default value of $650/day in the futter of the diagram, you can change the cost.
-
-
Process Quality Metrics monitor the quality of the engineering process and not just the output and trailing indicators
like how many lines of code the team wrote, when the project is going to be delivered or even how many bugs were found:
-
 Efficiency
quantifies the balance between individual capability and work complexity. Values range between 0 and 100. Higher values are better.
Efficiency
quantifies the balance between individual capability and work complexity. Values range between 0 and 100. Higher values are better.
-
 Happiness
measures how close developers are to the state of Flow, which is achieved when there is balance between individual capability and work complexity, with a slight inclination towards challenges..
Values range between 0 and 100. Higher values are better.
Happiness
measures how close developers are to the state of Flow, which is achieved when there is balance between individual capability and work complexity, with a slight inclination towards challenges..
Values range between 0 and 100. Higher values are better.
 Rework
measures how much of the knowledge used to develop software is found to be incorrect and replaced with new information. Lower values are better.
Rework
measures how much of the knowledge used to develop software is found to be incorrect and replaced with new information. Lower values are better.
 Cognitive Load
is the total amount of mental effort required for a task. Measured as the number of alternative solutions that a developer needs to consider. Values range between 0 and 100. Lower values are better.
Cognitive Load
is the total amount of mental effort required for a task. Measured as the number of alternative solutions that a developer needs to consider. Values range between 0 and 100. Lower values are better.
Start and end dates of the report can be selected using the date pickers at the top of the dashboard.
If you want to see details for a specific metric for a specific project, click on the value of the metric.
Getting started
Need help?
-


