Teams
Understand the capability of your teams
Overview
On the Teams tab is presented the total number of company teams. In this case it is 2.
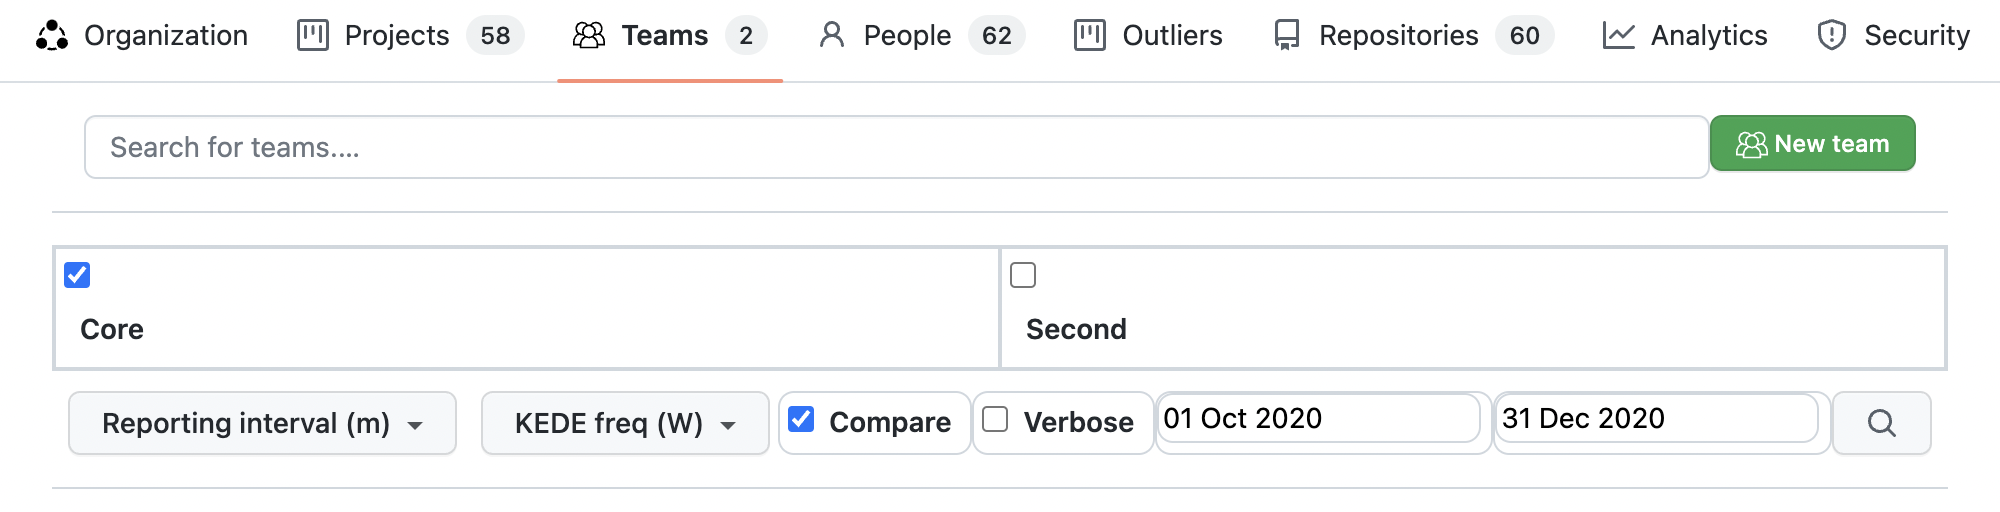
Below it is the search box for teams. You can search for your company's teams by name. Search looks into your company's teams by name and returns up to 10 results. Initially are listed the 10 company's teams most active in the last 30 days before the latest commit date for the company.
Also a new team can be created by clicking the "New team" button.
Report parameters that can be selected are:
- Reporting interval - can be daily, weekly, monthly or quarterly.
- KEDE frequency - could be daily or weekly.
- Compare - Switch on/off comparability with the rest of the world.
- Verbose - Switch on/off showing the individual data points.
- Start and end dates of the report.
Team Capability Across Time
Process capability is defined as a statistical measure of the inherent process variability of Knowledge Discovery Efficiency (KEDE), which quantifies the balance between individual capability and work complexity.
Weekly KEDE for a team is calculated as follows:
- A developer can be assigned to one or more teams. A team membership has a start and end date.
- A developer commits to a repository. A repository can be assigned to a project.
- We take all developers who belonged to a team for a selected time period and contributed code to any of the company's projects' repositories during the same, already selected time period.
- For each developer Weekly KEDE is aggregated over all repositories. For example, if developer A contributed to repositories R1 and R2 during a week and Weekly KEDE for R1 was 2 and Weekly KEDE for R2 is 3 then the developers's Weekly KEDE would be 5 for that project for that week.
The same procedure is followed for Daily KEDE.
Analyzing the capability of a team is essential for understanding its productivity and efficiency. The diagram below presents a time series of a team's capability for a selected period across selected projects.
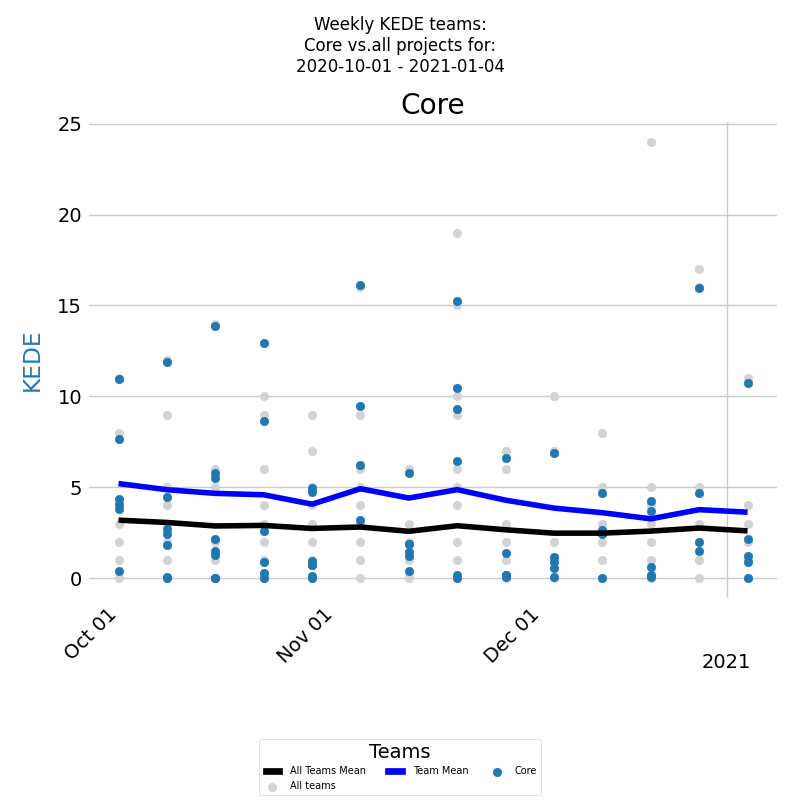
On the x-axis, you have the month dates, and on the y-axis, you have the weekly KEDE values. Each colored dot represents an individual developer's Weekly KEDE, and the dark blue line is the average weekly KEDE for all the developers in the team calculated by EWMA.
In addition, it's important to compare the team's performance with the average performance of the company. This is presented by the Weekly KEDE for all developers who contributed code to any of the company projects during the selected time period. Each individual developer's Weekly KEDE is presented as a light gray dot, and the black line is the average weekly KEDE for those developers calculated by EWMA.
Furthermore to tracking the team's performance across all projects, it is also useful to analyze their capability on specific projects. For this, you can select the projects you want to analyze and view the Weekly KEDE for only those projects. The logic remains the same, with the only difference being that you're analyzing the team's performance on a subset of projects.
The same report can be run for Daily KEDE, providing a more granular view of the team's performance. Overall, analyzing the team's capability across time and projects is essential for improving productivity, identifying strengths and weaknesses, and making data-driven decisions to improve the team's performance.
Distribution of Team Capability
Process capability is defined as a statistical measure of the inherent process variability of Knowledge Discovery Efficiency (KEDE), which quantifies the balance between individual capability and work complexity.
Along with the time series of the team's capability, it's very useful to see a histogram of the underlying frequency distribution. A frequency distribution shows how often each different value in a set of data occurs.
The diagram below presents a histogram of weekly averaged KEDE values for a selected period. On the x-axis, we have the Weekly KEDE, and on the y-axis, we have the percentage of each particular value.
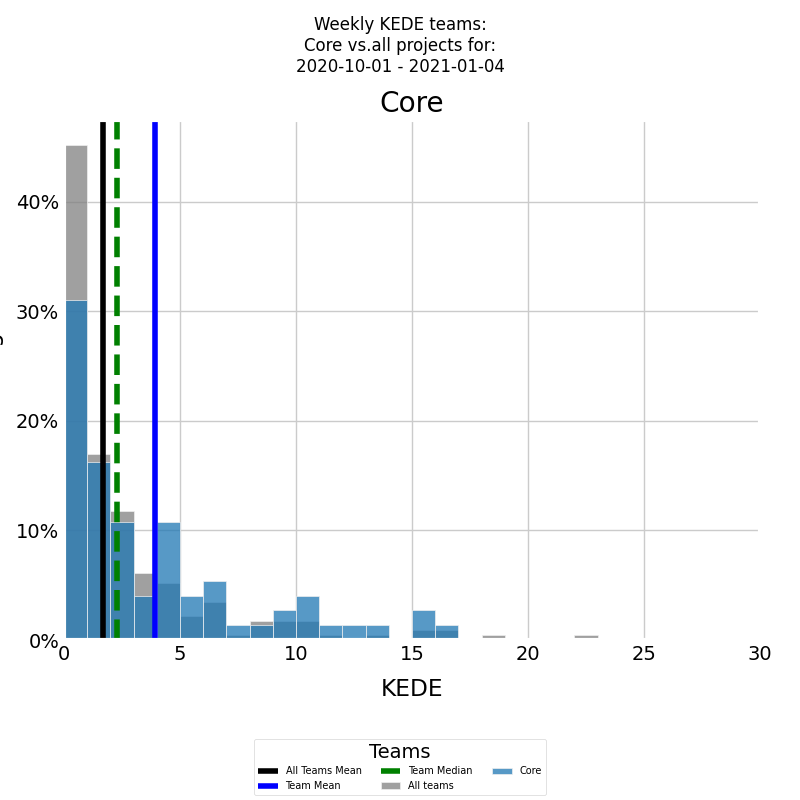
Firstly, we are interested in the team's summarized historical capability. That is presented by the histogram in color of the Weekly KEDE frequency of the developers who were assigned to the team for the selected period. The blue vertical line is the average weekly KEDE for the team for the selected period, calculated by arithmetic mean. The median Weekly KEDE for the team for the selected period is presented by the green vertical dashed line.
Secondly, we are interested in the summarized historical capability of the company. That is presented by the histogram in gray of the Weekly KEDE frequency of all other company developers who contributed to all other company teams during the selected time period. The black vertical line is the average weekly KEDE of all other developers, calculated by arithmetic mean.
This report can also be run for Daily KEDE. Additionally, it's useful to show the capability of a team only across selected projects. The logic is the same, only this time we select Weekly KEDE only for the selected projects.
Comparing Capability of Teams: Time Series and Frequency Distribution
Process capability is defined as a statistical measure of the inherent process variability of Knowledge Discovery Efficiency (KEDE), which quantifies the balance between individual capability and work complexity.
Analyzing and comparing teams' capabilities to the company average can provide valuable insights for project and schedule management, as well as for identifying areas where teams may need additional resources or support. The diagram below presents a time series of Weekly KEDE values for two teams for a selected period across all projects.
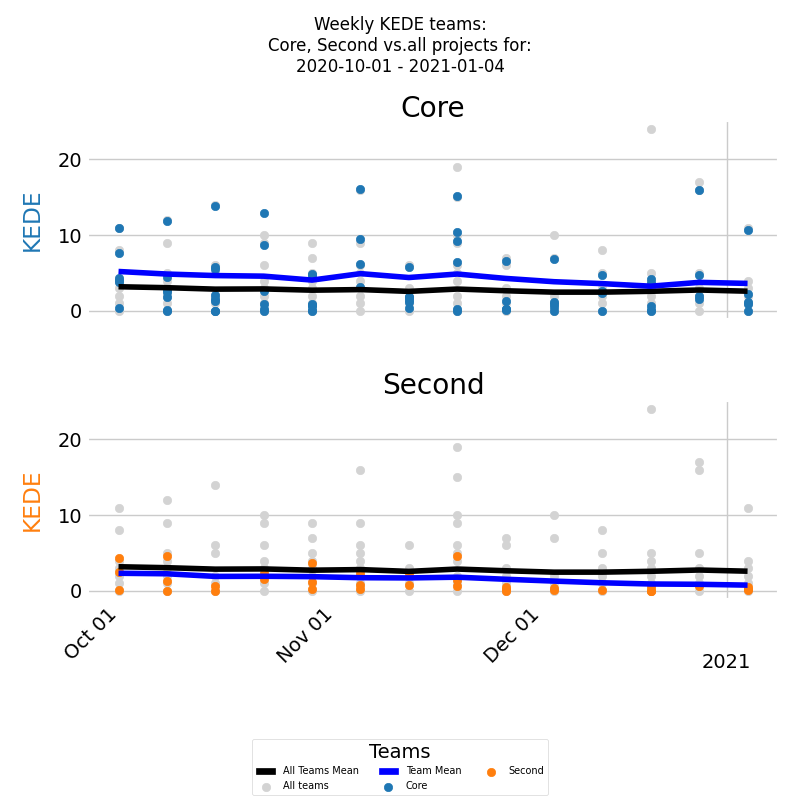
Each team's average capability is presented by the dark blue line, while the black line represents the average weekly KEDE for the company as a whole. From the diagram, it can be observed that the first team's average capability is higher than the company average, indicating that they have been performing exceptionally well during the selected period. Conversely, the second team's average capability is less than the company average, suggesting that they may need further support to improve their performance.
Along with the time series of the capability of the teams, it's very useful to see histograms of the underlying frequency distributions. The diagram below presents histograms of weekly averaged KEDE values for the same two teams.
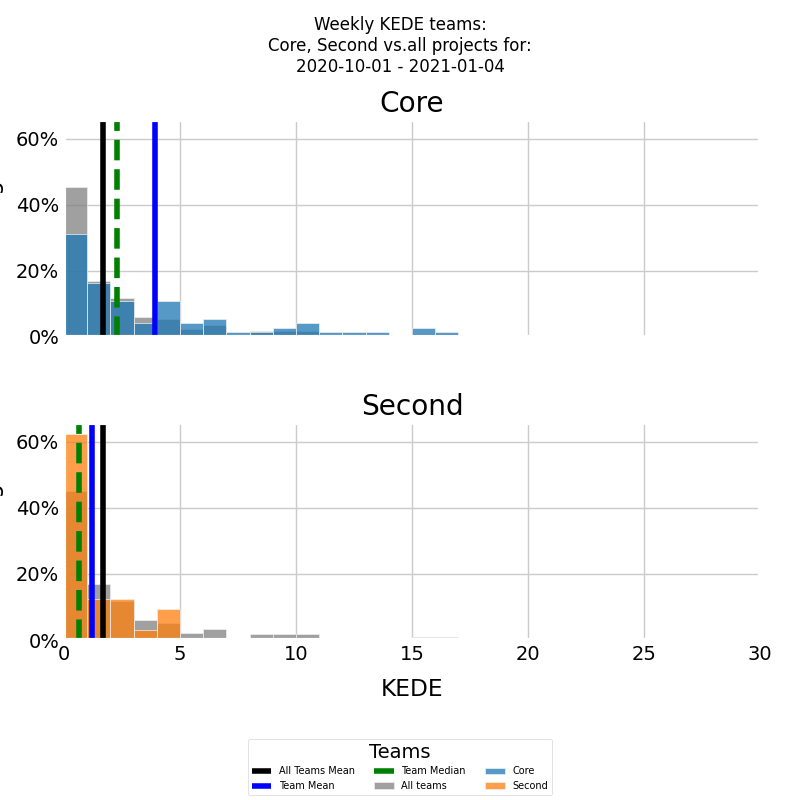
Each team's average capability is presented by the blue vertical line, and the median weekly KEDE for each team for the selected period is presented by the green vertical dashed line. The vertical black line represents the average weekly KEDE for the company. For the first team, both the median and the average capability are higher than the company average capability, while the median and average of the second team are less than the company average.
It's also possible to show the capability of teams only across selected projects using the same logic, selecting Weekly KEDE only for the selected projects. Furthermore, this report can also be generated for Daily KEDE.
Resource Allocation
To gain deeper insight into the contribution of individual developers to a team's capability, the chartpresents the capability of the team over a time period, broken down by the individual developers who contributed to the team during that time.
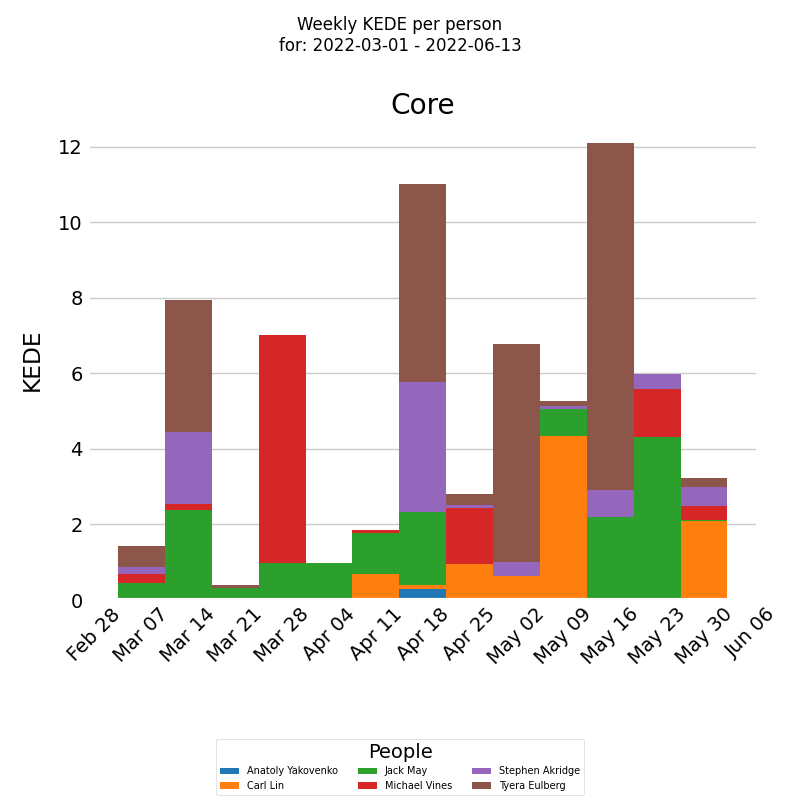
On the x-axis, we have the week dates, and on the y-axis, we have the KEDE values. The chart displays a series of stacked bars, with each bar representing the KEDE for the selected team. Each bar is divided into multiple boxes, with each box corresponding to the fraction of KEDE contributed by a specific software developer. The legend lists all the developers who contributed to the selected team, and the colors in each bar indicate which developer made each contribution.
By using this chart, it is possible to identify which developers had the greatest impact on the team's capability during a given week or time period. This information can help organizations to optimize their development teams and assign tasks more effectively, ultimately improving team outcomes.
This chart can also be generated for Daily KEDE and for multiple teams.
Team Happiness Over Time
Happiness level for a team is calculated as follows:
- Take all developers who contributed code to any of the team's repositories during a selected time period.
- For each developer, their Happiness level is computed by aggregating Happiness levels values over all repositories they contributed to during that week. For instance, if developer A contributed to repositories R1 and R2 during a week, and the Happiness level values for R1 and R2 were 20 and 30 respectively, then the developer's Happiness level for that team and week would be 50.
KEDEHub provides insights into team average happiness over time, allowing organizations to monitor and identify trends in their performance. The diagram below presents a time series of Happiness levels for a selected team over a given period. On the x-axis, the diagram displays the week dates, while on the y-axis, it shows the Happiness levels.
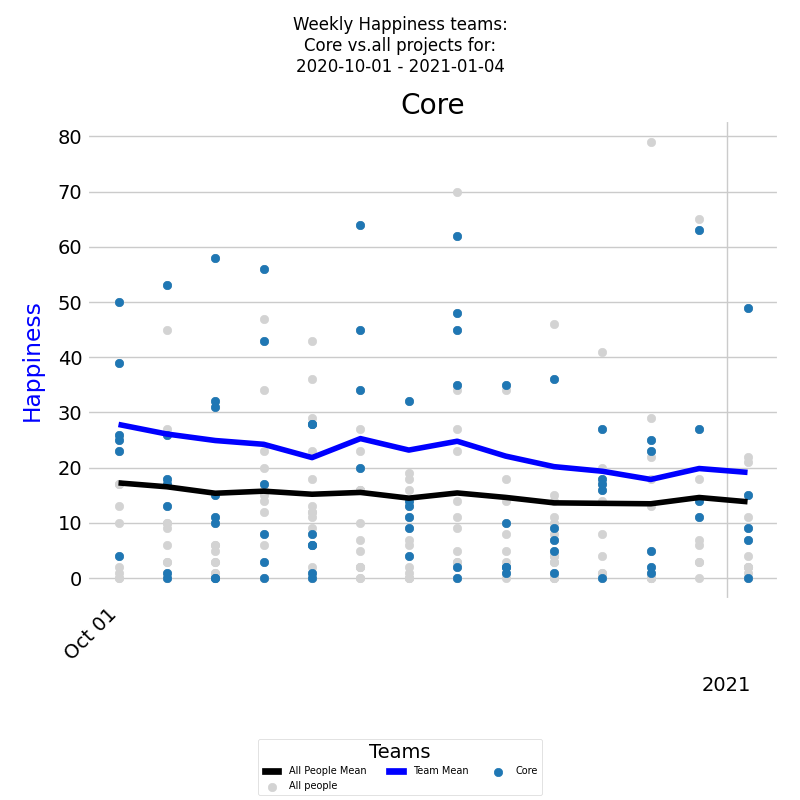
Each colored dot represents an individual developer's Happiness level, and the blue line represents the average Happiness level for all developers calculated by EWMA.
In addition, it's important to compare the team's happiness with the average happiness of the company. This is presented by the Weekly Happiness for all developers who contributed code to any of the company projects during the selected time period. Each individual developer's Weekly Happiness is presented as a light gray dot, and the black line is the average weekly Happiness for those developers calculated by EWMA.
This report can be generated for Daily Happiness as well. Additionally, the same report can be run for multiple teams, allowing organizations to compare and analyze their team Happiness level across various initiatives.
Distribution of Team Happiness
In addition to tracking a team's Happiness level over time, it is also useful to examine the underlying frequency distribution of its Happiness levels. A frequency distribution provides insights into the distribution of the Happiness values and how often each value occurs.
The diagram below displays a histogram of averaged Happiness levels for a selected period, with the x-axis representing the Happiness level and the y-axis showing the percentage of each particular value.
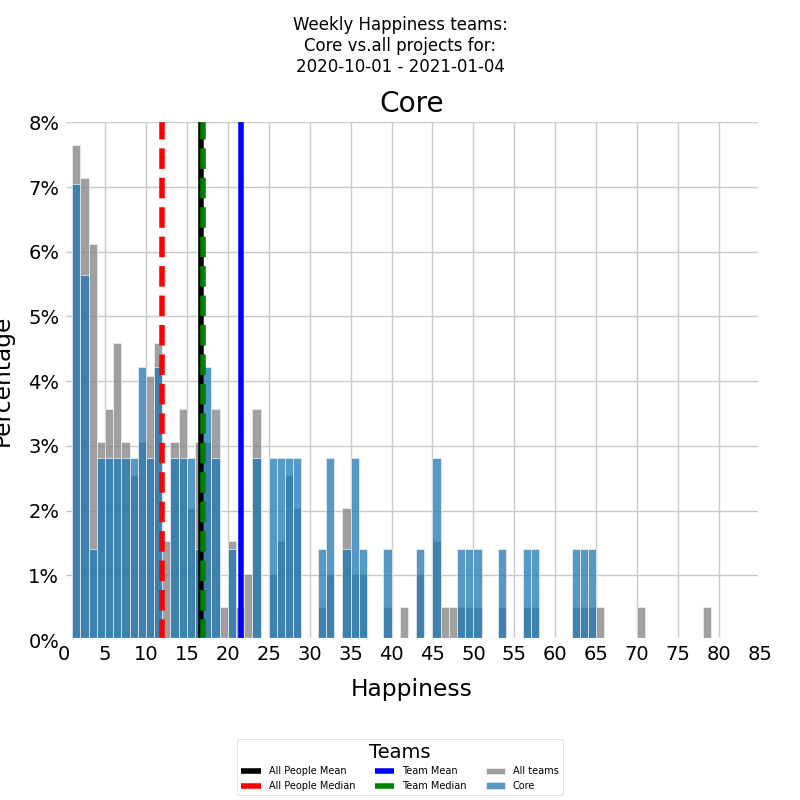
Firstly, we are interested in the team's summarized historical Happiness. That is presented by the histogram in color of the Weekly Happiness frequency of the developers who were assigned to the team for the selected period. The blue vertical line is the average weekly Happiness for the team for the selected period, calculated by arithmetic mean. The median Weekly Happiness for the team for the selected period is presented by the green vertical dashed line.
Secondly, we are interested in the summarized historical Happiness of the company. That is presented by the histogram in gray of the Weekly Happiness frequency of all other company developers who contributed to all other company teams during the selected time period. The black vertical line is the average weekly Happiness of all other developers, calculated by arithmetic mean. The median Weekly Happiness for all other developers is presented by the red vertical dashed line.
This report can also be run for Daily Happiness. Additionally, it's useful to show the Happiness of a team only across selected projects. The logic is the same, only this time we select Weekly Happiness only for the selected projects.
Impact of Team Size on its Capability
Process capability is defined as a statistical measure of the inherent process variability of Knowledge Discovery Efficiency (KEDE), which quantifies the balance between individual capability and work complexity.
The size of a software development team can have a significant impact on its capability, as larger teams may face greater challenges in collaboration and coordination. To better understand this relationship, KEDEHub provides two diagrams for analysis.
The first diagram is a time-series chart that shows how team capability is affected by team size over time.
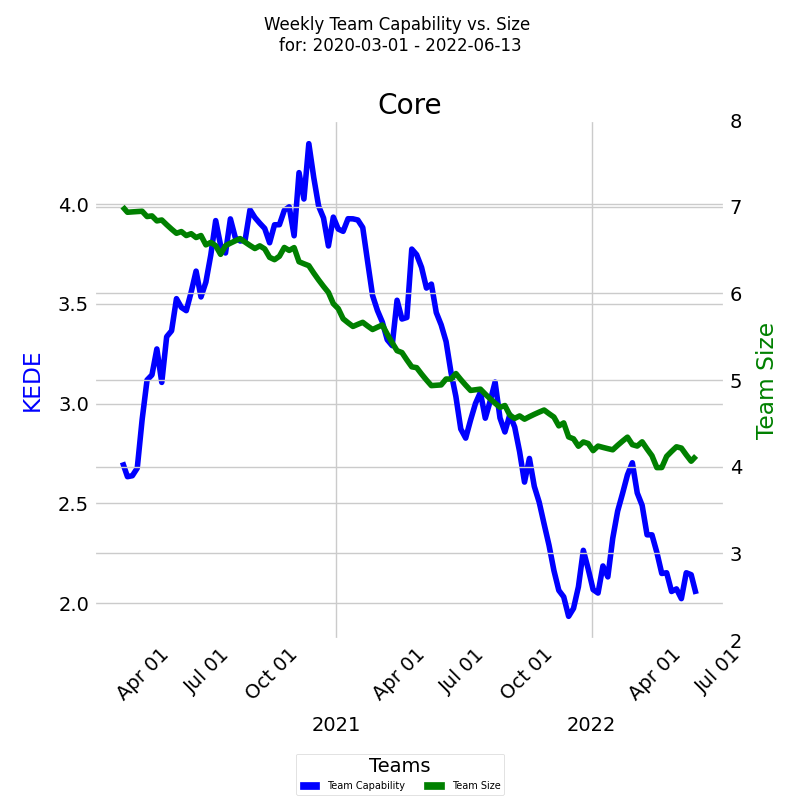
The x-axis displays the week dates, while the two y-axes represent the capability and size of the team. The capability axis, located on the left, is measured in Weekly KEDE values and is represented by a dark blue line calculated using the Exponentially Weighted Moving Average (EWMA) method. Each point on the blue line represents the average Weekly KEDE for all developers who contributed in that week. On the right, the team size axis is represented by a green line that shows the number of developers who contributed to the team in a given week. How the diagram is constructed is available here.
This chart can provide valuable insights into how team size affects capability, helping organizations better manage their teams, schedules, and costs.
Distribution of Capability vs. Number of Developers
Process capability is defined as a statistical measure of the inherent process variability of Knowledge Discovery Efficiency (KEDE), which quantifies the balance between individual capability and work complexity.
Along with the time series of a team's capability, it's also useful to analyze the underlying frequency distribution. A histogram can display how often each different value in a set of data occurs. The diagram below shows the team size that achieved the highest weekly averaged KEDE values for a selected period.
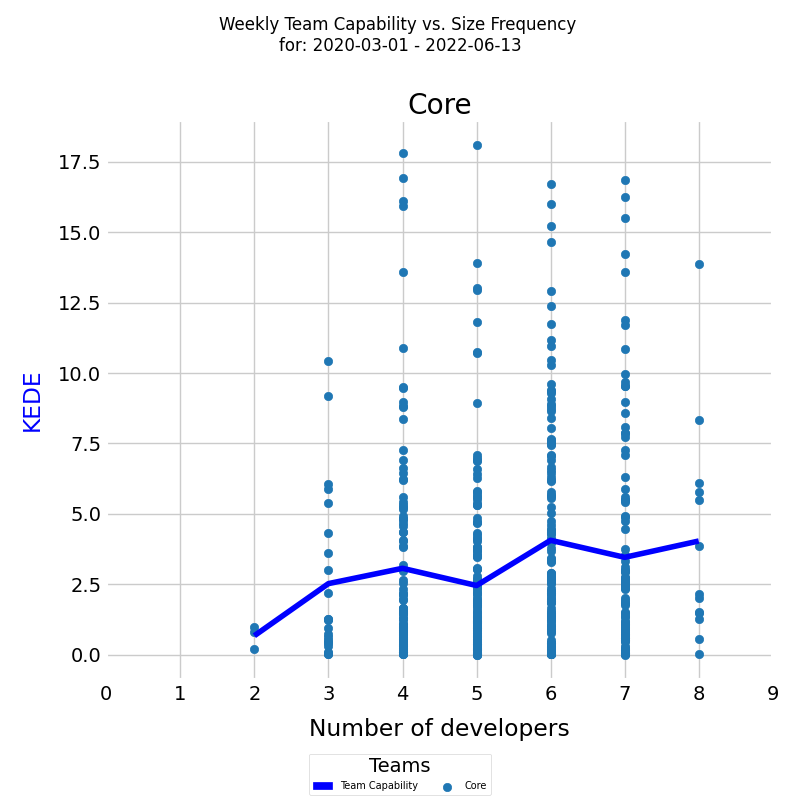
On the x-axis, we have the number of developers who contributed to the team in a given week. On the y-axis, we have the percentage of each particular value. Each individual developer's aggregated weekly capability is represented as a light blue dot on the diagram. The dark blue line is the average weekly capability for all developers, calculated by arithmetic mean. How the diagram is constructed is available here.
This analysis can provide insights into how team size affects the capability of the team and inform team and schedule management decisions.
Team Information Loss Rate Over Time
Rework level for a team is calculated as follows:
- Take all developers who contributed code to any of the company's repositories during a selected time period.
- For each developer, their waste level is computed by aggregating waste levels values over all repositories they contributed to during that week. For instance, if developer A contributed to repositories R1 and R2 during a week, and the waste level values for R1 and R2 were 2 and 3 bits lost respectively, then the developer's waste level for that team and week would be 5 bits lost.
KEDEHub provides insights into team average waste over time, allowing organizations to monitor and identify trends in their performance. The diagram below presents a time series of waste levels for a selected team over a given period. On the x-axis, the diagram displays the week dates, while on the y-axis, it shows the waste levels.
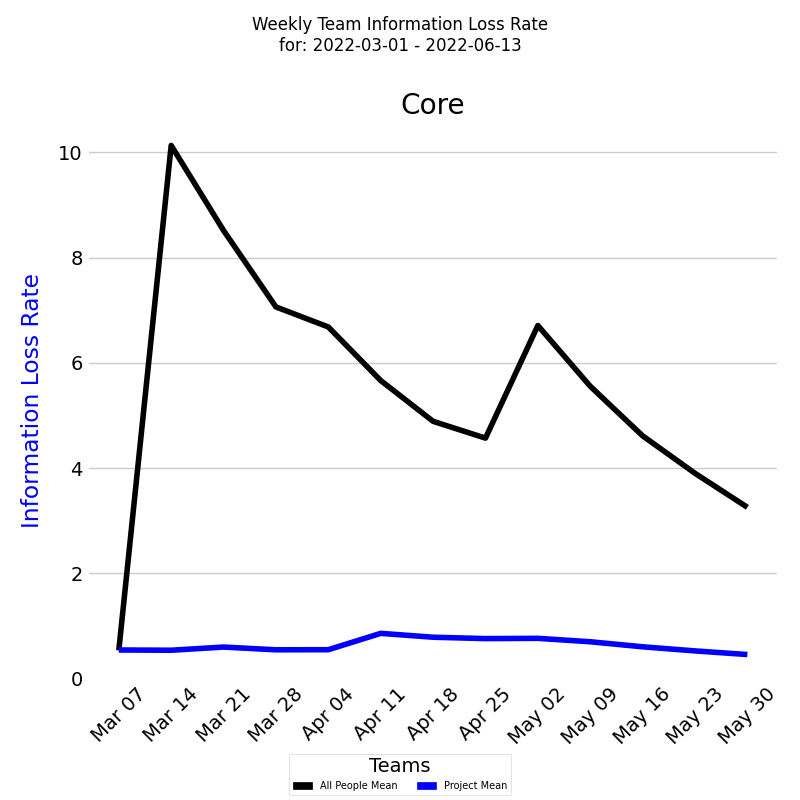
Each colored dot represents an individual developer's waste level, and the dark blue line represents the average waste level for all developers calculated by EWMA.
In addition, it's important to compare the team's waste with the average waste of the company. This is presented by the Weekly waste for all developers who contributed code to any of the company projects during the selected time period. Each individual developer's Weekly waste is presented as a light gray dot, and the black line is the average weekly waste for those developers calculated by EWMA.
This report can be generated for Daily waste as well. Additionally, the same report can be run for multiple teams, allowing organizations to compare and analyze their team waste level across various initiatives.
Distribution of Team Information Loss Rate
In addition to tracking a team's Rework level over time, it is also useful to examine the underlying frequency distribution of its waste levels. A frequency distribution provides insights into the distribution of the capability values and how often each value occurs.
The diagram below displays a histogram of averaged waste levels for a selected period, with the x-axis representing the waste level and the y-axis showing the percentage of each particular value.
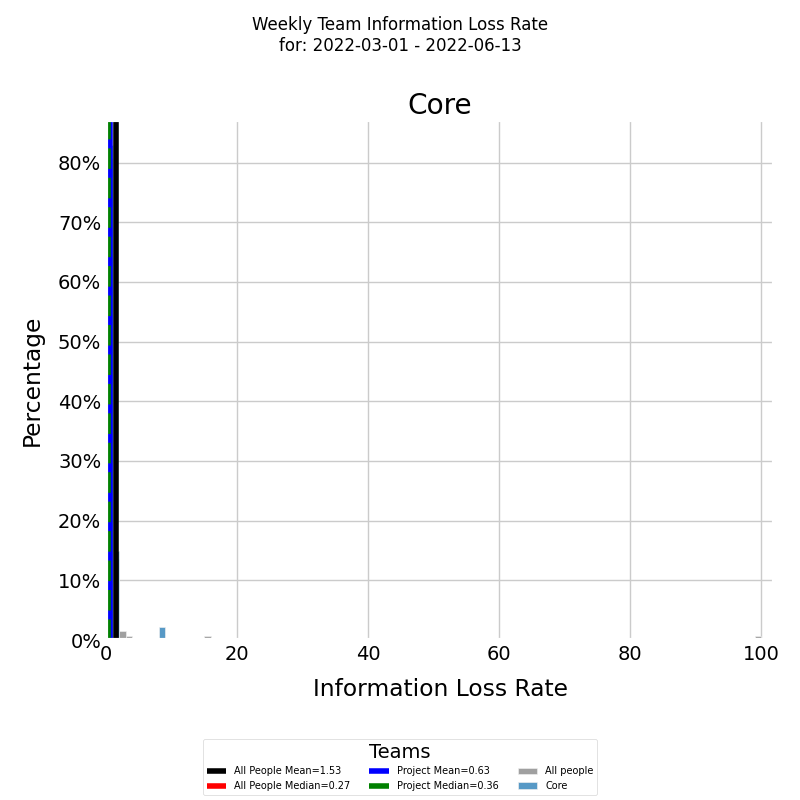
The histogram is presented in color for the selected team, with the blue vertical line representing the average waste level for the team for the selected period, calculated using arithmetic mean. The median waste level for the team for the selected period is presented by the green vertical dashed line.
In addition, it's important to compare the team's waste with the average waste of the company. To do this you need to select 'compare' from the diagram options. This is presented by the waste for all developers who contributed code to any of the company projects during the selected time period. Each individual developer's waste is presented as a light gray dot, and the black line is the average waste for those developers calculated by EWMA. The median Weekly waste for all other developers is presented by the red vertical dashed line. To see the individual dots you need to select 'verbose' from the diagram options.
The same report can also be run for Daly waste and for multiple teams.
In the histogram visualization, values have been adjusted for clarity:
- Values Above 100: Any data point greater than 100 is grouped into a single bin at the 100 mark.
This method provides a clear representation by highlighting the distribution of the majority of the data. However, it's crucial for viewers to note that for visualization purposes, extreme values (below 1 or above 100) are grouped into their respective edge bins.
Getting started


