People
Understand the capability of your people
Overview
On the People tab is presented the total number of company developers. In this case it is 62.
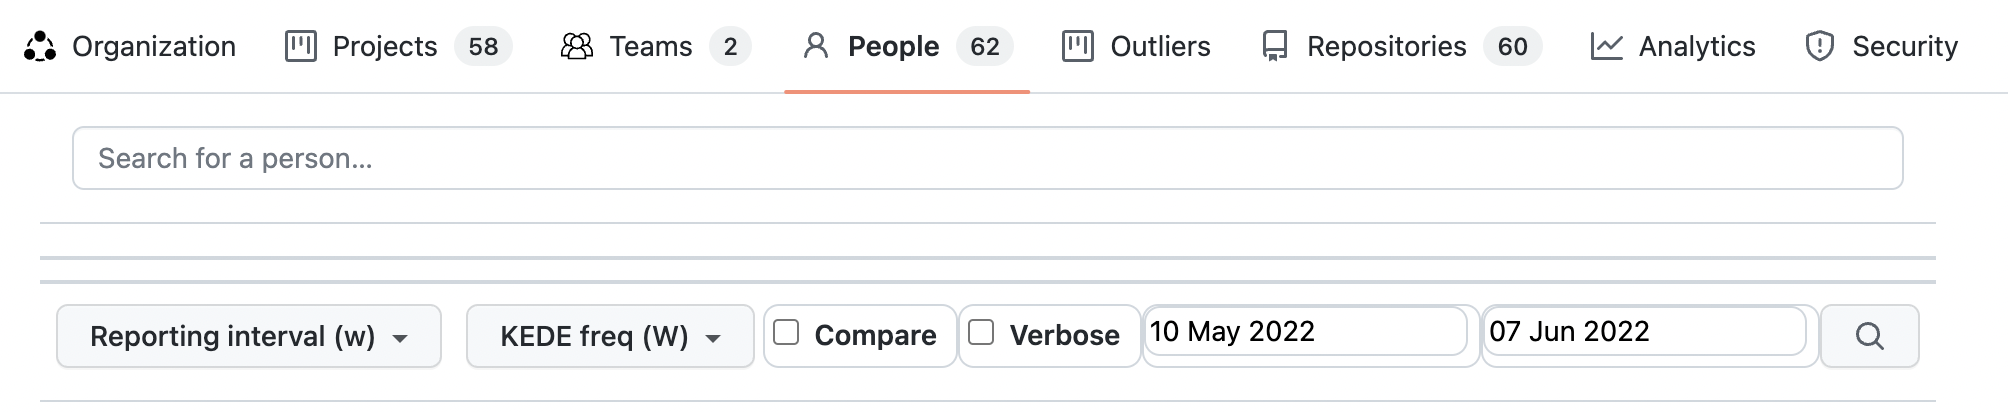
Below it is the search box for people. You can search for a developer by name. Search looks into your company's developers by name and returns up to 10 results.
Report parameters that can be selected are:
- Reporting interval - can be daily, weekly, monthly or quarterly.
- KEDE frequency - could be daily or weekly.
- Compare - Switch on/off comparability with the rest of the world.
- Verbose - Switch on/off showing the individual data points.
- Start and end dates of the report.
Developer's Capability Over Time
Process capability is defined as a statistical measure of the inherent process variability of Knowledge Discovery Efficiency (KEDE), which quantifies the balance between individual capability and work complexity.
Weekly KEDE for a developer is calculated as follows:
- A developer commits to a repository. The repository is assigned to a a project.
- We take all developers who contributed code to any of the company's projects' repositories during during the selected time period.
- For each developer Weekly KEDE is aggregated over all repositories. For example, if developer A contributed to repositories R1 and R2 during a week and Weekly KEDE for R1 was 2 and Weekly KEDE for R2 is 3 then the developers's Weekly KEDE would be 5 for that project for that week.
The same procedure is followed for Daily KEDE.
In order to assess the historical capability of a developer, it's important to examine their performance over time. The diagram below provides a time series of the capability of a developer for a selected period across all projects.
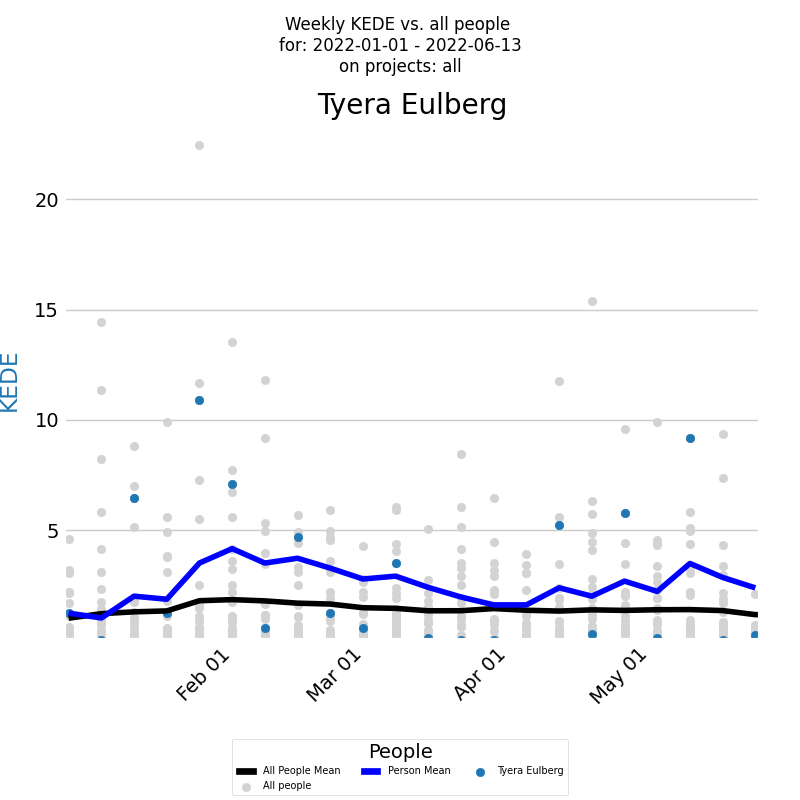
The x-axis displays the week dates, while the y-axis represents weekly KEDE values. The blue dot on the diagram for each week represents the developer's capability. The dark blue line on the diagram represents the average weekly KEDE for the developer, calculated using EWMA.
To compare the developer's capability with the average capability of the company, you can view the Weekly KEDE for all developers who contributed code to any of the company projects during the selected time period. Each individual developer's weekly capability is presented as a light gray dot, and the black line represents the average weekly capability for those developers, calculated using EWMA.
This report can also be generated for Daily KEDE values, and it is possible to view the capability of a developer only on selected projects by selecting the appropriate filters.
Distribution of a Developer's Capability
Process capability is defined as a statistical measure of the inherent process variability of Knowledge Discovery Efficiency (KEDE), which quantifies the balance between individual capability and work complexity.
When inspecting a developer's capability over time, it's also useful to see the underlying frequency distribution of their weekly averaged KEDE values. A histogram can show how often each different value occurs. The diagram below presents such a histogram for a selected period.
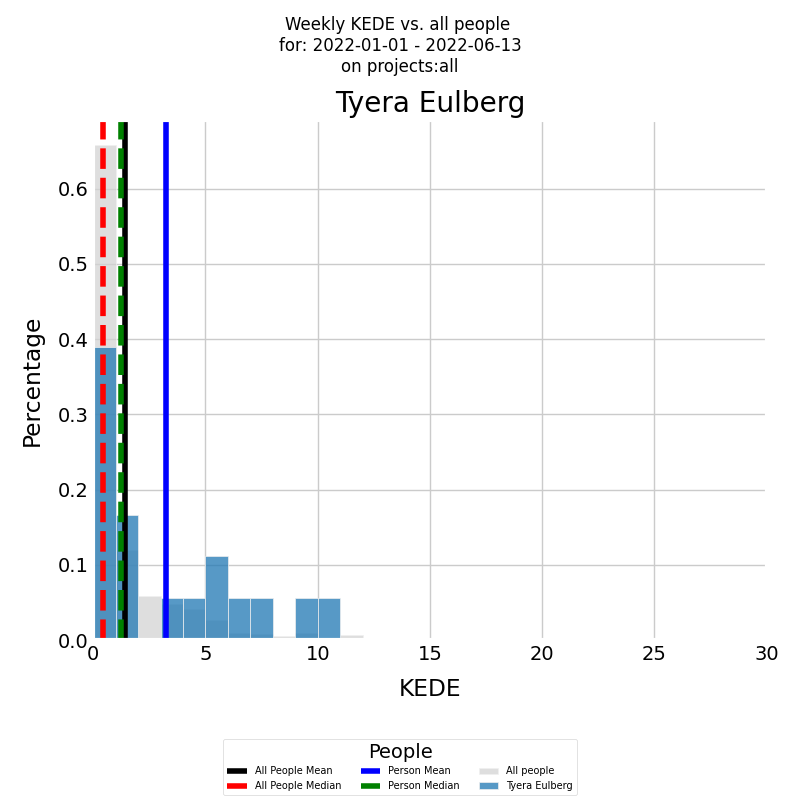
On the x-axis, you have the Weekly KEDE, and on the y-axis, you have the percentage of each particular value.
First, the developer's summarized historical capability is presented by the histogram in color of the Weekly KEDE frequency for the selected period. The blue vertical line is the average weekly capability for the developer for the selected period, calculated by arithmetic mean. The median weekly capability for the developer for the selected period is presented by the green vertical dashed line.
It's also possible to show the capability of a developer only on selected projects. The same logic applies, but this time, you select Weekly KEDE only for the selected projects. The same report can be run for Daily KEDE.
Developer Allocation
Resource allocation involves assigning available resources to projects in the most effective way. Resources can include people, equipment, finances, and time.
In software development, knowledge is considered the primary resource. This knowledge is embodied in people. It is referred to as "developer's capabilities," which encompass the comprehensive set of skills, experience, and theoretical knowledge that a developer possesses. These capabilities include their ability to understand complex problems, utilize technical skills, and apply their knowledge practically to create effective software solutions.
This resource is allocated when it is applied to produce tangible outputs, such as working software.
The emphasis is on how this resource is distributed to ensure that every aspect of the project is covered efficiently, and the resource is utilized without waste. For developers, this involves determining who works on what tasks and how much of their capability is dedicated to various activities. It’s about matching the available resources to the demands of all projects effectively.
Developer Allocation Measurement
To effectively measure this allocation of knowledge, we use the Knowledge Discovery Efficiency (KEDE) metric. KEDE values range from 0 to 100, representing the extent of a developer's knowledge application:
- A KEDE value of 0 indicates no allocation of the developer's capabilities—meaning the developer's knowledge is not being applied to the project at that time.
- A KEDE value of 100 signifies full allocation, where the developer's capabilities are fully utilized in applying knowledge to project tasks.
This metric helps in assessing how effectively the knowledge and skills of software developers are being utilized in the development process, ensuring that projects are staffed optimally and that each developer's talents are used efficiently.
The developer allocation diagram below answers the questions: "How a developer's workload is distributed, which projects are consuming most of their talent, and how their skills and efforts are being utilized within the organization?"
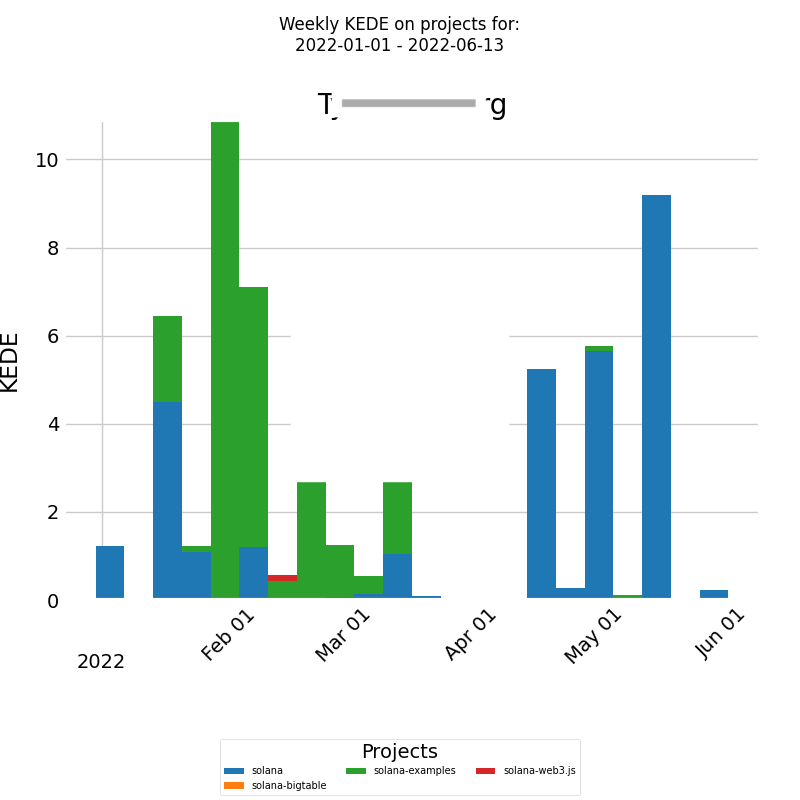
On the x-axis, we have the week dates, and on the y-axis, we have the weekly KEDE values. Each bar represents the capability of the selected developer divided into a number of segments, each corresponding to the fraction of the capability that the developer contributed to a particular project. This allows for a clear visualization of the developer's allocation across different projects.
This visualization is crucial for ensuring that the developer's skills are utilized efficiently without risking burnout. It also assists managers in making informed decisions about project assignments and workload distribution.
The same report can also be run for Daily KEDE, providing a more detailed analysis of the developer's allocation on a daily basis.
Capability Distribution of a Developer Across Projects
Process capability is defined as a statistical measure of the inherent process variability of Knowledge Discovery Efficiency (KEDE), which quantifies the balance between individual capability and work complexity.
In addition to the bar chart that presents the capability of a developer across different projects, it's also essential to analyze the underlying frequency distribution. A histogram provides insights into how frequently each capability value occurs in the selected period.
The diagram below presents a histogram of weekly averaged KEDE values for a selected period, where each project that the developer worked on is presented in a different color.
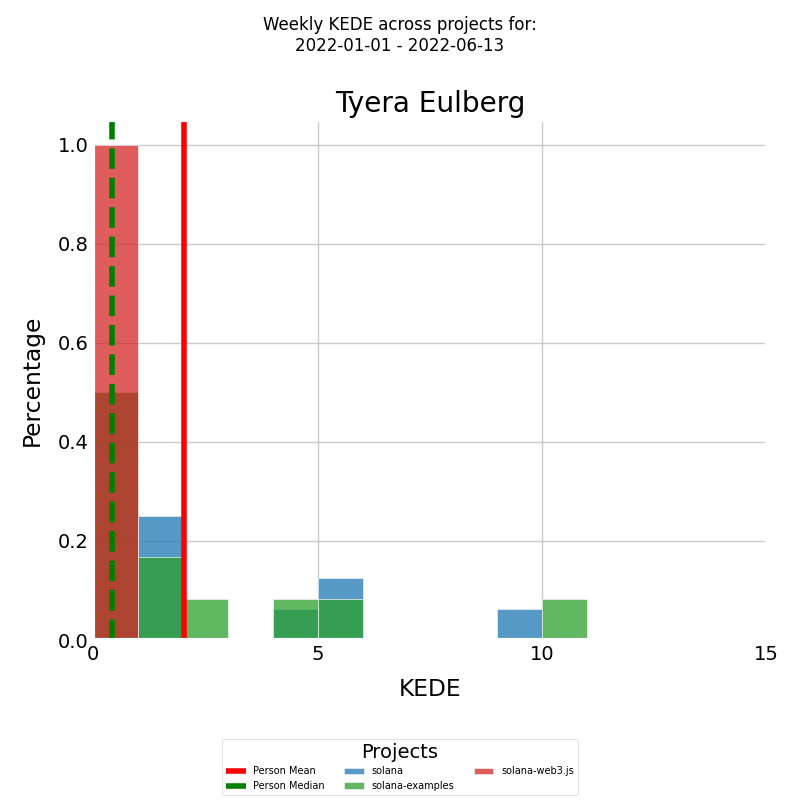
his way, we have several histograms, one for each of the projects the developer contributed to. The red vertical line represents the average weekly capability for the developer, while the green vertical dashed line represents the median weekly capability.
The same analysis can be performed for Daily KEDE values.
Rework by a Developer Across Projects
Along with the capability of a developer, it's important to also analyze the rework they did across different projects. The diagram presents a stacked bar chart that shows how rework for a developer is distributed across different projects.
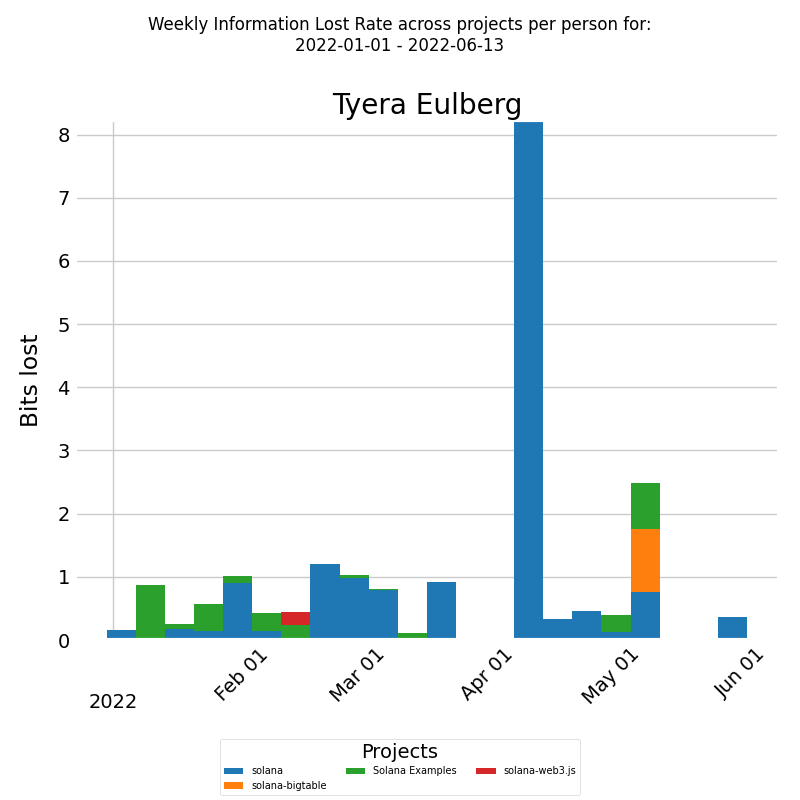
The x-axis shows the week dates and the y-axis shows the information loss rate per week. Lost information represents the knowledge that was initially perceived to be gained but turned out to be incorrect or misleading. Information loss rate is the ratio of lost information to the total perceived missing information. These metrics align with a knowledge-centric standpoint, where the focus is on the efficient use and management of knowledge. Each bar represents the information loss rate per week by the selected developer, which is further divided into boxes. Each box corresponds to the fraction of information loss rate per week by the developer for a particular project. The color of each box represents a different project. This way, we have a clear visualization of how much bits of information the developer replaced for each project during the selected time period.
Developer's Happiness Over Time
Weekly happiness for a developer is a crucial metric that helps organizations ensure that their team remains happy and productive. At KEDEHub, we use a rigorous process to calculate this metric.
Weekly happiness for a developer is calculated as follows:
- First, we identify all developers who have contributed code to any of the company's projects' repositories during the selected time period.
- For each developer, we then aggregate their Weekly KEDE score over all repositories assigned to the projects they worked on. For instance, if a developer contributed to repositories R1 and R2 during a week and their Weekly KEDE for R1 was 2 and for R2 was 3, then their Weekly KEDE score for that project for that week would be 5.
- To calculate the developer's happiness level, we use the Balance(KEDE) formula, which is an credible method for measuring happiness levels.
We follow the same rigorous process to calculate Daily Happiness, which allows for a more detailed analysis of a developer's happiness levels over time.
At KEDEHub, we take pride in our commitment to using reliable and transparent methods to calculate important metrics like Weekly and Daily Happiness. By using these metrics, you can gain valuable insights into your team's well-being and take action to ensure that they remain happy, engaged, and productive.
If you're looking to understand a developer's happiness levels over time, KEDEHub's Weekly Happiness diagrams are the perfect tool for the job. The diagram below presents a time series of a developer's happiness for a selected period across all projects, allowing you to track their happiness levels over time and gain insights into what affects their work experience.
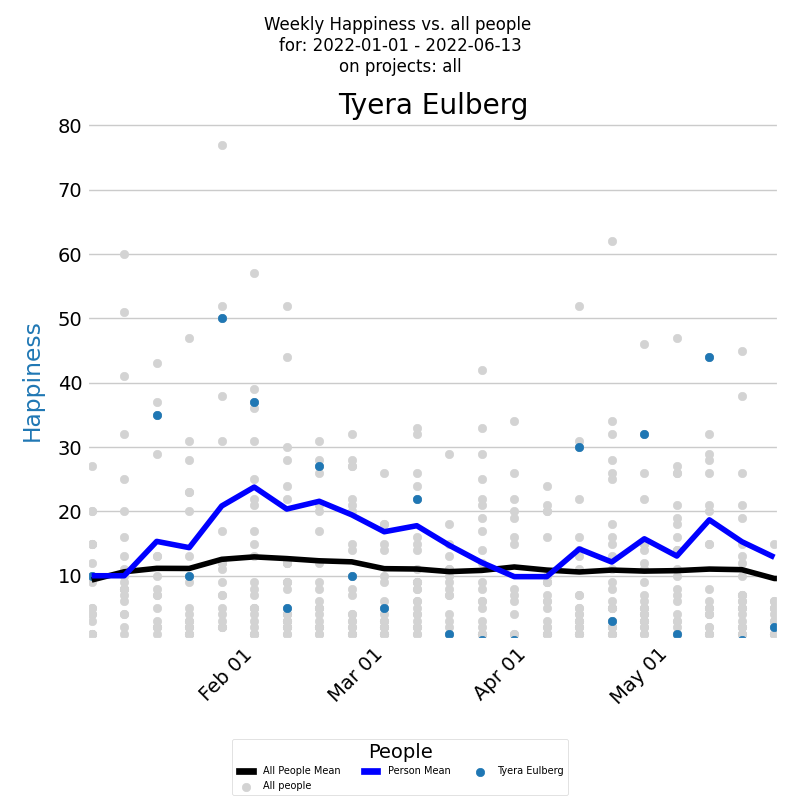
The x-axis of the diagram displays the dates of each week, while the y-axis shows the weekly happiness values. Each week's happiness level is represented by a blue dot on the diagram, giving you a clear visual representation of how the developer's happiness changes over time. Additionally, the dark blue line on the diagram represents the average weekly happiness for the developer, calculated using the Exponentially Weighted Moving Average (EWMA) method. By analyzing this line, you can gain a better understanding of the overall trend of the developer's happiness levels over time.
But to gain a deeper understanding of a developer's happiness levels, it's important to compare them with the company averages. The Weekly Happiness diagram displays the weekly happiness levels of all developers who contributed code to any company project during the selected time period. Each individual developer's weekly happiness is represented by a light gray dot, while the average weekly happiness calculated using EWMA is represented by a black line.
In addition to company-wide averages, it's also useful to track a developer's happiness levels on specific projects. To do this, you can run the same report but only for selected projects. The logic remains the same, with the Weekly Happiness diagram displaying the weekly happiness levels for the selected projects.
Finally, for a more detailed analysis, KEDEHub also provides a Daily Happiness diagram that displays daily happiness levels for individual developers and company-wide averages. With these powerful diagrams, you can easily track and analyze the happiness levels of your developers, identify patterns and trends, and take action to ensure that your team remains happy, engaged, and productive.
With KEDEHub's time series diagrams, you can easily track the historical happiness of your developers and identify patterns and trends that may be affecting their work experience. Armed with this knowledge, you can take steps to ensure that your developers remain happy, engaged, and productive.
Distribution of a Developer's Happiness
Along with the time series of the happiness it's very useful to see a histogram of weekly averaged happiness values, which displays the frequency distribution of happiness values over a selected period.
The histogram below presents the weekly happiness values for a selected period, with the x-axis displaying the Weekly happiness and the y-axis showing the percentage of each particular value.
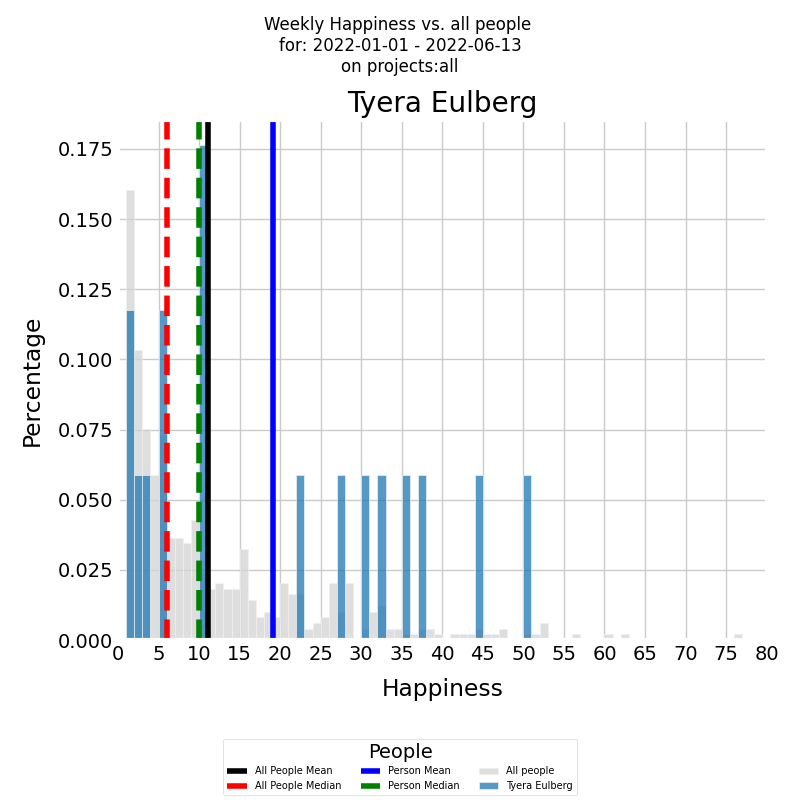
The histogram is presented in color for the developer, with the blue vertical line representing the average weekly happiness level for the selected period and the green vertical dashed line representing the median weekly happiness level.
To gain a deeper understanding of the developer's happiness levels, it's important to compare them with the company averages. The same histogram can be generated for all other developers who contributed to all other company projects during the selected time period, with the histogram presented in gray. The black vertical line represents the average weekly happiness level for all other developers, while the red vertical dashed line represents the median weekly happiness level.
For a more detailed analysis, KEDEHub also provides histograms for Daily Happiness, which allows for a more granular view of a developer's happiness levels over time. Additionally, it's useful to track a developer's happiness levels on specific projects, which can be achieved by selecting Weekly Happiness for the relevant projects.ame, only this time we select Weekly Happiness only for the selected projects.
Distribution of a Developer's Happiness across Projects
Understanding how a developer's happiness is distributed across different projects can provide valuable insights into how their work environment affects their mood. KEDEHub makes it easy to analyze this information using its powerful stacked bar charts.
The diagram below presents a stacked bar chart that allows you to look at numeric values across two categorical variables. The first category is the developer's weekly happiness, and the second category is the projects that the developer worked on during the selected time period. Each bar on the chart represents the weekly happiness of the selected developer, divided into a number of boxes, each one corresponding to the happiness that the developer felt on a particular project.
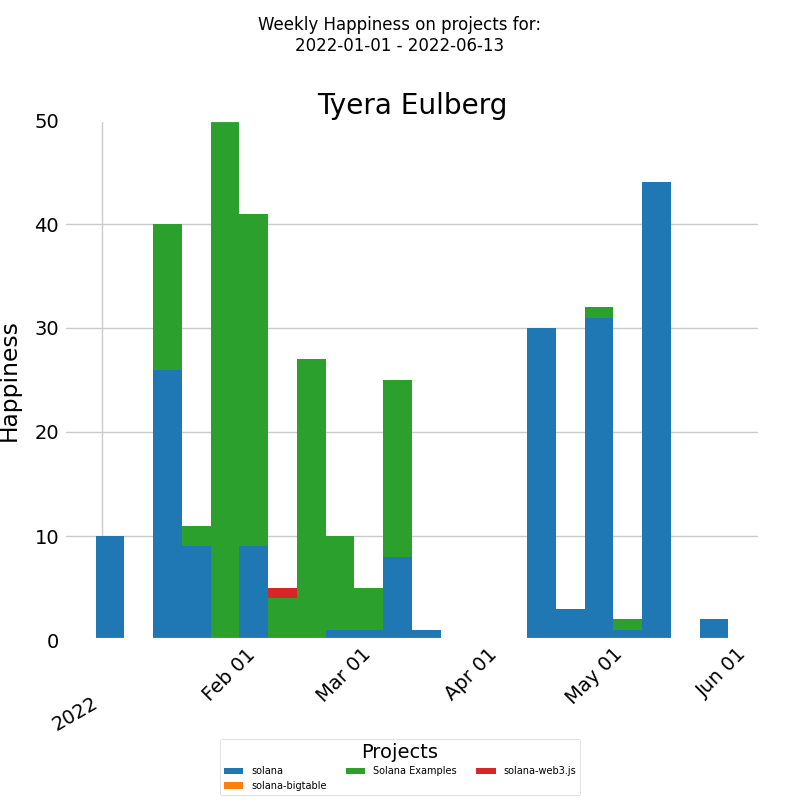
The x-axis of the chart displays the dates of each week, while the y-axis shows the weekly happiness levels. By analyzing the chart, you can gain insights into how a developer's happiness levels vary across different projects and identify any patterns or trends that may be affecting their mood.
In addition to weekly happiness, the same report can be run for daily happiness, allowing for a more detailed analysis of a developer's happiness levels across different projects.
Developer Happiness Distributions Across Projects
Along with the bar chart of the developer's happiness, it's useful to analyze the underlying frequency distribution to identify any patterns or trends.
The histogram below presents a visualization of the weekly averaged happiness values for a selected period, with the x-axis representing the weekly happiness and the y-axis displaying the percentage of each particular value.
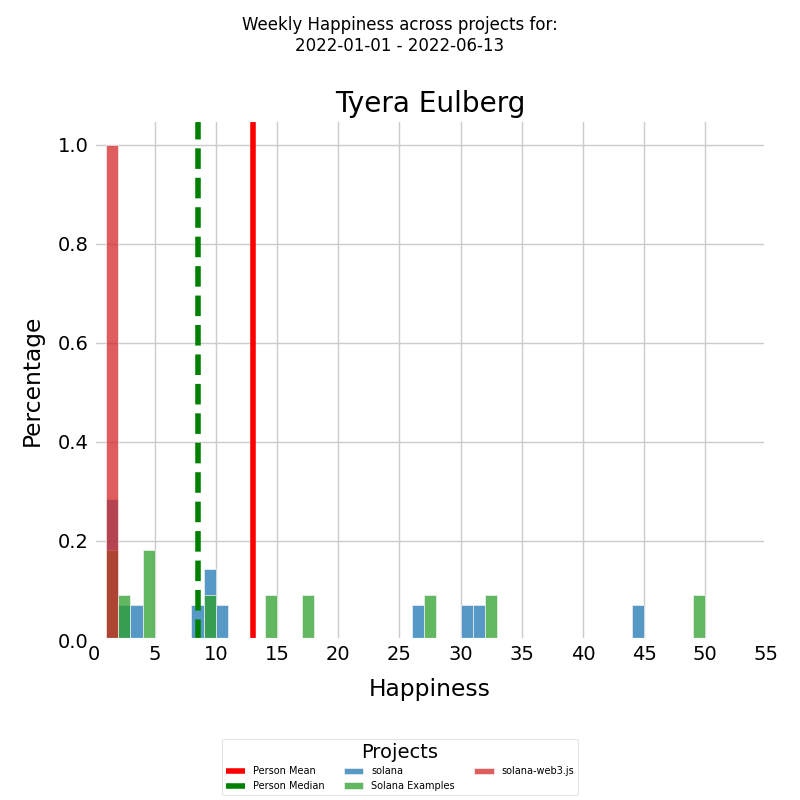
Each project that the developer worked on is represented with a different color, resulting in several histograms, one for each project. The red vertical line represents the average weekly happiness for the developer, while the green vertical dashed line represents the median weekly happiness level.
The same report can be generated for Daily Happiness, which allows for a more detailed analysis of a developer's happiness levels across different projects.
With KEDEHub's powerful histogram tools, organizations can easily analyze how a developer's happiness levels are distributed across different projects, identify any issues, and take steps to ensure that their team remains happy, engaged, and productive.
Developer's Cognitive Load Over Time
Weekly Cognitive load for a developer is a crucial metric that helps organizations ensure that their team remains happy and productive. At KEDEHub, we use a rigorous process to calculate this metric.
Weekly Cognitive load for a developer is calculated as follows:
- First, we identify all developers who have contributed code to any of the company's projects' repositories during the selected time period.
- For each developer, we then aggregate their Weekly KEDE score over all repositories assigned to the projects they worked on. For instance, if a developer contributed to repositories R1 and R2 during a week and their Weekly KEDE for R1 was 2 and for R2 was 3, then their Weekly KEDE score for that project for that week would be 5.
- To calculate the developer's Cognitive load level, we use the KEDE formula, which is an credible method for measuring Cognitive load levels.
We follow the same rigorous process to calculate Daily Cognitive load, which allows for a more detailed analysis of a developer's Cognitive load levels over time.
At KEDEHub, we take pride in our commitment to using reliable and transparent methods to calculate important metrics like Weekly and Daily Cognitive Load. By using these metrics, you can gain valuable insights into your team's well-being and take action to ensure that they remain happy, engaged, and productive.
If you're looking to understand a developer's Cognitive load levels over time, KEDEHub's Weekly Cognitive load diagrams are the perfect tool for the job. The diagram below presents a time series of a developer's Cognitive load for a selected period across all projects, allowing you to track their Cognitive load levels over time and gain insights into what affects their work experience.
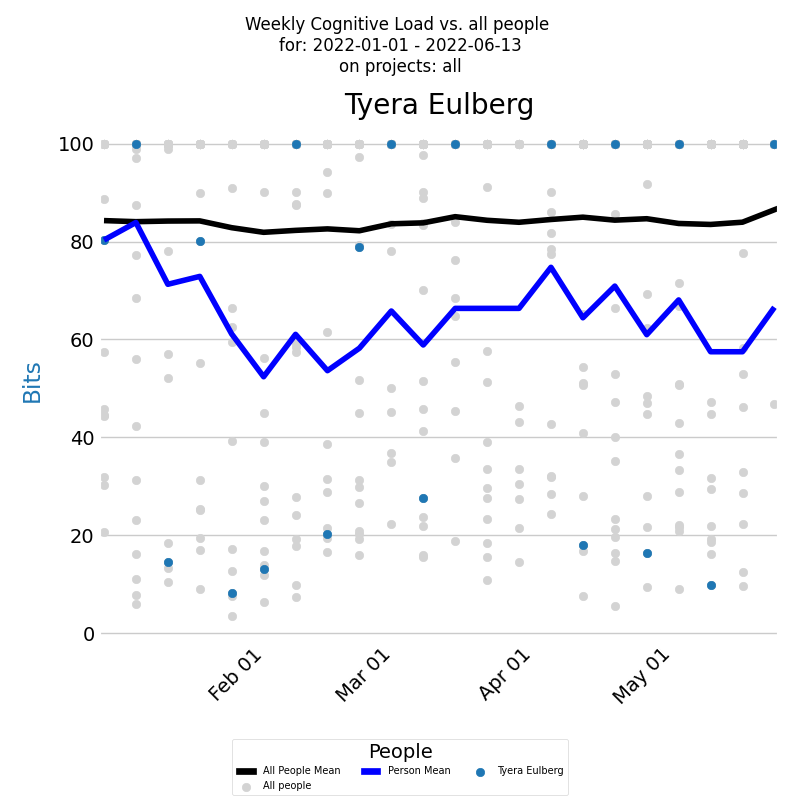
The x-axis of the diagram displays the dates of each week, while the y-axis shows the weekly Cognitive load values. Each week's Cognitive load level is represented by a blue dot on the diagram, giving you a clear visual representation of how the developer's Cognitive load changes over time. Additionally, the dark blue line on the diagram represents the average weekly Cognitive load for the developer, calculated using the Exponentially Weighted Moving Average (EWMA) method. By analyzing this line, you can gain a better understanding of the overall trend of the developer's Cognitive load levels over time.
But to gain a deeper understanding of a developer's Cognitive load levels, it's important to compare them with the company averages. The Weekly Cognitive Load diagram displays the weekly Cognitive load levels of all developers who contributed code to any company project during the selected time period. Each individual developer's weekly Cognitive load is represented by a light gray dot, while the average weekly Cognitive load calculated using EWMA is represented by a black line.
In addition to company-wide averages, it's also useful to track a developer's Cognitive load levels on specific projects. To do this, you can run the same report but only for selected projects. The logic remains the same, with the Weekly Cognitive load diagram displaying the weekly Cognitive load levels for the selected projects.
Finally, for a more detailed analysis, KEDEHub also provides a Daily Cognitive load diagram that displays daily Cognitive load levels for individual developers and company-wide averages. With these powerful diagrams, you can easily track and analyze the Cognitive load levels of your developers, identify patterns and trends, and take action to ensure that your team remains happy, engaged, and productive.
With KEDEHub's time series diagrams, you can easily track the historical Cognitive load of your developers and identify patterns and trends that may be affecting their work experience. Armed with this knowledge, you can take steps to ensure that your developers remain happy, engaged, and productive.
In the time-series visualization, values have been adjusted for clarity:
- Values Above 100: Any data point greater than 100 is displayed at the 100 mark.
- Values Below 1: Data points below 1 are shown at the baseline level of 1.
This method provides a clear representation by emphasizing the main trend of the data over time. However, it's essential for viewers to note that, for visualization purposes, extreme values (below 1 or above 100) are capped at their respective bounds.
Distribution of a Developer's Cognitive Load
Along with the time series of the cognitive load it's very useful to see a histogram of weekly averaged cognitive load values, which displays the frequency distribution of cognitive load values over a selected period.
The histogram below presents the weekly cognitive load values for a selected period, with the x-axis displaying the Weekly cognitive load and the y-axis showing the percentage of each particular value.
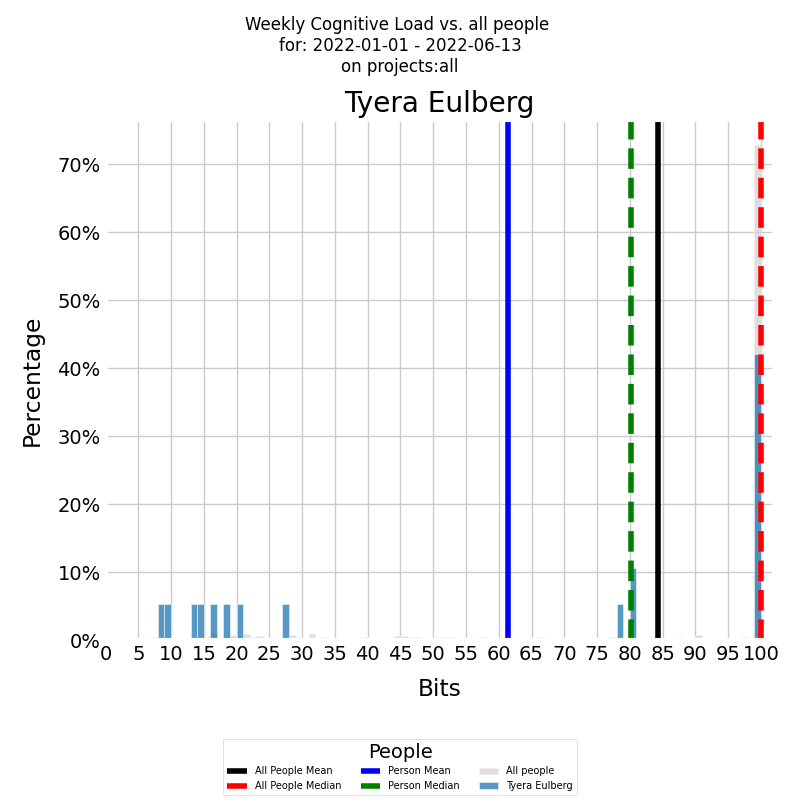
The histogram is presented in color for the developer, with the blue vertical line representing the average weekly cognitive load level for the selected period and the green vertical dashed line representing the median weekly cognitive load level.
To gain a deeper understanding of the developer's cognitive load levels, it's important to compare them with the company averages. The same histogram can be generated for all other developers who contributed to all other company projects during the selected time period, with the histogram presented in gray. The black vertical line represents the average weekly cognitive load level for all other developers, while the red vertical dashed line represents the median weekly cognitive load level.
For a more detailed analysis, KEDEHub also provides histograms for Daily cognitive load, which allows for a more granular view of a developer's cognitive load levels over time. Additionally, it's useful to track a developer's cognitive load levels on specific projects, which can be achieved by selecting Weekly cognitive load for the relevant projects.ame, only this time we select Weekly cognitive load only for the selected projects.
In the histogram visualization, values have been adjusted for clarity:
- Values Above 100: Any data point greater than 100 is grouped into a single bin at the 100 mark.
This method provides a clear representation by highlighting the distribution of the majority of the data. However, it's crucial for viewers to note that for visualization purposes, extreme values (below 1 or above 100) are grouped into their respective edge bins.
Distribution of a Developer's Cognitive Load across Projects
Understanding how a developer's Cognitive load is distributed across different projects can provide valuable insights into how their work environment affects their mood. KEDEHub makes it easy to analyze this information using its powerful stacked bar charts.
The diagram below presents a stacked bar chart that allows you to look at numeric values across two categorical variables. The first category is the developer's weekly Cognitive load, and the second category is the projects that the developer worked on during the selected time period. Each bar on the chart represents the weekly Cognitive load of the selected developer, divided into a number of boxes, each one corresponding to the Cognitive load that the developer felt on a particular project.
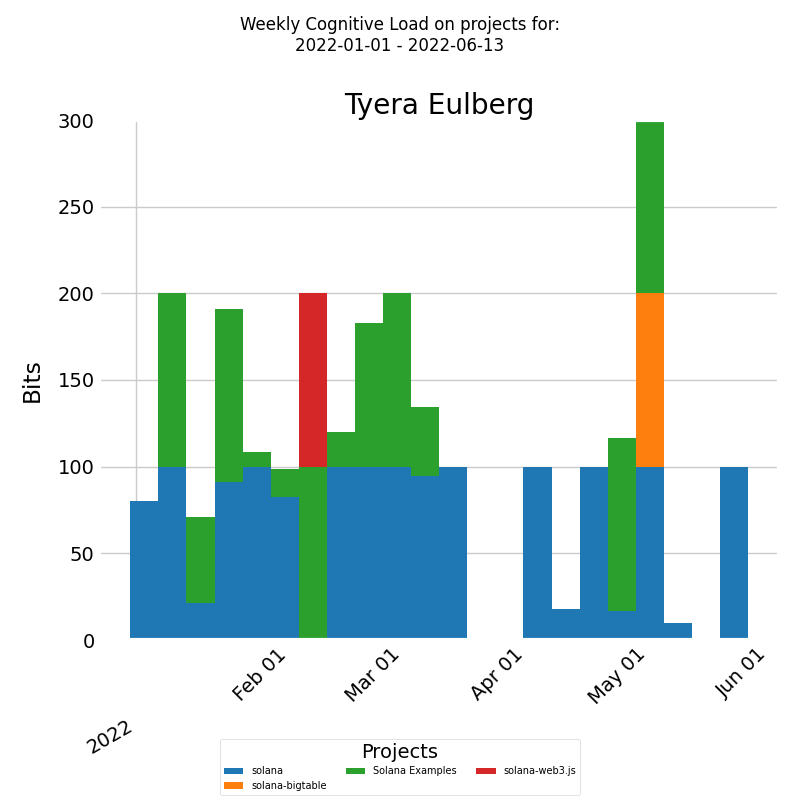
The x-axis of the chart displays the dates of each week, while the y-axis shows the weekly Cognitive load levels. By analyzing the chart, you can gain insights into how a developer's Cognitive load levels vary across different projects and identify any patterns or trends that may be affecting their mood.
In addition to weekly Cognitive load, the same report can be run for daily Cognitive load, allowing for a more detailed analysis of a developer's Cognitive load levels across different projects.
In visualization, values have been adjusted for clarity:
- Values Above 100: Any data point greater than 100 is displayed at the 100 mark.
- Values Below 1: Data points below 1 are shown at the baseline level of 1.
This method provides a clear representation by emphasizing the main trend of the data over time. However, it's essential for viewers to note that, for visualization purposes, extreme values (below 1 or above 100) are capped at their respective bounds.
Developer Cognitive Load Distributions Across Projects
Along with the bar chart of the developer's Cognitive load, it's useful to analyze the underlying frequency distribution to identify any patterns or trends.
The histogram below presents a visualization of the weekly averaged Cognitive load values for a selected period, with the x-axis representing the weekly Cognitive load and the y-axis displaying the percentage of each particular value.
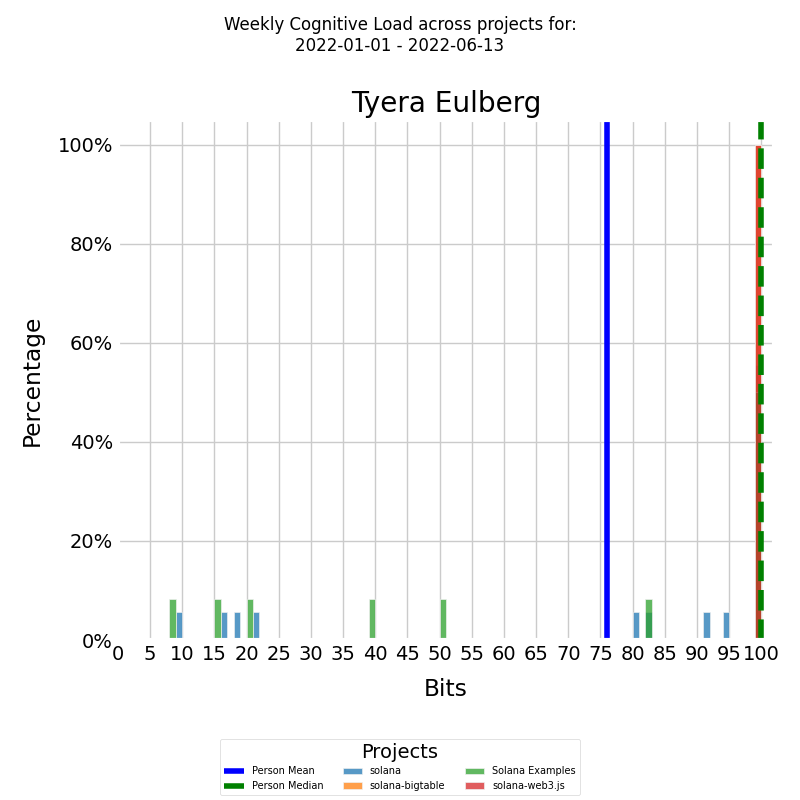
Each project that the developer worked on is represented with a different color, resulting in several histograms, one for each project. The red vertical line represents the average weekly Cognitive load for the developer, while the green vertical dashed line represents the median weekly Cognitive load level.
The same report can be generated for Daily Cognitive load, which allows for a more detailed analysis of a developer's Cognitive load levels across different projects.
With KEDEHub's powerful histogram tools, organizations can easily analyze how a developer's Cognitive load levels are distributed across different projects, identify any issues, and take steps to ensure that their team remains happy, engaged, and productive.
In the histogram visualization, values have been adjusted for clarity:
- Values Above 100: Any data point greater than 100 is grouped into a single bin at the 100 mark.
This method provides a clear representation by highlighting the distribution of the majority of the data. However, it's crucial for viewers to note that for visualization purposes, extreme values (below 1 or above 100) are grouped into their respective edge bins.
Getting started


