Measuring ROI of GenAI
A Knowledge-centric approach
Related Articles
Abstract
Generative AI (GenAI) code generation tools are revolutionizing the way developers work by providing intelligent suggestions for code and functions within various programming environments. These tools promise unprecedented efficiency, enhanced developer experience, and a significant competitive edge.
Despite these promising results, doubts linger: do GenAI investments really pay off?
This question often highlights a conflict between the global business ROI and the local efficiency of developers. Consider a scenario where a GenAI code generation tool has been implemented by your software engineering team. The tool significantly enhances individual productivity and reduces cognitive load, leading to a marked improvement in job satisfaction and efficiency. However, due to organizational challenges such as excessive multitasking, there is no noticeable increase in the overall number of features delivered. From a business perspective, this might suggest a lack of ROI. Yet, from the viewpoint of individual contributors, the benefits and return on investment are substantial.
Understanding this dichotomy is essential as we delve deeper into the real value of GenAI tools, examining not just the broad fiscal metrics but also the nuanced impacts on developer well-being and efficiency.
To address this challenge, we suggest adopting a Knowledge-centric Perspective on software development. This means seeing knowledge as the fuel that drives the software development engine. Central to this perspective is the concept of the 'knowledge gap' - the difference between what a developer knows and what they need to know to effectively complete tasks. This gap directly influences developers' work experience, talent utilization and productivity.
What GenAI fundamentally does is aid developers in efficiently bridging the knowledge gaps they face.
ROI is defined as the Net Return divided by the Cost of Investment. Here, the 'Cost of Investment' involves not only financial expenditures but also the time and effort spent in acquiring and applying necessary knowledge. The 'Net Return' is the tangible and intangible value that these knowledge-driven activities deliver.
High ROI is achieved when less knowledge needs to be discovered for the value to be delivered.
Projects with lower knowledge discovered may often yield a higher ROI than higher-cost projects due to increased efficiency and reduced risk of cost overruns. Bigger projects typically have higher variability and longer feedback cycles, which can diminish ROI.
Introduction
GenAI is designed to assist developers by providing suggestions for code and functions within various programming environments. GenAI uses a neural code synthesis approach to code completion to generate suggestions by using a language model to predict what the user might type next (the completion) from the context of what they are working on at the moment (the prompt)2]. It's a leap forward in terms of intelligent coding assistance, offering more than just auto-completion; it's about understanding and generating contextually relevant code.
Studies show that using code completion suggestions helps developers complete code blocks faster and reduces the time spent searching for less-common syntax. According to a McKinsey & Company study, software engineering teams trained to use GenAI tools not only reduced the time needed to generate and refactor code but also reported improved work experiences, including increased happiness, flow, and fulfillment[1].
Despite these promising features, the actual effectiveness of GenAI in enhancing developer productivity remains a topic of much debate and speculation. There's a gap between the perceived potential of such tools and their real-world impact. Quantifying this impact is crucial for several reasons:
- For developers, it's important to understand how such tools can help them realize their full potential and enjoy their work.
- For organizations, it's important to have empirical data to justify the integration of GenAI into their workflows. Without concrete evidence, it's challenging to gauge whether the tool is a worthy investment.
- For researchers, insights gained from such an analysis can inform the development of future AI-based tools, ensuring they are more aligned with the needs of developers and organizations.
Defining ROI for GenAI
Return on Investment (ROI) is a financial ratio of the gain or loss generated by an investment relative to its cost. The higher the ratio, the greater the benefit.
For GenAI, ROI encompasses both tangible and intangible benefits, often categorized as "hard" and "soft" returns.
Hard Returns
Hard returns are quantifiable and directly linked to business profitability. These include metrics like increased revenue, reduced costs, time savings, and risk mitigation. Unlike traditional investments, GenAI may not yield immediate financial returns, but the long-term benefits can be substantial.
Soft Returns
Soft returns are indirect contributors to business value and growth. These include improved collaboration, increased productivity, reduced waste, decreased cognitive load, and fostering an environment where developers can achieve the psychological state of flow. Over time, these benefits contribute to long-term business success, enhancing employee retention, customer satisfaction, innovation, and customer lifetime value.
Challenges in Measuring the ROI of GenAI
Traditional metrics in technology development often focus on outputs and lagging indicators like the number of commits, story points, bugs, feature velocity, throughput, and lead times. These metrics can make measuring the ROI of GenAI challenging, especially for soft returns.
GenAI primarily impacts the quality of the process, improving predictability, efficiency, rework, developer happiness, and cognitive load. Creativity and human-relevant impacts are driven by individual effort, local context, and autonomy, which are difficult to quantify with top-down metrics frameworks.
Organizations often rely on surveys to measure effectiveness, asking questions like, "Did you get value from the tool?" While these surveys gauge satisfaction, they lack the depth to pinpoint the program's achievements or shortcomings and how it performed against overarching goals.
To accurately measure the ROI of GenAI, we need an approach that connects changes at the individual and team levels with overall business financial performance.
This involves looking beyond traditional output-based metrics and survey-based methods, focusing on a more comprehensive, input-based approach that emphasizes the quality of the process.
By evaluating both hard and soft returns, businesses can gain a clearer picture of the true value of their GenAI investments. This holistic view will help determine whether the frenzy around GenAI is justified and if these tools are truly delivering on their promises.
Moving Towards a Knowledge-Based Approach
In software development, rethinking productivity is crucial for improving ROI. A memorable anecdote from "The Mythical Man-Month" illustrates this perfectly: a general walks into a room filled with software developers and sees them engaged in discussion, not typing away. The general asks why everybody is talking and nobody is working. It's a common misconception that productivity in software development is solely measured by how furiously one can type. In reality, the essence of a developer's job extends far beyond the keyboard. It involves a significant amount of knowledge work: brainstorming, strategizing, researching, and yes – thinking!
To account for the knowledge work in software development, we suggest adopting a Knowledge-centric Perspective on software development. This means seeing knowledge as the fuel that drives the software development engine. Central to this perspective is the concept of the 'knowledge gap' - the difference between what a developer knows and what they need to know to effectively complete tasks. Bridging this gap involves discovering and applying new knowledge. Efficient knowledge discovery is critical for unlocking the full potential of both individuals and teams, which naturally leads to high productivity. Furthermore, this efficiency in knowledge acquisition and application enhances the developer work experience and overall well-being
The Knowledge-centric perspective is a systems perspective, because it takes into account all of the behaviors of a system as a whole in the context of its ecosystem in which it operates. Viewed from the Knowledge-centric perspective, GenAI is a source of knowledge. It competes with prior knowledge, StackOverflow, ChatGPT, Google Search, books, and advice from colleagues.
Unique to GenAI is the interactive and context aware manner it helps developers bridge the knowledge gaps. GenAI's real-time suggestions, based on the current coding context, provide a more seamless and integrated experience compared to searching for answers on StackOverflow or Google. This can lead to a more fluid development process, with less interruption to the developer's workflow. GenAI's understanding of the developer's current project and codebase allows it to offer more relevant suggestions than generic search tools or even other AI-based tools that might not have the same level of integration with the development environment. In this way, GenAI might contribute to a flatter learning curve for developers by exposing them to best practices and new coding patterns in their work context, as opposed to the more passive learning that might occur when consulting documentation or forums.
Quantified productivity represents the efficiency in achieving desired outcomes - it's about maximizing output while minimizing input. But what constitutes real output in software development? It isn't just about the number of lines of code or features delivered, but the value it brings - be it business gains, customer satisfaction, or technical innovation.
Traditional inputs like time and capital are essential, but they miss a critical aspect unique to software development - the acquisition and application of knowledge. Here, knowledge is king. Adopting a Knowledge-centric perspective, we define these terms as follows:
- Output is the value delivered. It can be measured as money, business gains, customer satisfaction, technical innovation etc.
- Input is the knowledge developers needed to discover to deliver that value. Knowledge discovered is measured in bits of information.

High productivity is achieved when less knowledge needs to be discovered for the outcome to be produced.
Prior knowledge is the easiest and the fastest to discover - it is in the head, one just applies it. In other words, when prior knowledge is applied then there is the most efficient knowledge discovery. Conversely, when a lot of knowledge is missing then the knowledge discovery is less efficient. The more prior knowledge was applied i.e. the less knowledge was missing for achieving the desired outcome the more efficient the software development process is.
Software developers discover knowledge by asking questions. The average number of “Yes/No” questions we need to ask in order to gain the knowledge needed is called “Missing information”. “Missing information” is defined by the Information Theory introduced by Claude Shannon[4]. A Knowledge Discovery Process consists of asking questions in order to acquire the missing information about "what" tangible output to produce and how to produce it.
Hence we can change our productivity formula to be:

If the outcome we search for is a gold coin hidden in one of 8 equally sized boxes we need to ask a minimum of 3 questions on average. If the outcome we search for is $100 billion hidden in one of 8 equally sized boxes we also need to ask a minimum of 3 questions on average. That means the same number of questions could bring different outcomes. That's why we analyze not the outcome but how efficiently the outcome was produced.
Fortunately, there is a way to measure the knowledge discovered (missing information) in software development. KEDEHub allows you to measure the knowledge discovered using the scientifically backed and patented metric - Knowledge Discovery Efficiency (KEDE).
Now we can rewrite the productivity formula for software developers to have KEDE in the denominator.

For example, if we have an outcome of $100,000 and KEDE of 2, then productivity will be $2048 per bit of information.
On another hand, if we have the same outcome of $100,000, but this time KEDE is 20, then productivity will be $25,000 per bit of information.

This approach not only enhances our understanding of productivity but also provides a more nuanced view of ROI in software development, emphasizing the critical role of knowledge work in achieving superior returns on investment.
ROI is defined as the Net Return divided by the Cost of Investment. Here, the 'Cost of Investment' involves not only financial expenditures but also the time and effort spent in acquiring and applying necessary knowledge. The 'Net Return' is the tangible and intangible value that these knowledge-driven activities deliver.
Projects with lower knowledge discovered may often yield a higher ROI than higher-cost projects due to increased efficiency and reduced risk of cost overruns. Bigger projects typically have higher variability and longer feedback cycles, which can diminish ROI.
Measuring how efficiently developers discover missing knowledge involves using a tool like KEDEHub. It analyzes source code to measure the knowledge gaps that developers bridge when completing tasks in terms of bits of information.
Conclusion
In this paper, we adopt a Knowledge-centric approach to evaluate the impact of GenAI on aspects of software development such as developer productivity, work experience, and talent utilization. This analysis aims to provide a nuanced understanding of how such AI-powered tools influence the software development process, offering insights that are valuable for further research. Additionally, our findings aim to contribute to a broader discourse on the practical value and effectiveness of AI tools like GenAI, not only in enhancing productivity but also in enriching the overall software development experience
As we've explored throughout this article, the ROI of Generative AI tools in software development is not solely quantifiable through traditional financial metrics. While the allure of GenAI is strong, driven by its promise to enhance efficiency and competitive advantage, its true value may lie deeper than the surface-level numbers reveal.
To fully appreciate the ROI of GenAI, stakeholders must adopt a holistic view that encompasses both tangible and intangible returns. Financial metrics remain crucial, but they should be balanced with measures of team satisfaction, creativity, and the overall health of the development environment. This dual perspective will not only provide a more comprehensive understanding of GenAI's impact but also guide future investments in technology that support both business objectives and human factors.
Ultimately, the successful integration of GenAI tools into software development hinges on recognizing and nurturing these dual benefits. By addressing both the high-level business ROI and the nuanced, human side of software development, organizations can foster an environment where technology serves as a true ally to both the company's bottom line and its people's well-being.
We suggest that GenAI has the capability to significantly improve individual and team performance, enhance developers' happiness, reduce cognitive load, reduce delivery times, foster collaboration, and boost productivity by streamlining the process of knowledge discovery. These benefits collectively suggest that GenAI is much more than a time-saving tool; it is a catalyst for creating a more collaborative, efficient, and satisfying development environment.
Future research should focus on applying these Knowledge-Centric metrics in real-world settings to validate our hypotheses further. This empirical approach, coupled with qualitative feedback from developers, will provide a comprehensive understanding of GenAI's role in modern software development. As organizations strive to maximize their technological investments, this article underscores the importance of adopting advanced, data-driven evaluation methods to truly gauge the impact of AI tools like GenAI on the software development lifecycle.
By bridging the knowledge gap with efficiency and precision, GenAI not only augments the developers' toolkit but also redefines the boundaries of what is possible in software development. As we continue to navigate the evolving landscape of AI in technology, GenAI tools like GenAI will undoubtedly play a crucial role in shaping the future of coding, making it an exciting time for developers and organizations alike.
Appendix
Practical examples of measuring happiness
Consider the time-series diagram below, which illustrates developer's happiness for a selected period across all projects.
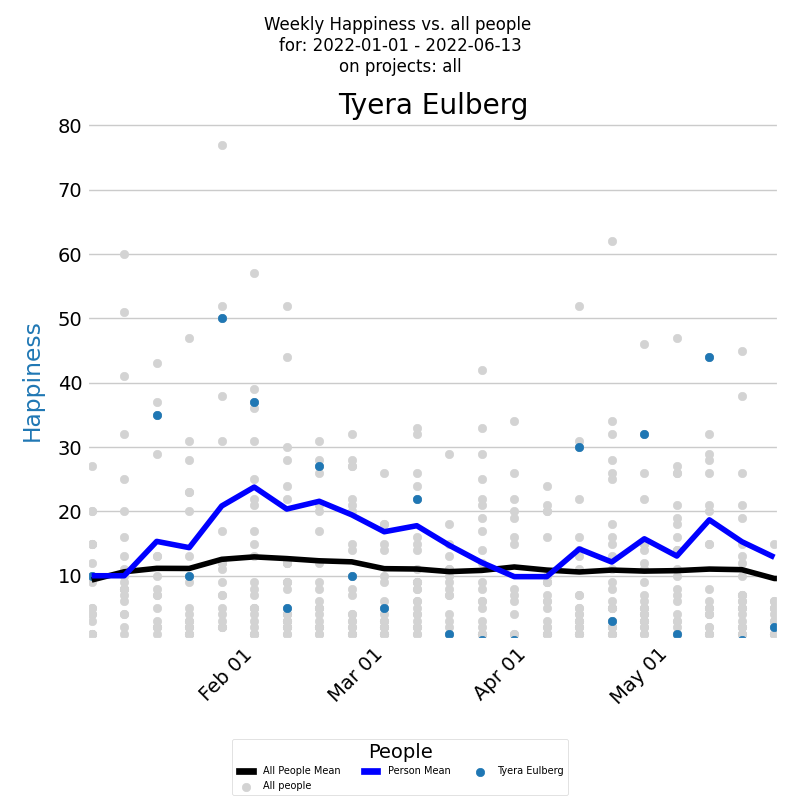
The x-axis of the diagram displays the dates of each week, while the y-axis shows the weekly happiness values. Each week's happiness level is represented by a blue dot on the diagram, giving you a clear visual representation of how the developer's happiness changes over time. Additionally, the dark blue line on the diagram represents the average weekly happiness for the developer, calculated using the Exponentially Weighted Moving Average (EWMA) method. By analyzing this line, you can gain a better understanding of the overall trend of the developer's happiness levels over time. But to gain a deeper understanding of a developer's happiness levels, it's important to compare them with the company averages. Each individual developer's weekly happiness is represented by a light gray dot, while the average weekly happiness calculated using EWMA is represented by a black line.
The time-series diagram reveals that the selected developer's average happiness levels consistently outpace the company's average, Interestingly, their happiness peaks at specific moments, ike a roller-coaster over time. Contrastingly, the company-wide data exposes a concerning pattern: a majority of developers experience their work in a state of anxiety, rather than happiness.
Along with the time series of the happiness it's very useful to see a histogram of weekly averaged happiness values, which displays the frequency distribution of happiness values over a selected period. The histogram below presents the weekly happiness values for a selected period, with the x-axis displaying the Weekly happiness and the y-axis showing the percentage of each particular value.
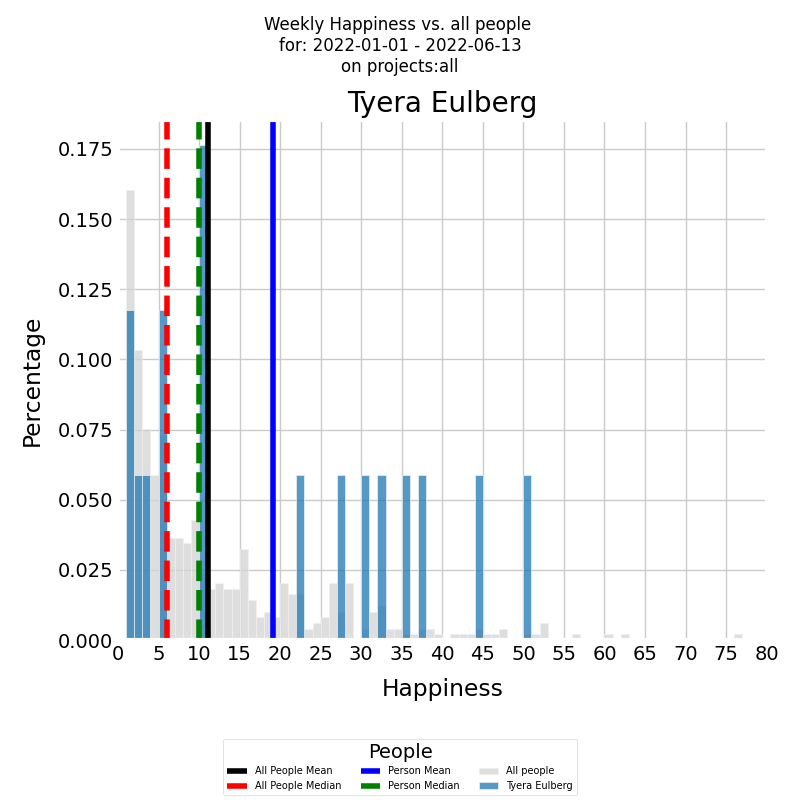
The histogram is presented in color for the developer, with the blue vertical line representing the average weekly happiness level for the selected period and the green vertical dashed line representing the median weekly happiness level. To gain a deeper understanding of the developer's happiness levels, it's important to compare them with the company averages. The same histogram can be generated for all other developers who contributed to all other company projects during the selected time period, with the histogram presented in gray. The black vertical line represents the average weekly happiness level for all other developers, while the red vertical dashed line represents the median weekly happiness level.
The diagram illustrates that the selected developer's average happiness levels are double the company's average. Interestingly, their happiness isn't concentrated at a single point but rather distributed uniformly across the spectrum. The company histogram, on the other hand, reveals a concerning pattern: most developers experience their work in a state of anxiety.
To gain insights into how a developer's mood is influenced by their work environment, we can examine the distribution of their happiness across different projects. The diagram below presents a stacked bar chart that allows you to look at numeric values across two categorical variables. The first category is the developer's weekly happiness, and the second category is the projects that the developer worked on during the selected time period. Each bar on the chart represents the weekly happiness of the selected developer, divided into a number of boxes, each one corresponding to the happiness that the developer felt on a particular project.
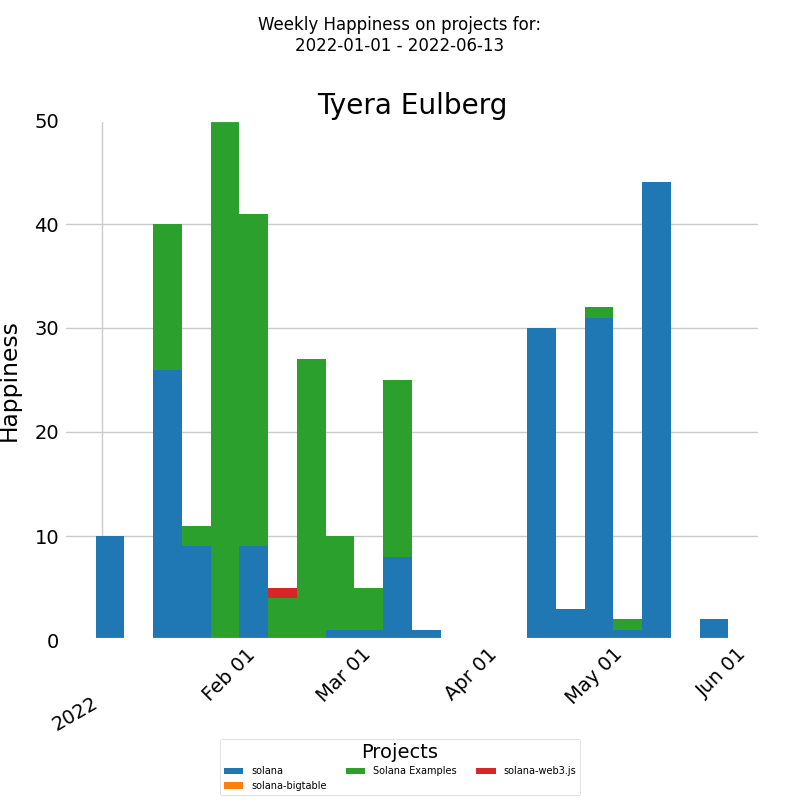
The x-axis of the chart displays the dates of each week, while the y-axis shows the weekly happiness levels. For this particular developer, their mood seems unaffected by the nature of the project, be it represented in green or blue. Thus, a holistic review of the entire company as a system may be necessary to identify patterns or trends impacting their happiness.
To address this, we suggest a two-pronged approach: First, investigate what factors contribute to the higher happiness levels of the selected developer and aim to replicate those conditions for the rest of the team to alleviate their anxiety. Secondly, identify periods when even the usually happy developer experienced anxiety, and work towards creating a more consistent and positive working environment. It's possible that addressing a single issue could alleviate both undesirable effects.
Practical examples of measuring cognitive load
Assessing a developer's cognitive load involves examining their it over time. The following diagram depicts a developer's weekly cognitive Load over a selected period across all projects.
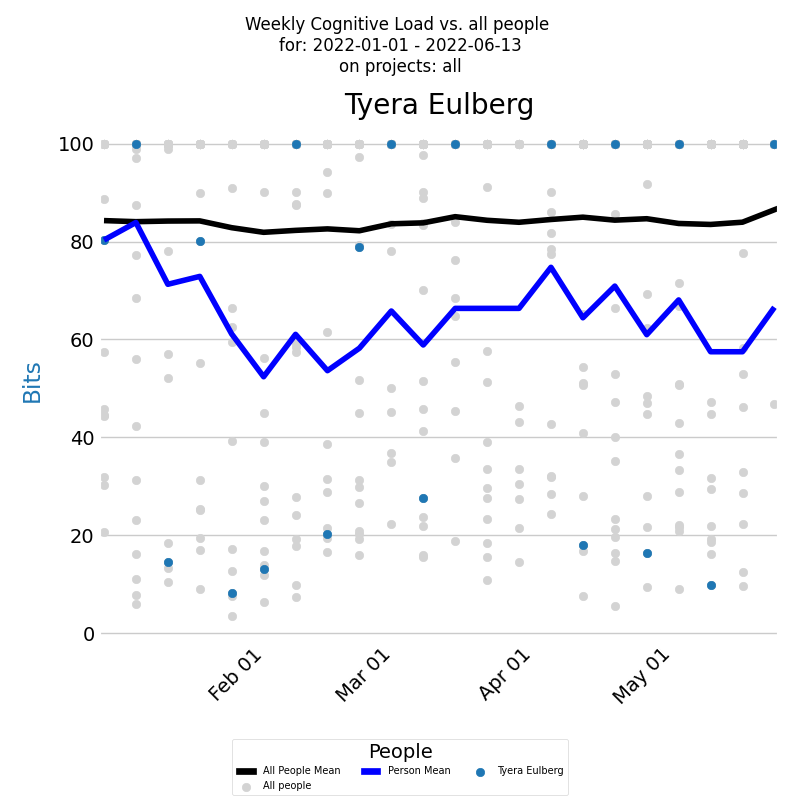
The x-axis shows the week weeks, and the y-axis denotes weekly cognitive Load values. The blue dot for each week represents a developer's cognitive Load. The dark blue line signifies a developer's average weekly cognitive Load. Comparisons with the company average can be made by examining cognitive Load for all contributing developers during this period, depicted by light gray dots. The black line signifies these developers' average weekly cognitive Load.
Examining the frequency distribution of a developer's averaged cognitive Load over time can be informative. A histogram, as shown below, can illustrate this distribution.
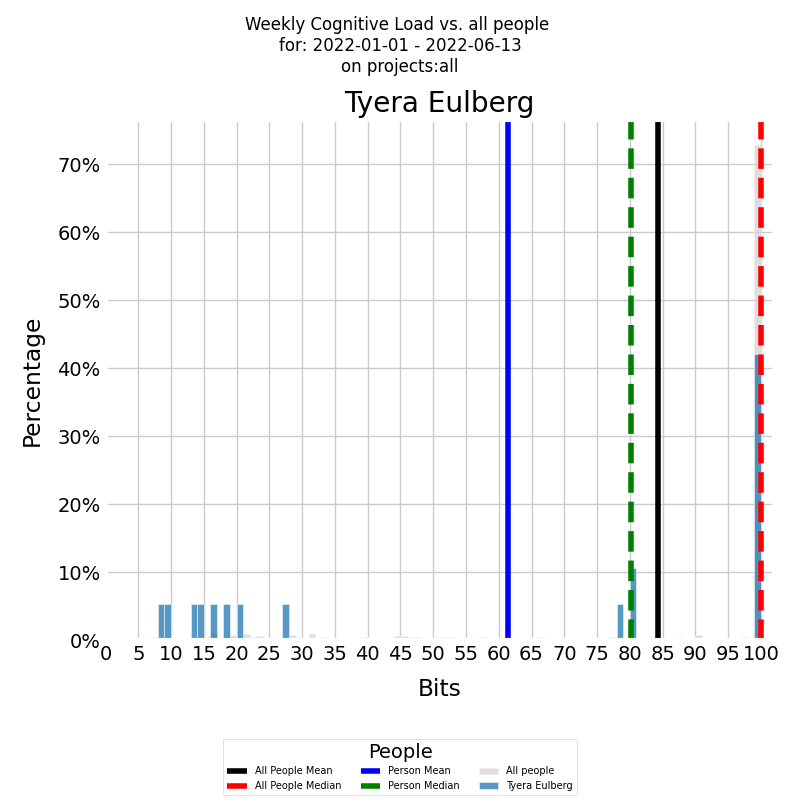
The x-axis displays the weekly KEDE, while the y-axis shows the frequency of each specific value. The colored histogram represents the developer's cumulative cognitive Load. The blue vertical line denotes the developer's average weekly cognitive Load for the selected period, while the green dashed line indicates the median weekly cognitive Load.
Both diagrams show that there were weeks, with a KEDE=10, when the selected developer experienced a cognitive load equivalent to searching in just 512 boxes. However, the developer's capability typically ranged between 2 and 4. This suggests that their cognitive load was akin to searching through approximately 16,777,216 boxes. Even though this cognitive load is considerable, it's still much lower compared to the average load within the company, where KEDE=1 corresponds to a number of boxes that exceeds the total number of stars in the Universe! Furthermore, the company's median cognitive Load is less than 0.5, indicating that half of the time, the cognitive load was intolerable!
As an initial measure, it would be beneficial to examine why the selected developer has a significantly better work experience than the rest of the company. Directly asking the developer could be a good approach, but for a deeper understanding of a developer's knowledge discovery efficiency, one should analyze its distribution across various projects. The diagram below shows a stacked bar chart of the developer's weekly efficiency divided by projects during a selected period.
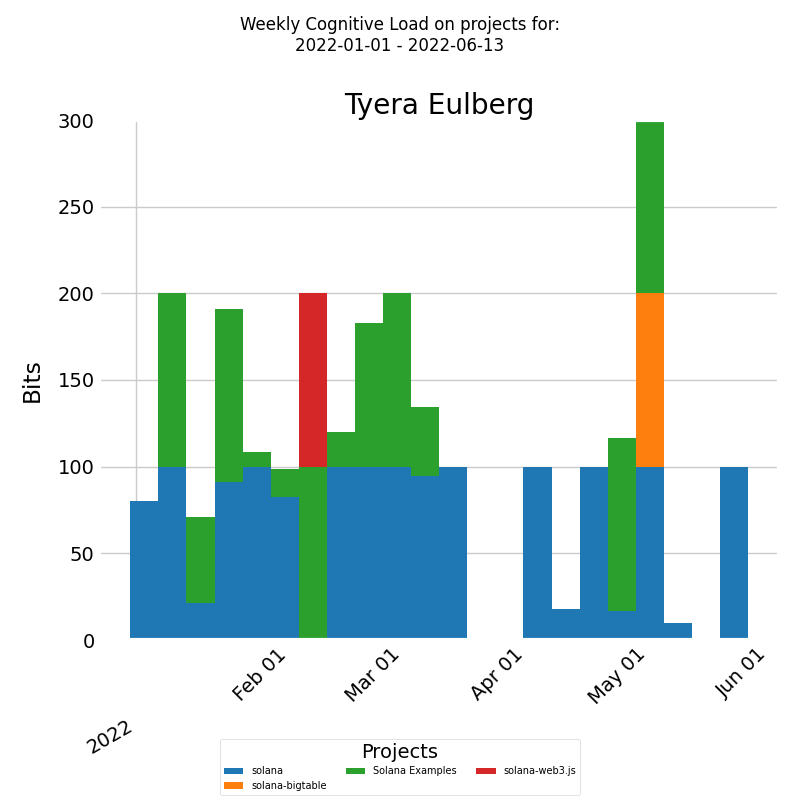
The x-axis denotes week dates and the y-axis indicates weekly cognitive Load. Each bar represents a week's cognitive Load for the developer, divided into segments according to the proportion of weekly cognitive Load for each project.
For this specific developer, their cognitive load appears to remain constant, regardless of the project. As a result, it may be necessary to conduct a comprehensive examination of the company as a whole to pinpoint patterns or trends affecting their job satisfaction.
In response, we recommend that the company's leadership investigate the factors contributing to such extreme cognitive loads for the average developer. Based on my experience as an engineering manager, these factors could include insufficient training, prolonged feedback loops, unclear requirements, etc.
Practical examples of measuring capability
In order to assess the capability of a developer, it's important to examine their KEDE over time. The diagram below provides a time series of KEDE of a developer for a selected period across all projects.
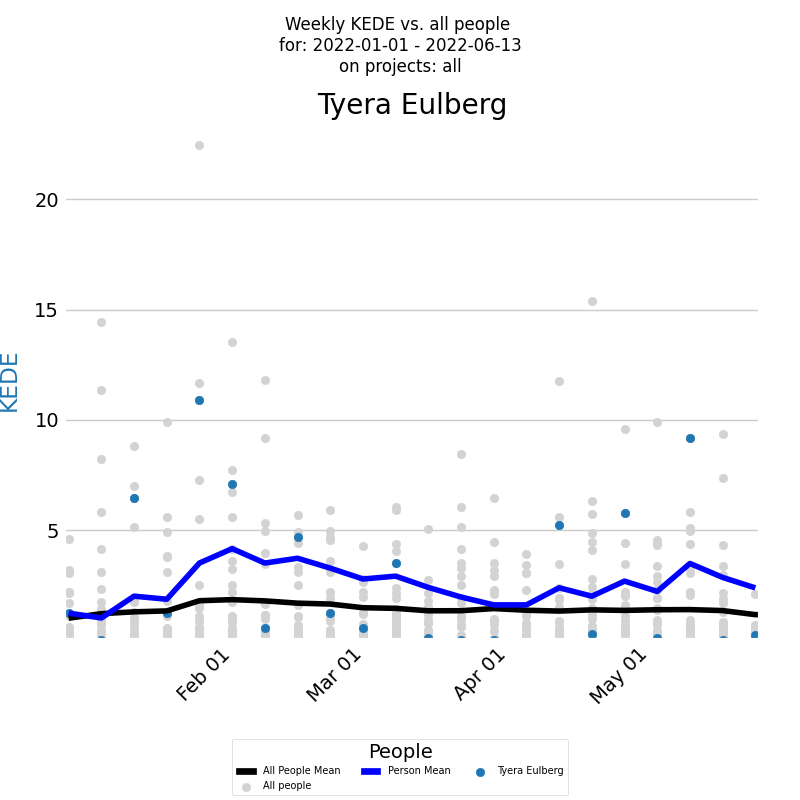
The x-axis displays the week dates, while the y-axis represents weekly KEDE values. The blue dot on the diagram for each week represents the developer's KEDE. The dark blue line on the diagram represents the average weekly KEDE for the developer, calculated using EWMA. To compare the developer's KEDE with the average of the company, you can view the Weekly KEDE for all developers who contributed code to any of the company projects during the selected time period. Each individual developer's weekly KEDE is presented as a light gray dot, and the black line represents the average weekly KEDE for those developers, calculated using EWMA.
When inspecting a developer's KEDE over time, it's also useful to see the underlying frequency distribution of their averaged values. A histogram can show how often each different value occurs. The diagram below presents such a histogram for a selected period.
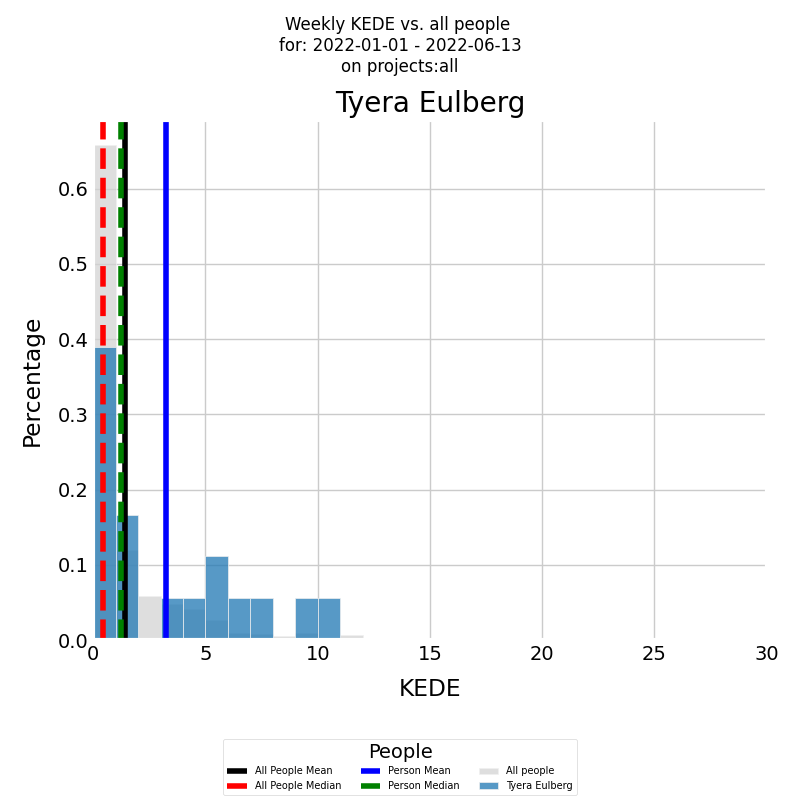
On the x-axis, you have the Weekly KEDE, and on the y-axis, you have the percentage of each particular value. First, the developer's summarized KEDE is presented by the histogram in color of the Weekly KEDE frequency for the selected period. The blue vertical line is the average weekly KEDE for the developer for the selected period, calculated by arithmetic mean. The median weekly KEDE for the developer for the selected period is presented by the green vertical dashed line.
Both diagrams clearly show that there were weeks, with a KEDE=10, when the selected developer experienced a cognitive load equivalent to searching in just 512 boxes. However, the developer's capability, as measured by KEDE, typically ranged between 2 and 4. This suggests that their cognitive load was akin to searching through approximately 16,777,216 boxes. Even though this cognitive load is considerable, it's still much lower compared to the average load within the company, where KEDE=1 corresponds to a number of boxes that exceeds the total number of stars in the Universe! Furthermore, the company's median KEDE is less than 0.5, indicating that half of the time, the cognitive load was intolerable!
As an initial measure, it would be beneficial to examine why the selected developer has a significantly better work experience than the rest of the company. Directly asking the developer could be a good approach, but for a deeper understanding of a developer's KEDE, one should analyze its distribution across various projects. The diagram below presents a stacked bar chart that allows for a detailed analysis of numeric values across two categorical variables. In this case, the first category is the developer's weekly KEDE, and the second category is the projects the developer worked on during the selected time period.
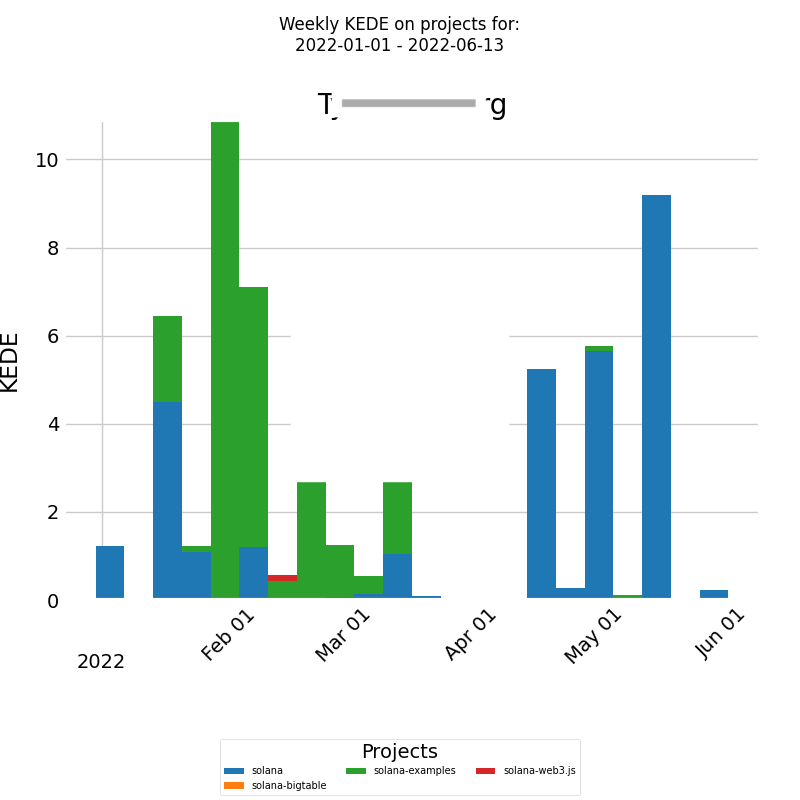
On the x-axis, we have the week dates, and on the y-axis, we have the weekly KEDE. Each bar represents the weekly KEDE of the selected developer divided into a number of boxes, each corresponding to the fraction of the weekly KEDE that the developer contributed to a particular project. For this specific developer, their cognitive load appears to remain constant, regardless of whether the project is denoted in green or blue. As a result, it may be necessary to conduct a comprehensive examination of the company as a whole to pinpoint patterns or trends affecting their job satisfaction.
In response, we recommend that the company's leadership investigate the factors contributing to such extreme cognitive loads for the average developer. Based on my experience as an engineering manager, these factors could include insufficient training, prolonged feedback loops, unclear requirements, etc.
Practical examples of measuring collaboration
Consider the time-series diagram below, which illustrates the interplay between an organization's size and its capability over time.
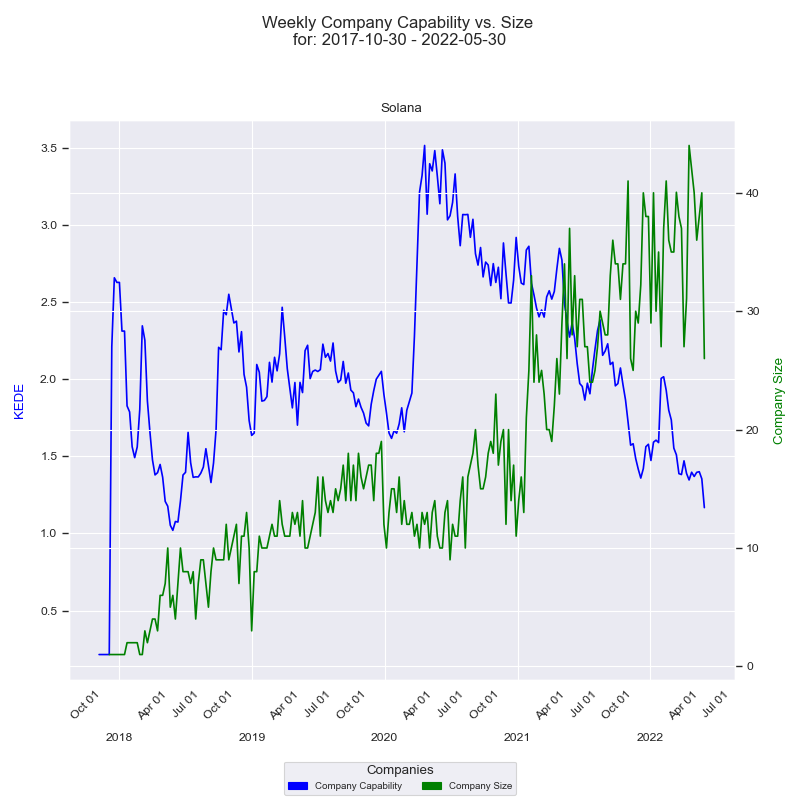
The x-axis represents the quarters, while the y-axis on the left displays the 'capability' in terms of Weekly KEDE values. The dark blue line in the diagram represents the average Weekly KEDE for all developers who contributed to the company's projects in a given week, calculated using Exponential Weighted Moving Average (EWMA). This line offers a visual representation of how the organization's capability fluctuates over time.
The right y-axis showcases the size of the company, depicted by the number of developers who contributed to the company's projects in a given week. The green line represents the company's size over time, with each point marking the count of contributing developers for that week. A detailed construction of the diagram can be found here.
The diagram displays a notable period where there is an inverse correlation between the company's size and its capability. Over the span of more than two years, the company size surged from 20 to 44, a substantial 120% increase. Conversely, during the same period, the capability steadily declined from 3.6 to 1.3, indicating a 64% decrease. The diagram illustrates a trend wherein the efficiency of information acquisition decreases as the number of contributing software developers increases.
Another way to visualize the relationship between the efficiency of information acquisition and the number of developers is through a histogram. This chart shows the frequency distribution of the company's 'capability' against the number of contributing developers over time.
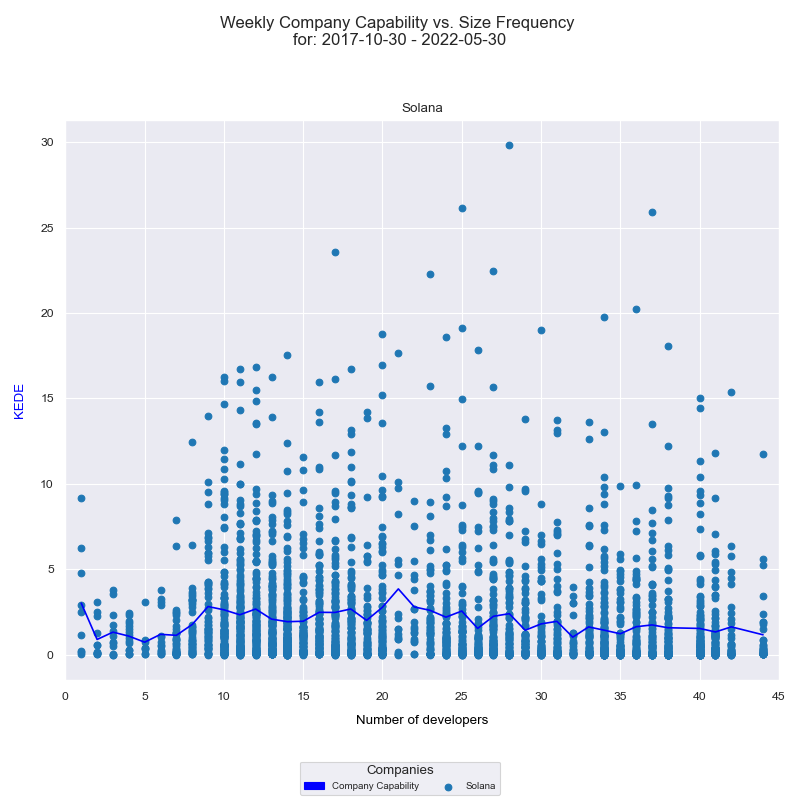
The x-axis displays the number of developers who contributed to any of the projects in a given week, while the y-axis represents the weekly KEDE values. Each individual developer's aggregated Weekly capability is presented as a light blue dot on the diagram, while the dark blue line represents the average weekly capability for all developers calculated by arithmetic mean. A detailed explanation of how this diagram was constructed can be found here. Analyzing this histogram, we once again observe that the efficiency of information acquisition tends to decrease as the number of contributing software developers increases.
Interpreting these two diagrams together, we might suggest potential issues with the level of collaboration in the organization. Challenges could arise in terms of communication, coordination, knowledge silos, individual contribution, or even information overload. While more contributors are generally beneficial, managing the complexity requires effective strategies, clear communication, and robust systems. However, it's crucial to remember that we are observing these trends from 'outside the black box'. The actual cause could be a combination of these factors, or even something entirely different. A more accurate understanding would require 'looking inside the box' to ascertain the underlying reasons.
Works Cited
1. The economic potential of generative AI: The next productivity frontier
2. Jacob Austin, Augustus Odena, Maxwell Nye, Maarten Bosma, Henryk Michalewski, David Dohan, Ellen Jiang, Carrie J. Cai, Michael Terry, Quoc V. Le, and Charles Sutton. 2021. Program Synthesis with Large Language Models. CoRR abs/2108.07732 (2021). arXiv:2108.07732 https://arxiv.org/abs/2108.07732
How to cite:
Bakardzhiev D.V. (2024) Measuring ROI of GenAI: A Knowledge-centric approach https://docs.kedehub.io/kede-manage/kede-roi-genai.html
Getting started


