The Mathematics of Knowledge Discovery Efficiency (KEDE)
This is a short read. Here is the detailed version.
KEDE definition
A Knowledge Discovery Process transforms invisible knowledge into visible, tangible output.
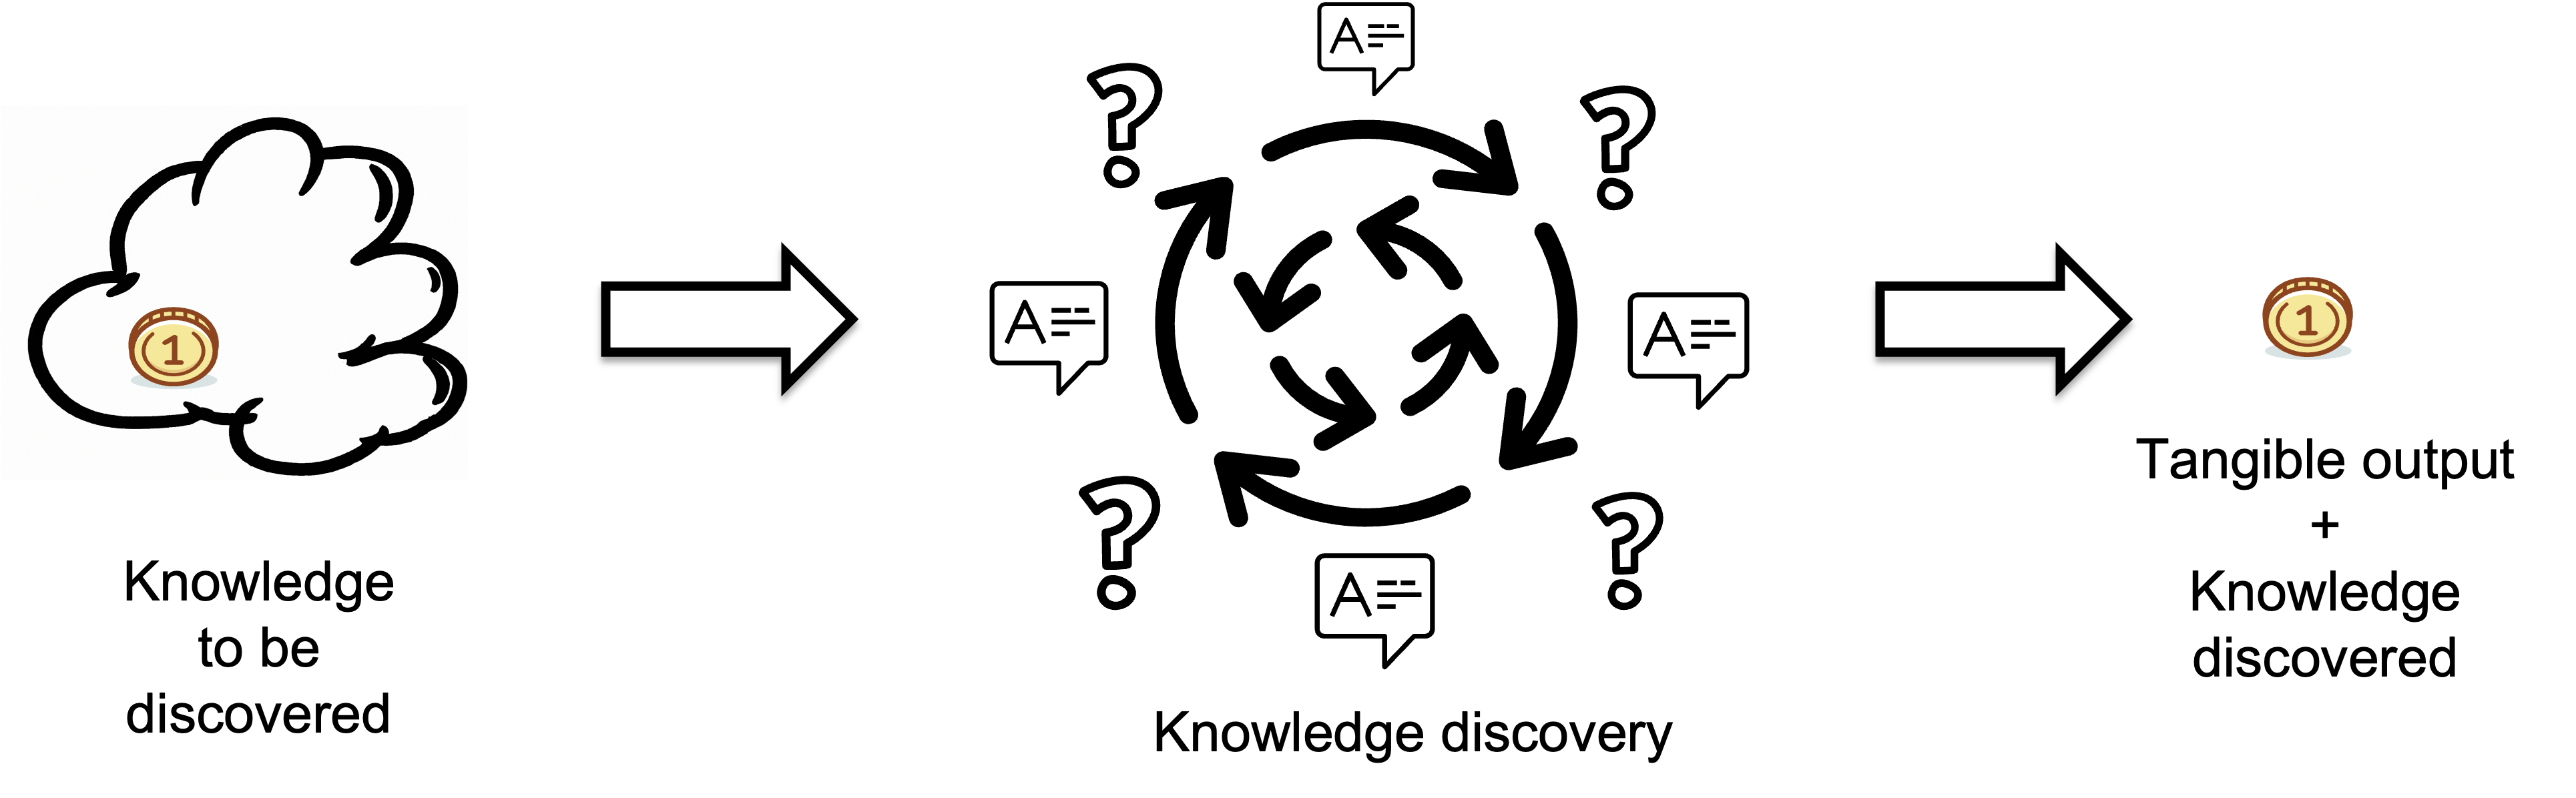
Think of it as a black box, which may contain senior and junior developers potentially using AI tools like ChatGPT. To learn more about it, please refer to this article.
To explain the tangible output, we can use an analogy from physics where a quantum is the smallest discrete unit of a physical phenomenon. In this context, tangible output comprises symbols produced..The quality of the output is assumed to meet target standards.
Inputs represent the knowledge developers lack before starting a task i.e. the missing information or knowledge that needs to be discovered, which is measured in bits.
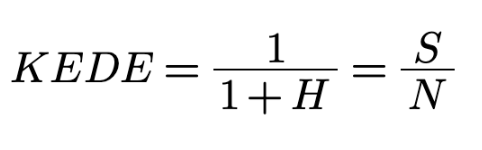
To quantify the knowledge developers didn't have before starting a task, we introduce a new metric called KEDE (KnowledgE Discovery Efficiency).
KEDE is inversely proportional to the missing information required by a task, and has values in the closed interval (0,1].
Calculating KEDE
To calculate KEDE for a knowledge discovery process, we pragmatically adopt the positivist credo that science should be based on observable facts i.e. from observable quantities we can measure. In reality the only thing we can measure is the tangible output in the form of computer code. Hence, we infer the average number of questions H asked in a time interval asked solely from the observable quantities we can measure, which is the number of symbols produced.
We define N as the maximum number of symbols that could be produced in a time interval. We assume that the minimum symbol duration is one unit of time and is equal to the time it takes to ask one question. We generalize for the sum of questions Q, symbols S and the maximum symbol rate N
The following theorem is used to calculate KEDE:
The proof of the theorem is available here.
Calculating the Balance between Individual Capabilities and Work Complexity
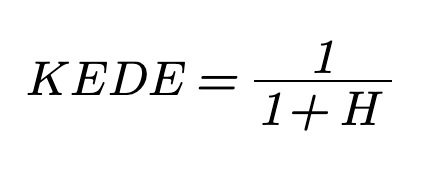
The output of a knowledge discovery process has only two possible outcomes: symbols S and questions Q), with probabilities KEDE and (1-KEDE), respectively. For calculating the balance between questions and symbols we use Shannon's formula[1]
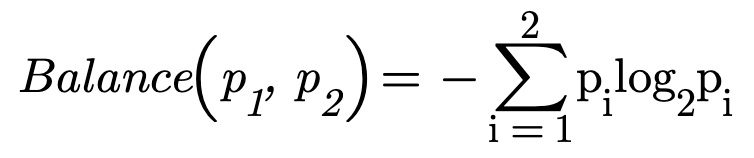
In this case, p1 = KEDE and p2 = (1-KEDE) and the Balance function of one variable is:

Figure below shows the function Balance(KEDE).
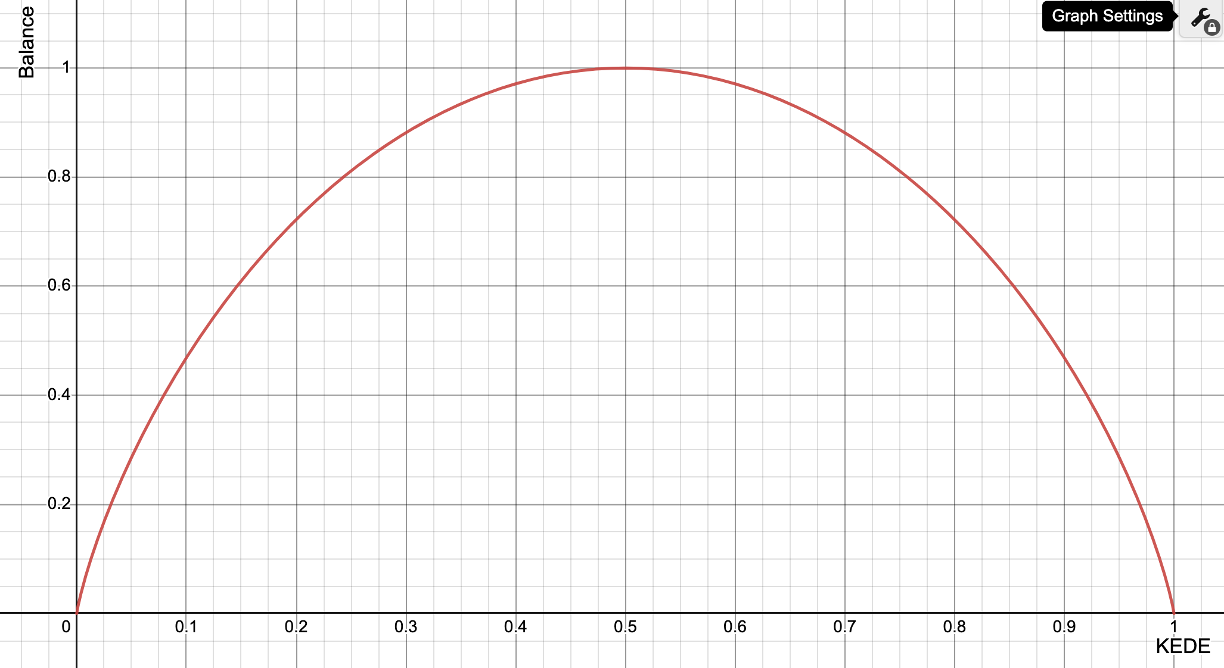
The balance function is always positive, concave (or concave downward), and has a maximum value at KEDE = 1/2. It is zero at both KEDE = 0 and KEDE = 1.
We assume that the number of questions Q reflects the complexity of the work, and the number of symbols produced S reflects the individual capabilities of a developer. When they are in balance the developer is in a state called flow.
Flow is characterized by a balance between the challenges of software development and the individual's capabilities. According to Csikszentmihalyi, it occurs at the boundary between boredom and anxiety, and is an optimal work experience[4][5].
The maximum value of the balance function is one when KEDE is equal to 1/2, as this indicates a balance between questions and answers. When KEDE is equal to 0, the developer may be in a state of anxiety, as the challenges are too great. On the other hand, when KEDE is equal to 1, the developer may be in a state of boredom, as the challenges are too low. In general, values of KEDE less than 1/2 indicate a lack of balance and a tendency towards anxiety, while values greater than 1/2 indicate a lack of balance and a tendency towards boredom. In both cases, the level of balance is less than in the case of KEDE=1/2.
Measuring KEDE in software development
In software development, we can count the actual number of symbols typed S straight from the source code files. N represents the maximum number of symbols that a single human being can contribute within a time interval. We define the value of N as:
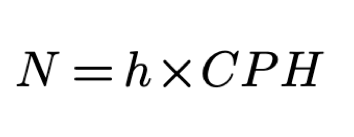
When we substitute this formula for N and convert the KEDE equation into percentages, it becomes:


- Minimum value of 0 and maximum value of 100.
- KEDE approaches 0 when the missing information is infinite, which is the case when humans create new knowledge, as exemplified by intellectuals like Albert Einstein and startups developing new technologies like PayPal.
- KEDE approaches 100 when the missing information is zero, which is the case for an omniscient being, such as God.
- KEDE is higher when software developers apply prior knowledge instead of discovering new knowledge.
- anchored to the natural constraints of the maximum possible typing speed and the cognitive control of the human brain, supporting comparisons across contexts, programming languages and applications.
For an expert full-time software developer who mostly applies prior knowledge but also creates new knowledge when needed, we would expect a KEDE value of 20.
As explained here the value of CPH is determined by natural constraints, such as:
- The maximum typing speed of human beings r, which is approximately 4.2 symbols per second[6]
- The cognitive control capacity of the human brain, which is approximately 3 to 4 bits per second Since we assume one question equals one bit of information we get 3 to 4 questions per second[7].
- Asking questions is an effortful task that cannot be done while typing[3].
In order to obtain a maximum symbol rate CPH of 100,000 symbols per 8 hours of work, a symbol rate r of 3.47 symbols per second, an eight-hour workday, and a CPH of 12,500 symbols per hour are defined..
What is the value of knowing KEDE?
The value of knowing KEDE is that it allows for quantifying the human capital of any organization, as well as the happiness, productivity of, and collaboration between software developers. KEDE is the only metric to enable such quantification.
Works Cited
1. Shannon, C. E. (1948). A Mathematical Theory of Communication. Bell System Technical Journal. 1948;27(3):379-423. doi:10.1002/j.1538-7305.1948.tb01338.x
2. Drucker , Peter F, “Knowledge-Worker Productivity: The Biggest Challenge,California Management Review, vol. 41, no. 2, pp. 79–94, Jan. 1999, doi: 10.2307/41165987.x
3. Kahneman D. (1973). Attention and Effort. Englewood Cliffs, NJ: Prentice-Hall
4. Csikszentmihalyi, M. 1990. Flow: the psychology of optimal experience. United States of America: Harper & Row.
5. Csikszentmihalyi, M 1975. Beyond Boredom and Anxiety: The Experience of Play in Work and Games. San Francisco: Jossey-Bass
6. Dhakal, V., Feit, A. M., Kristensson, P. O., & Oulasvirta, A. (2018). Observations on Typing from 136 Million Keystrokes. In Proceedings of the 2018 CHI Conference on Human Factors in Computing Systems (pp. 1-12). Association for Computing Machinery. https://doi.org/10.1145/3173574.3174220
7. Wu T, Dufford AJ, Mackie MA, Egan LJ, Fan J. The Capacity of Cognitive Control Estimated from a Perceptual Decision Making Task. Sci Rep. 2016 Sep 23;6:34025. doi: 10.1038/srep34025. PMID: 27659950; PMCID: PMC5034293.
Getting started


