Solana Capability vs. Size Analysis
Using the scientifically backed and patented metric - Knowledge Discovery Efficiency (KEDE)
Motivation
Software development projects rely on the contribution of teams of developers, who collaborate and coordinate their efforts. How team size is related to the utilization of their human capital, is an important consideration for project and schedule management as well as for cost estimation. The majority of studies of software development suggest that teams become less productive as they grow in size. In software development there is the Brooks' law, which states that “adding more people to a late software project makes it later”[1].
In this article we provide an analysis of the relation between size and development capability of a software development organization. Capability for software developers means efficient acquisition and application of knowledge.
As explained here software developers apply knowledge in order to deliver outcomes. If they don't have the knowledge needed they have to discover it. Prior knowledge is the easiest and the fastest to discover - it is in the head, one just applies it. In other words, when prior knowledge is applied then there is the most efficient knowledge discovery. The more prior knowledge was applied for achieving the desired outcome the more capable a software development process is.
KEDEHub allows us to measure the development capability of a company using the scientifically backed and patented metric - Knowledge Discovery Efficiency (KEDE).
The company we will look into is Solana [1] because the blockchain protocol they are developing is a true innovation and also their historical data from the white paper and the first prototype through present days is publicly available.
Solana is a layer-one blockchain network that can implement smart contracts. It is billed as the solution to the scaling issues of Bitcoin and Ethereum. Solana is the fastest blockchain in the world and the fastest growing ecosystem in crypto, with over 400 projects spanning DeFi, NFTs, Web3 and more. Two years after its founding in July 2019, Solana was able to land $20 million in a Series A funding round led by Multicoin Capital. On June 9, 2021 Solana announced it has raised over $314 million of new funding in a private token sale led by Andreessen Horowitz and Polychain Capital, to be used to further its technology in the decentralized finance (DeFi) arena.
Data Analysis and Primary Findings
This analysis starts with the Overall performance where are the main results and findings. Then we continue with the detailed findings per time period as follows:
- Start through V0.6 (Multinode testnet)
- From V0.6 to Silver Strand v0.15.0 .
- From v0.15.0 to Sultans v0.21.0
- From v0.21.0 to v1.3
- From v1.3.0 to Mainnet v1.9.24
At the end we conclude with a few words of caution. The important details and the methodology are presented in Appendix A.
Overall performance
Below is a time series diagram of the impact company size has had on the development capability for the whole history of Solana. It started on October 30th, 2017 when Anatoly Yakovenko [11] started the work on what was to become Solana[3]. and ends in May 2022 when Solana has a Market Cap of $13.2B.
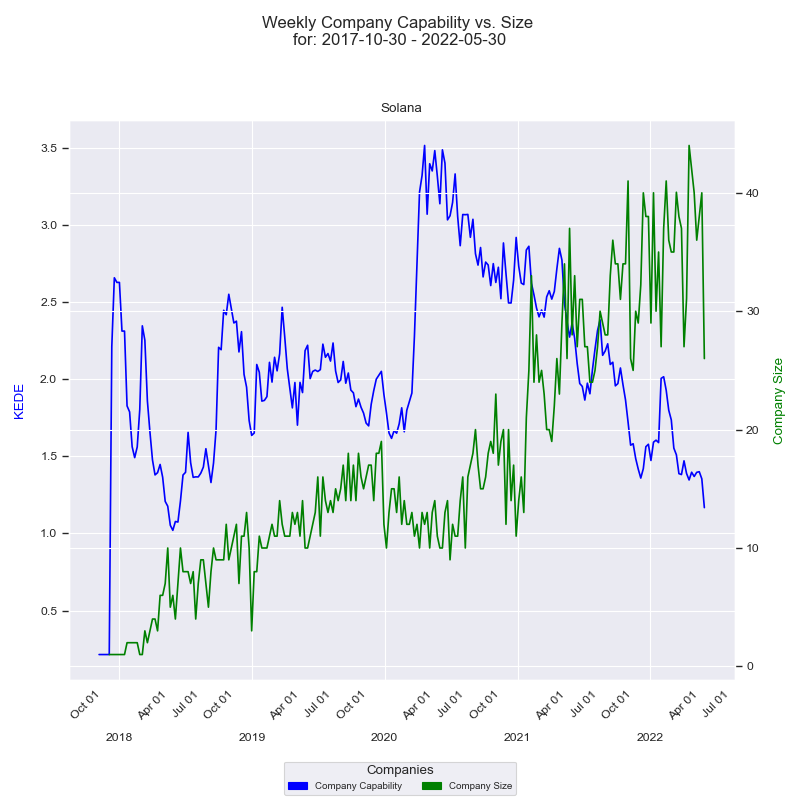
On the x-axis we have the quarter dates. Then we have two y-axises - one for the capability and one for the size of the company. Capability axis is to the left and is in Weekly KEDE values. How capability changes through time is presented by the dark blue line calculated using EWMA. Each point of the blue line is the average Weekly KEDE for all the developers who contributed in that week. Company size axis is to the right and is the number of developers who contributed to any of Solana projects in a given week. How company size changed through time is presented by the green line. Each point of the green line is the number of developers who contributed in a given week. How the diagram is constructed is explained here.
Along with the time series of Solana capability it's very useful to see a frequency diagram of the same data. A frequency distribution shows how often each different value in a set of data occurs. Since a certain size can happen in more than one week we would like to know what would be the average capability for each company size. We have this presented on the diagram below.
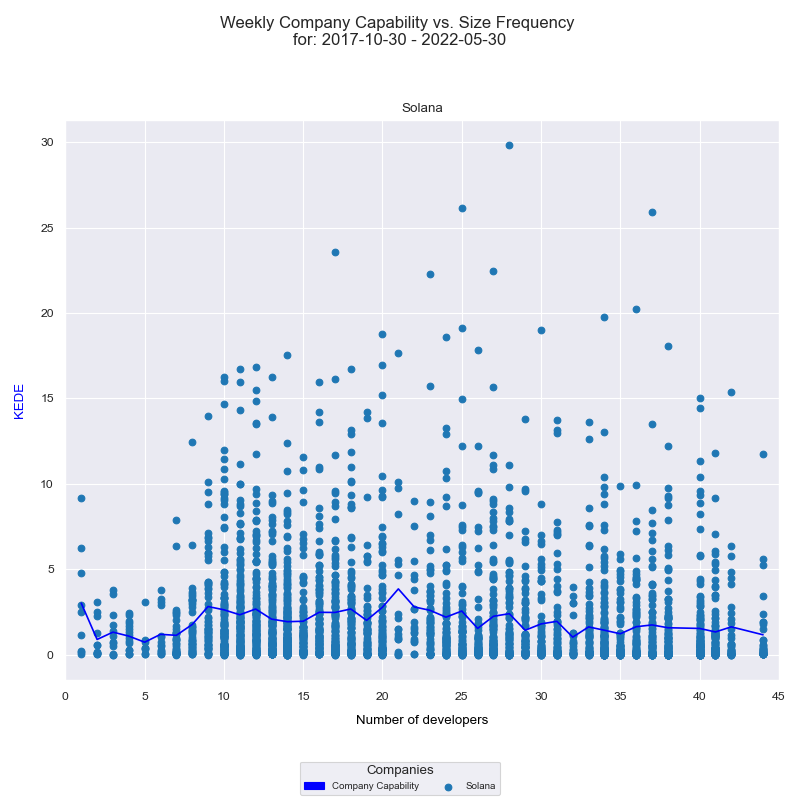
On the x-axis we have the number of developers who contributed to any of Solana projects in a given week. On the y-axis we have Weekly KEDE values. Each individual developer's aggregated Weekly KEDE is presented as a light blue dot on the diagram. The dark blue line is the average weekly KEDE for all developers calculated by arithmetic mean. How the diagram is constructed is available here.
Discussion
It is visible on the time-series diagram that Weekly KEDE fluctuates between 1 and 3.5 for the different company sizes. The average value is around 2. As explained here KEDE has values between 0 and 100. Thus, Weekly KEDE of around 2 is not spectacular.
On the same time-series diagram we also see three instances of Brooks' law. It states that “adding more people to a late project makes it later”[1].
First instance is the period from the beginning of Solana - when the founder himself worked on the white paper and on the initial prototype, through June 2018. We see that headcount increased from 1 to 10. That is a 1000% increase! At the same time capability, measured in Weekly KEDE, decreased from 2.6 to 1.1. That is a 58% decrease. Such a negative association between capability and headcount is predicted by Brooks' law.
Second instance is between June and October 2019. We see again that there is a negative association between the company size and its capability. Through the period company size increased steadily from 10 to 17 developers. That is a 70% increase. At the same time capability declined from 2.4 to 1.7. That is a 30% decrease. From the frequency diagram we see that the highest capability was when there were 13 contributing developers. We see again that there is a negative association between the company size and its capability. This is another instance of Brooks' law in practice.
Third instance of Brooks' law is for the period between August 2020 and June 2022. We see again that there is a negative association between the company size and its capability. For more than two years company size grew steadily from 20 to 44. That is a 200% increase. At the same time capability steadily decreased from 3.6 to 1.3. That is a 64% decrease. Again we witness a period, where there is a negative association between the company size and its capability. This is yet another instance of Brooks' law in practice.
From the time-series diagram one might conclude that since the highest capability was between April and August 2020 when the number of contributing developers fluctuated around 12. Capability skyrocketed to 3.25 - the highest in the history of Solana!
To account for cases like the above we need to look at the frequency chart. If we want to generalize we can safely conclude that historically the best size for Solana was between 10 and 20 developers. With the size increasing above 20 the capability steadily decreases. It looks like organizing and leading between 10 and 20 people is what Solana management is capable of.
Start through V0.6 (Multinode testnet)
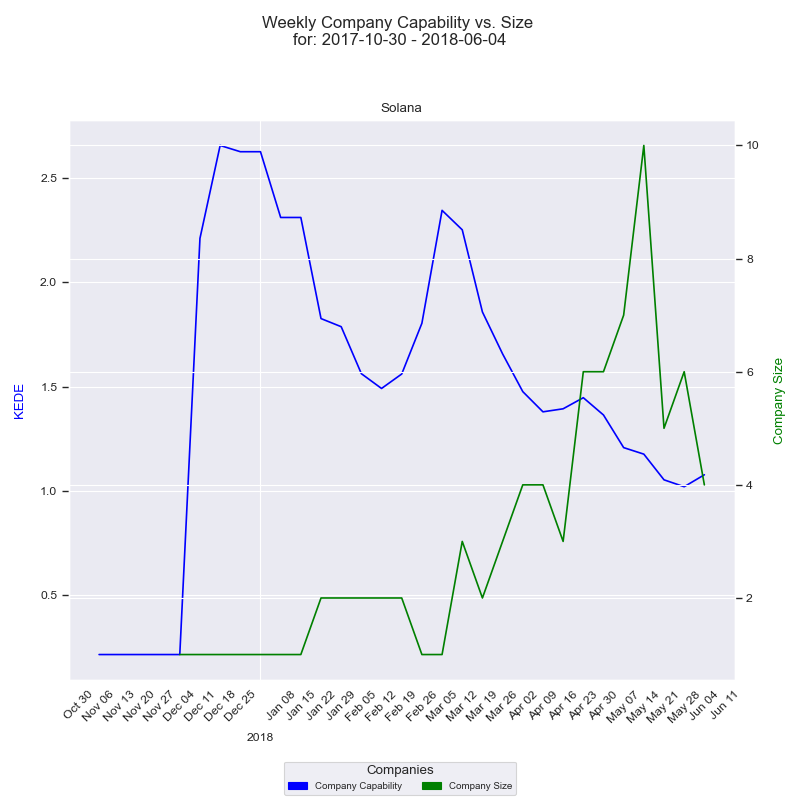
Solana was conceived on Oct 30th, 2017 when Anatoly Yakovenko started the white paper on what was to become Solana[3]. In the white paper Anatoly solved the problem of getting computers that don't trust each other to agree on time. Anatoly's development began in a private codebase "loom" and was implemented in the C programming language. Anatoly recruited Greg Fitzgerald, Stephen Akridge and three others to co-found a company, then called Loom. They hired Rob Walker, former Senior Director of Engineering at Qualcomm. Also got two other new full-time hires, as well as 3 part-timers and some volunteers from the growing Solana community. In June of 2018, the team scaled up the technology to run on cloud-based networks and delivered v0.6.0 on June 2nd 2018.
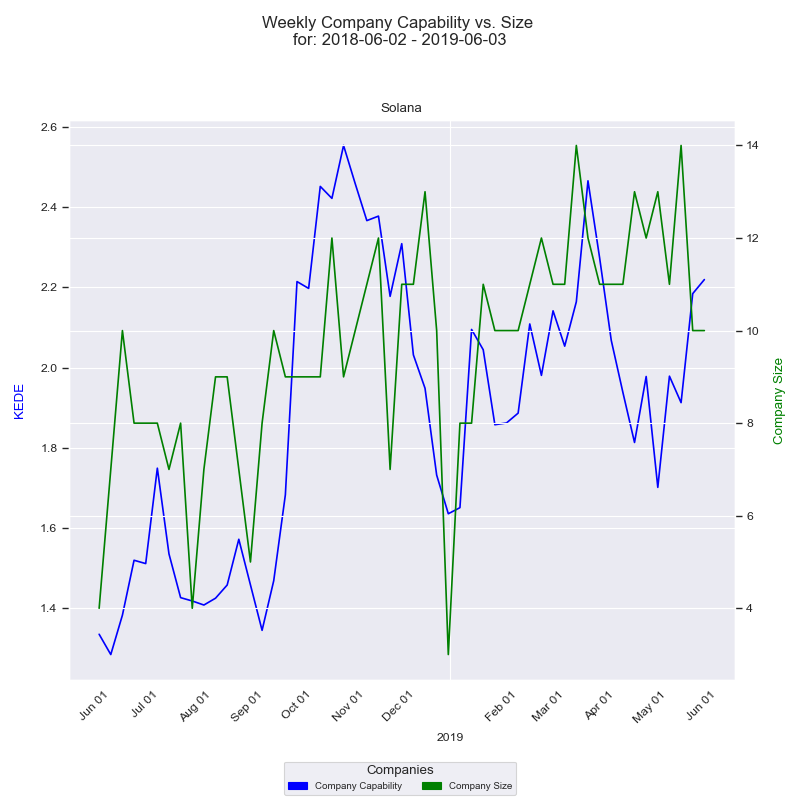
Below is a time series diagram of the impact company size has had on the development capability for the period.
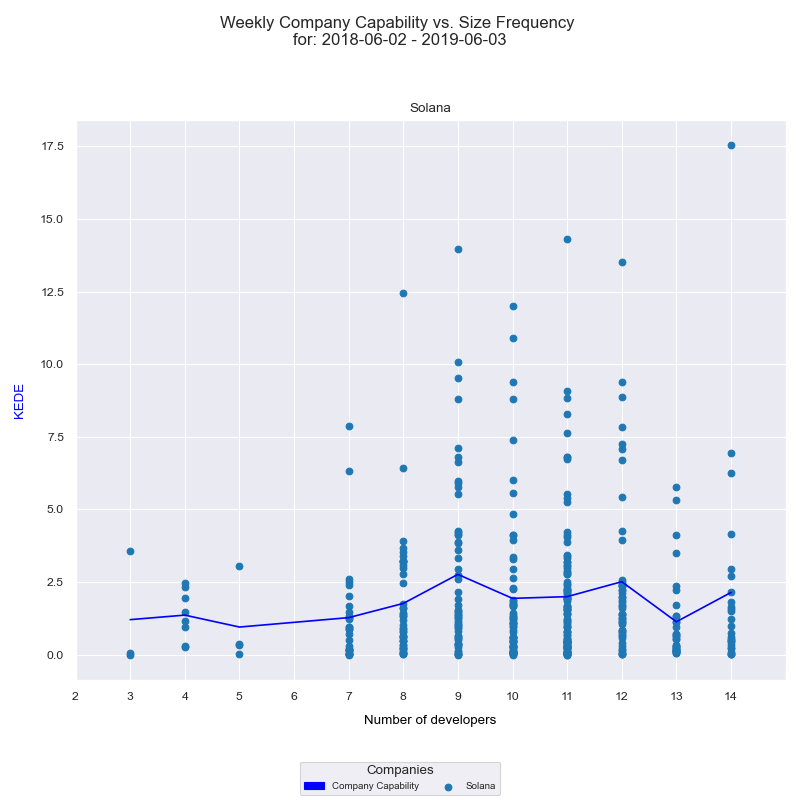
Along with the time series of Solana capability it's very useful to see a frequency diagram of the same data.
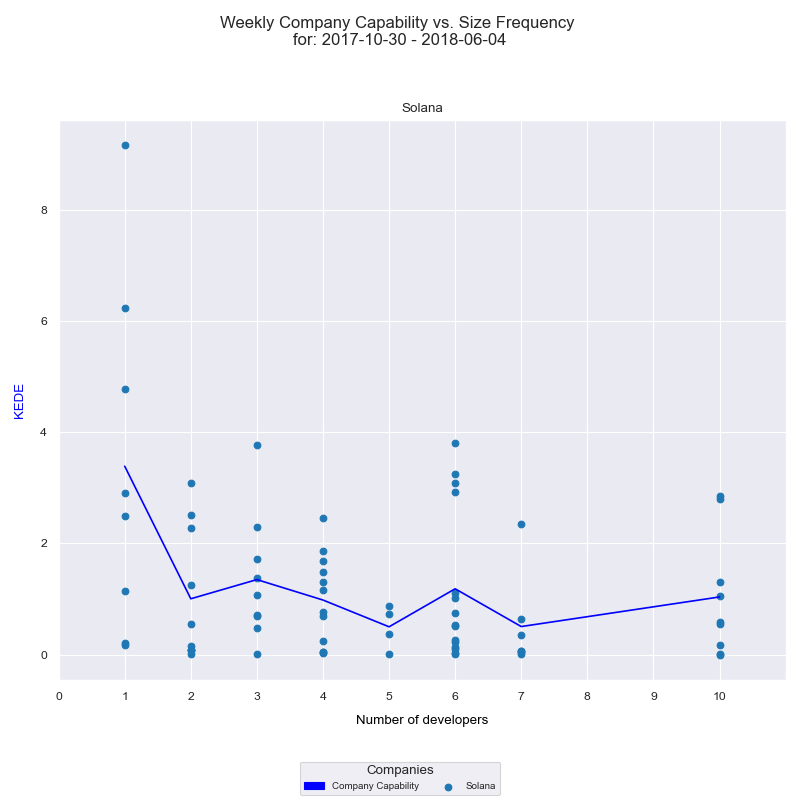
We see that headcount increased from 1 to 10. That is a 1000% increase! At the same time capability, measured in Weekly KEDE, decreased from 2.6 to 1.1. That is a 58% decrease. Such a negative association between capability and headcount is predicted by Brooks' law. Here we have an empirical confirmation of the law. That can be explained with the difficulties the founder has had communicating his vision with the new developers. Some may argue that this decline in capability was due to the team testing the new release. To that we say that first, there were many releases during the period, and second we don't measure testing but development. If the team needed testing they should have allocated testers and not use the precisos development talent for that. Thirdly, we need to remember that we use averaged Weekly KEDE over all developers i.e. Weekly KEDE per employee. Average Weekly KEDE measures how efficiently a particular organization utilizes its human capital. Ideally, a company wants the highest averaged Weekly KEDE possible because a higher value indicates greater productivity.
From V0.6 to Silver Strand v0.15.0
On May 29th 2019 the team delivered Silver Strand v0.15.0 (Pemissionless Validator Staking).
Below is a time series diagram of the impact company size has had on the development capability for the period.
Along with the time series of Solana capability it's very useful to see a frequency diagram of the same data.
Between June and September headcount stabilized around 7. Capability stayed around 1.4 - mostly at the level of the end of the previous period. Then from October through June 2019 the number of developers increased up to 14. That is a 100% increase. Capability also increased back to 2.5 - mostly at the level the previous period started. That is a 92% increase. From the frequency diagram we see that the most productive case was when the team size was 9 developers for several weeks. We can say that the team recovered from the previous period. Capability stabilized. Creating and sharing of knowledge improved.
From v0.15.0 to Sultans v0.21.0
On November 27th 2019, Solana released Sultans v0.21.0.
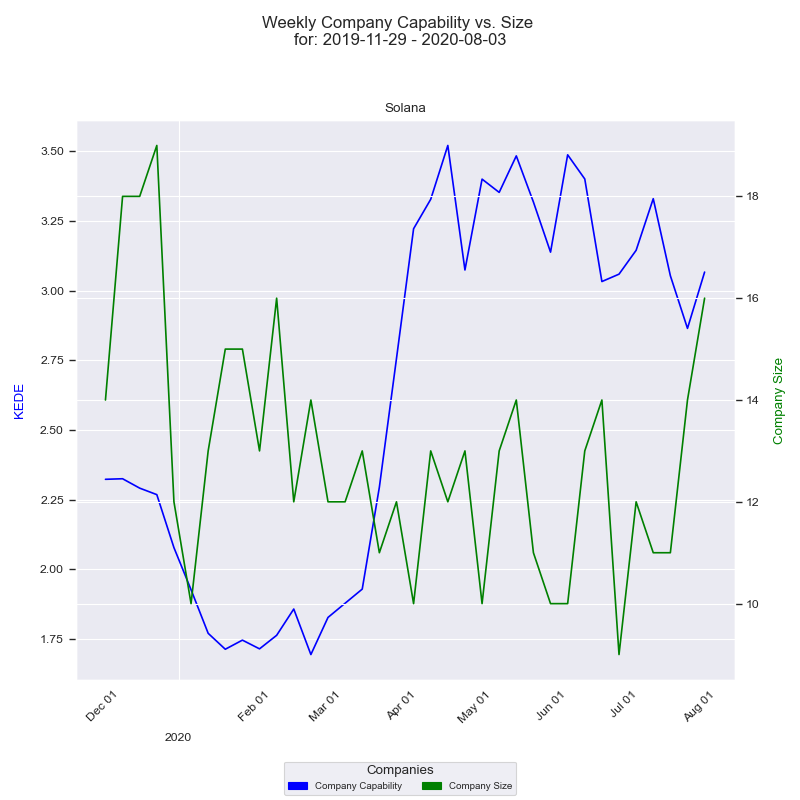
Below is a time series diagram of the impact company size has had on the development capability for the period.
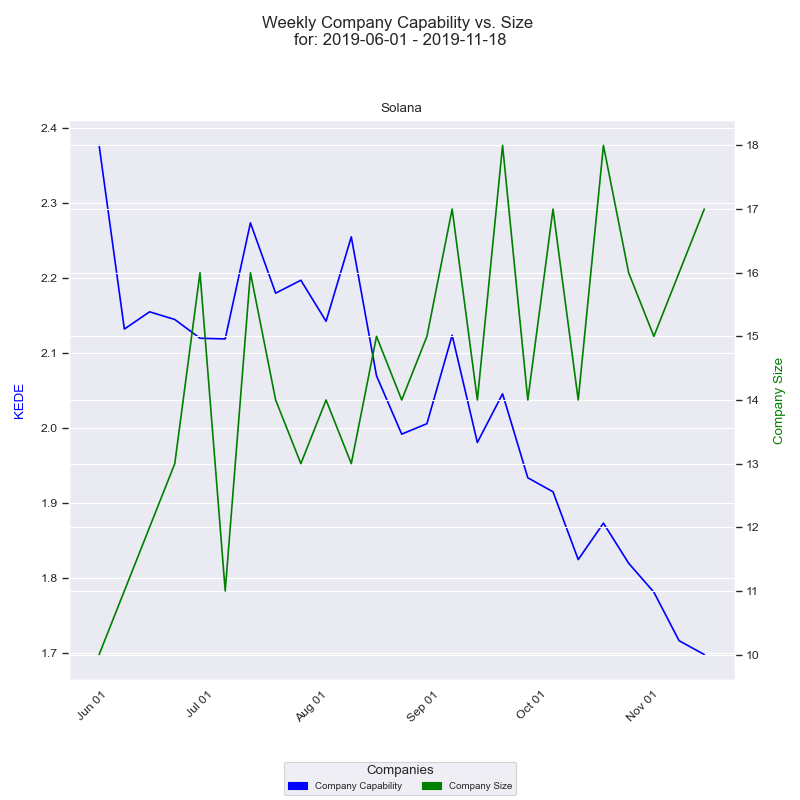
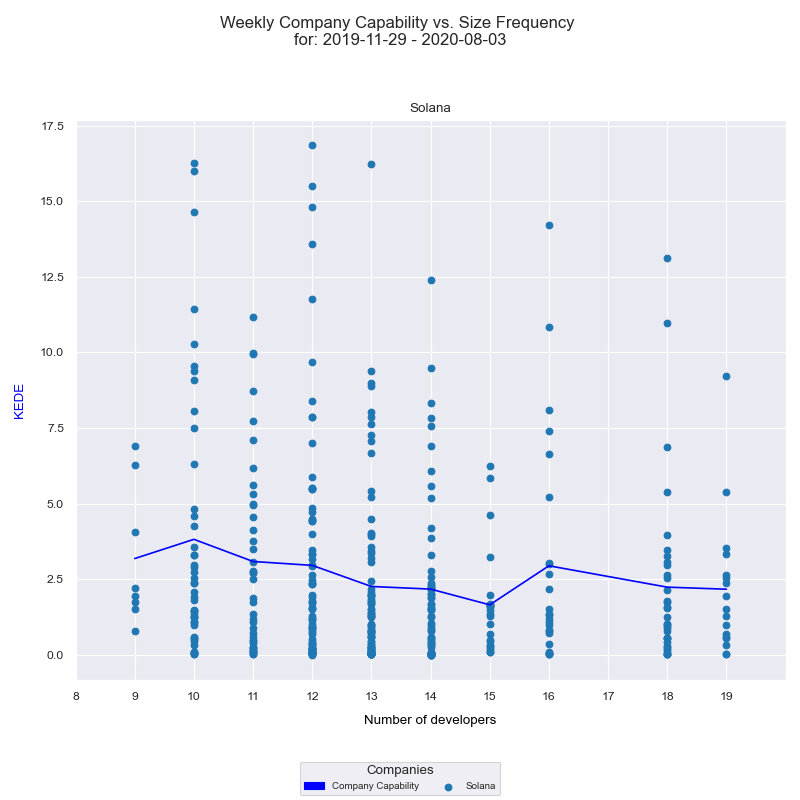
Along with the time series of Solana capability it's very useful to see a frequency diagram of the same data.
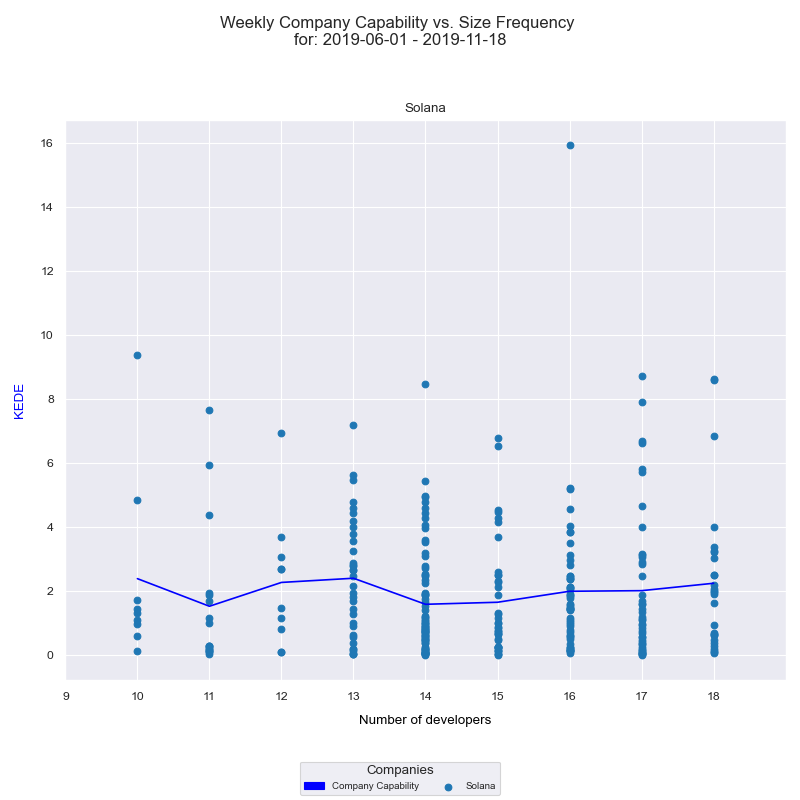
Through the period company size increased steadily from 10 to 17 developers. That is a 70% increase. At the same time capability declined from 2.4 to 1.7. That is a 30% decrease. From the frequency diagram we see that the highest capability was when there were 13 contributing developers. We see again that there is a negative association between the company size and its capability. This is another instance of Brooks' law in practice.
From v0.21.0 to v1.3.0
On August 7th 2020 Solana team delivered v1.3.0.
Below is a time series diagram of the impact company size has had on the development capability for the period.
Along with the time series of Solana capability it's very useful to see a frequency diagram of the same data.
Thsi period shows another instance of absorbing the increased number of developers from a previous Brooks' period. Between October 2019 and April 2020 the number of contributing developers declined to 12. Capability stayed around 1.8 - mostly at the level of the end of the previous period. We see an instance of a reverse Brooks' law - "reducing headcount of a software project improves its development capability". Then from April through August 2020 the number of contributing developers fluctuated around 12. Capability skyrocketed to 3.25 - the highest in the history of Solana! That is a 92% increase. From the frequency diagram we see that the most productive case was when the team size was 10 developers for several weeks. That is almost the same headcount as from the previous "stable" period.
From v1.3.0 to Mainnet v1.9.24.
On May 24th 2022 Solana releazed Mainnet v1.9.24.
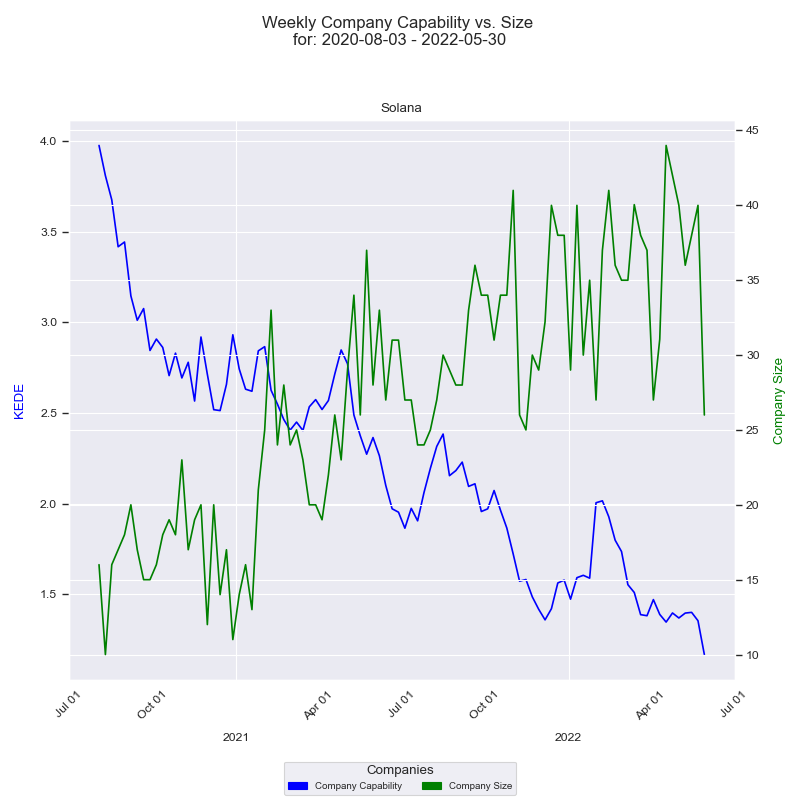
Below is a time series diagram of the impact company size has had on the development capability for the period.
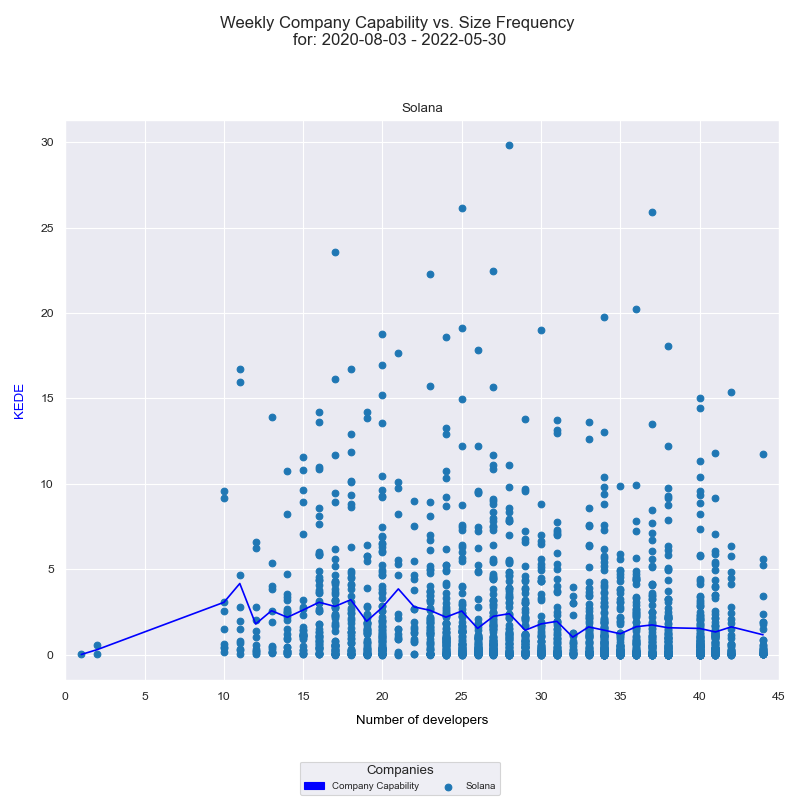
Along with the time series of Solana capability it's very useful to see a frequency diagram of the same data.
For more than two years company size grew steadily from 20 to 44. That is a 120% increase. At the same time capability steadily decreased from 3.6 to 1.3. That is a 64% decrease. Again we witness a period, where there is a negative association between the company size and its capability. This is yet another instance of Brooks' law in practice.
Such a long period of decline in development capability points out some significant flow in the way software development have been managed at Solana. From the frequency diagram we see that there even were a few weeks where Solana had only one contributing developer!
Conclusion
In the past it was argued that the physician's touch captured information richer than any tool. Researchers, however, persevered. They wanted to discover reproducible laws in medicine, and the verbal descriptions from doctors were not getting them there. Words are idiosyncratic; they vary from doctor to doctor and even for the same doctor from day to day. Numbers never waver. Today physicians use a thermometer in order to get an understanding about what is going on inside the black box that is a human organism. It is clear we can use KEDE the same way - to get visibility into the black box that is an organization developing software.
As explained here individual KEDE is a function of processes and policies of the organization the software developer works in. Even though KEDE is objective and scientifically based you should not rely only on it. There are cases where KEDE alone is not sufficient to understand how the knowledge discovery happens inside the organization. Very often you'd need a closer look inside the black box and take into account the white box. The white box goes beyond the numbers and gets into how the organization produced the numbers.
Appendix A: Methodology
We have included repositories that are exclusively hosted on GitHub for this release of the report. Repositories that have been forked from other repositories have been excluded from our analysis such that some genuine development activities may not have been included. Some projects may be affected more than others. In this report, we have included activity not only of the main branch, but also of all other branches. Hence commits that have not yet reached the main branch or are for any reason kept out from the main branch have been included.
Project splana-examples comprises of three repositories:
- https://github.com/solana-labs/solana-program-library.git
- https://github.com/solana-labs/example-helloworld.git
- https://github.com/solana-labs/break.git
List of analyzed repositories:
- https://github.com/solana-labs/solana.git
- https://github.com/solana-labs/solana-program-library.git
- https://github.com/solana-labs/solana-web3.js.git
- https://github.com/solana-labs/example-helloworld.git
- https://github.com/solana-labs/wallet-adapter.git
- https://github.com/solana-labs/explorer.git
- https://github.com/solana-labs/oyster.git
- https://github.com/solana-labs/rbpf.git starting from 2018-09-01 commit
- https://github.com/solana-labs/tour-de-sol.git
- https://github.com/solana-labs/dapp-scaffold.git
- https://github.com/solana-labs/stake-o-matic.git
- https://github.com/solana-labs/break.git
- https://github.com/solana-labs/example-tictactoe.git
- https://github.com/solana-labs/solana-perf-libs.git
- https://github.com/solana-labs/ledger-app-solana.git
- https://github.com/solana-labs/networkexplorer.git
- https://github.com/solana-labs/example-messagefeed.git
- https://github.com/solana-labs/metaplex.git
- https://github.com/solana-labs/solana-solidity.js.git
- https://github.com/solana-labs/obsolete-dontuse-example-webwallet.git
- https://github.com/solana-labs/cluster.git
- https://github.com/solana-labs/whitepaper.git
- https://github.com/solana-labs/solminer.git
- https://github.com/solana-labs/oyster-lending.git
- https://github.com/solana-labs/solana-season.git
- https://github.com/solana-labs/browser-extension.git
- https://github.com/solana-labs/solana-flagged-accounts.git
- https://github.com/solana-labs/reddit-scaling-demo.git
- https://github.com/solana-labs/example-token.git
- https://github.com/solana-labs/inc-20210825.git
- https://github.com/solana-labs/llvm-builder.git
- https://github.com/solana-labs/bpf-tools.git
- https://github.com/solana-labs/solana-bigtable.git
- https://github.com/solana-labs/example-move.git
- https://github.com/solana-labs/defi-hackathon.git
- https://github.com/solana-labs/wormhole-hackathon.git
- https://github.com/solana-labs/buffer-layout.git starting from 2021-07-09 commit
- https://github.com/solana-labs/network_simulation.git
- https://github.com/solana-labs/oyster-swap.git
- https://github.com/solana-labs/oyster-bridge.git
- https://github.com/solana-labs/metrics-tee.git
- https://github.com/garious/loom.git
- https://github.com/solana-labs/rust-bpf-sysroot.git
- https://github.com/solana-labs/solana-tokens.git
- https://github.com/solana-labs/dc-homedir-skeleton.git
- https://github.com/solana-labs/kurtosis-solana-testing.git
- https://github.com/solana-labs/solana-voib-demo.git
- https://github.com/solana-labs/cargo-run-bpf-tests.git
- https://github.com/solana-labs/buffer-layout-utils.git
- https://github.com/solana-labs/oyster-margin.git
- https://github.com/solana-labs/rosetta-solana.git
- https://github.com/solana-labs/rust-bpf-builder.git
- https://github.com/solana-labs/token-ops.git
- https://github.com/solana-labs/sealevel.git
- https://github.com/solana-labs/solana-build.git
- https://github.com/solana-labs/solana-json-rpc-https-proxy.git
- https://github.com/solana-labs/solana-labs.github.io.git
- https://github.com/solana-labs/validator-tracker.git
- https://github.com/solana-labs/solana-pkcs8.git
References
1. Brooks, F. P. (1995). The mythical man-month: Essays on software engineering. Addison-Wesley
Getting started


