FeedHenry Transition to Agile
Measuring the success of an Agile Transformation
Motivation
How do you measure the success of an Agile transformation?
More too often the success of an Agile transformation is judged using only metrics such as increase in the throughput of user stories, increase in velocity of story points, reduction of the average time needed to deliver a user story. Balancing the supply with demand for features usually also counts as a success. Each of those approaches accounts for some important facet of software development.
However all of the approaches can actually be applied to manual work just as well!. That is because they don't measure what is specific to software development only - its essence, which is the acquisition and application of knowledge.
As explained here software developers apply knowledge in order to deliver outcomes. If they don't have the knowledge needed they have to discover it. prior knowledge is the easiest and the fastest to discover - it is in the head, one just applies it. In other words, when prior knowledge is applied then there is the most efficient knowledge discovery. The more prior knowledge was applied for achieving the desired outcome the more capable a software development process is.
KEDEHub allows you to measure the capability of a software development organization using the scientifically backed and patented metric - Knowledge Discovery Efficiency (KEDE).
We will look at FeedHenry, which is a cloud-based enterprise mobile application platform that enables users to design, develop, deploy and manage applications for mobile devices. The platform specializes in extending enterprise systems to mobile devices, and provides mobile-specific services for security, notifications and data synchronization. Developers can easily build backend logic that supports their mobile applications—all in a secure, scalable manner[1].
The Agile transformation at FeedHenry was part of the Agile journey in Red Hat. FeedHenry's story had been successfully replicated across the product suite that Red Hat offers, as claimed by the coach[4].
Data Analysis and Primary Findings
This analysis starts with the Overall capability where are the main results and findings. Then we continue with the detailed findings per time period as follows:
The important details and the methodology are presented in Appendix A. At the end we conclude with a few words of caution.
Overall capability
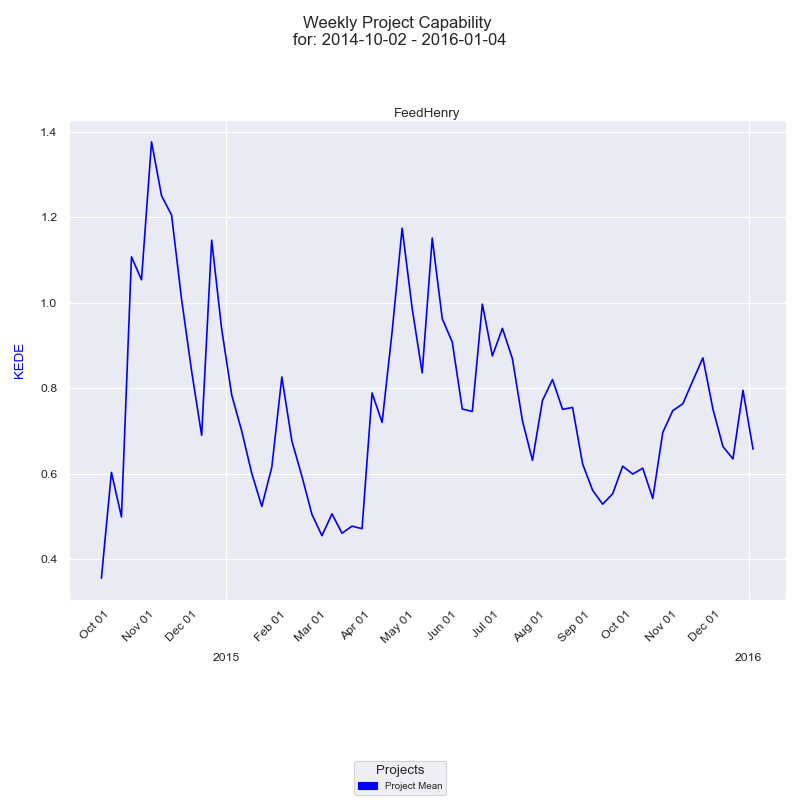
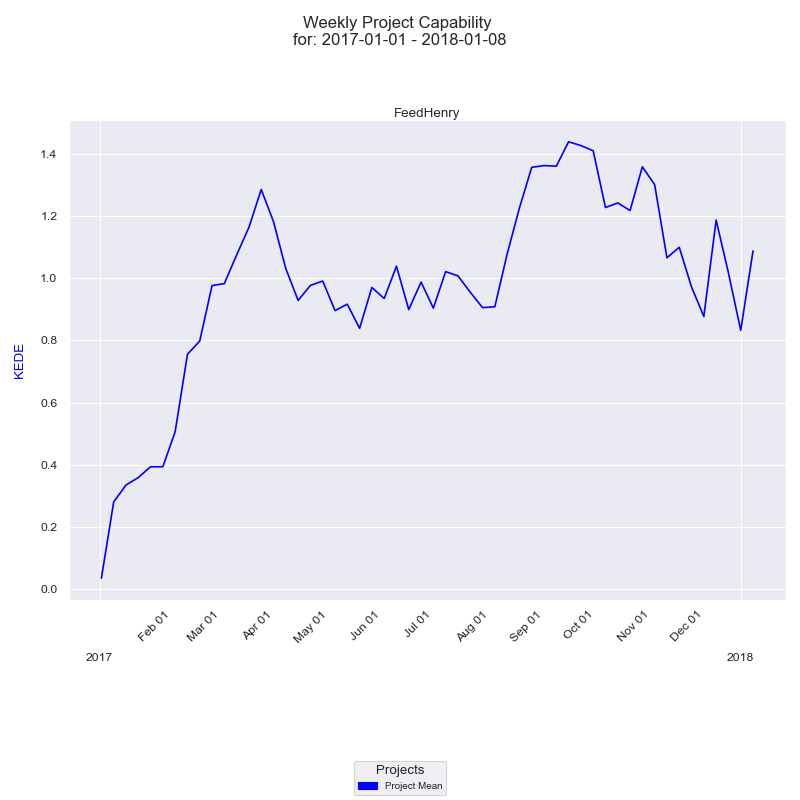
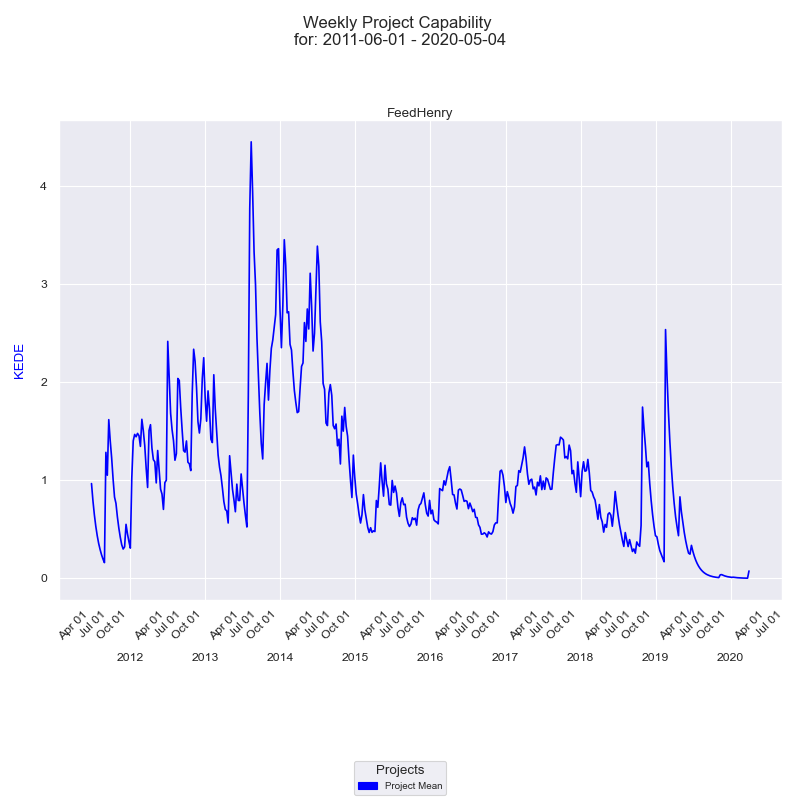
FeedHenry transition to Agile started when the coach joined the team in December, 2015 as a ScrumMaster and Senior Software Engineer. Below is a time-series diagram of FeedHenry development capability for the from the moment the coach joined through the announcement of FeedHenry end of support in 2018..
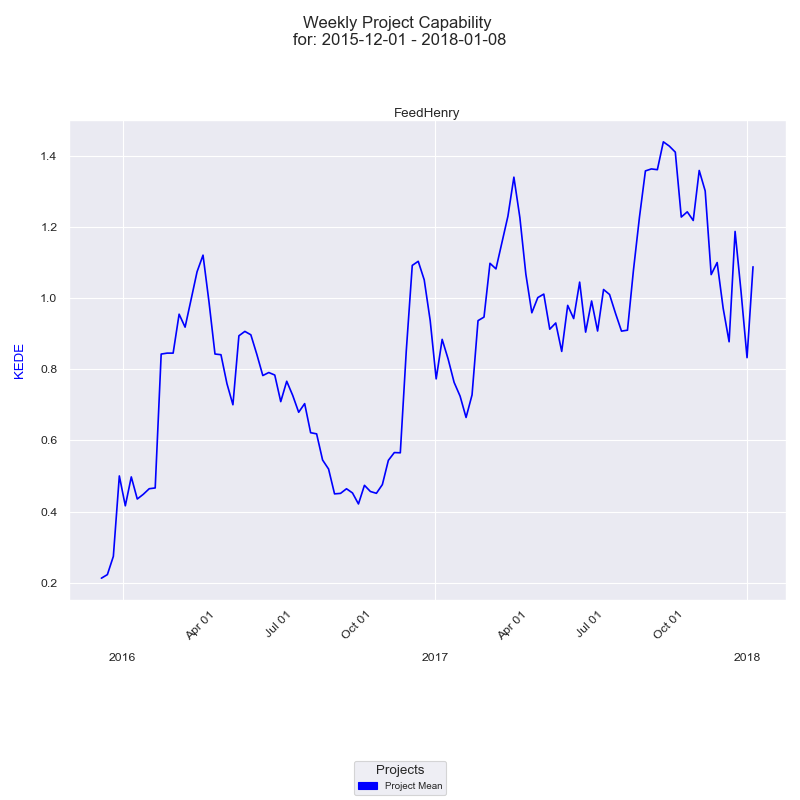
In the diagram above we have presented Knowledge Discovery Efficiency (KEDE) for each of the developers who contributed to FeedHenry for the Agile transformation period. On the x-axis we have the quarter dates. On the y-axis we have Weekly KEDE values. The dark blue line is the average weekly KEDE for all developers calculated by EWMA.
The upward trend in capability is clearly visible on Fig.1. Starting for a very low point of KEDE = 0.5 the capability stabilized around KEDE = 1.2. That means the Agile transformation had a very positive effect on FeedHenry development capability.
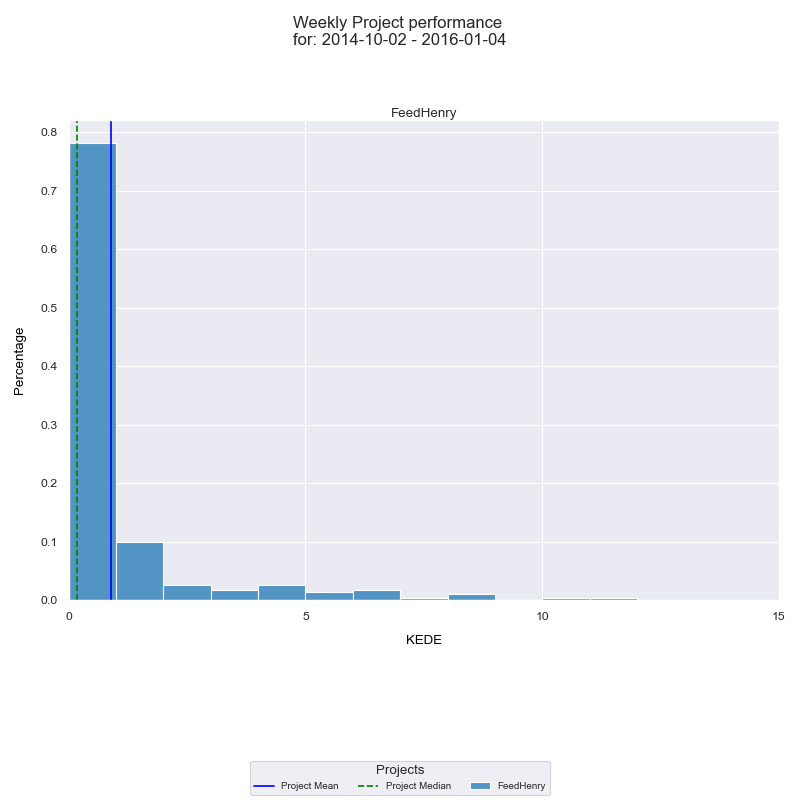
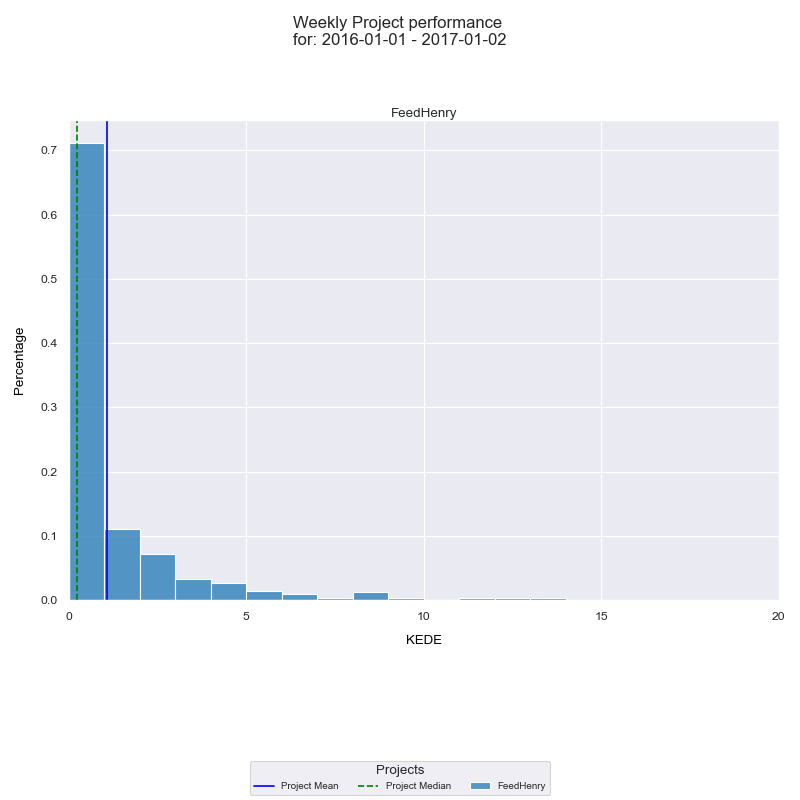
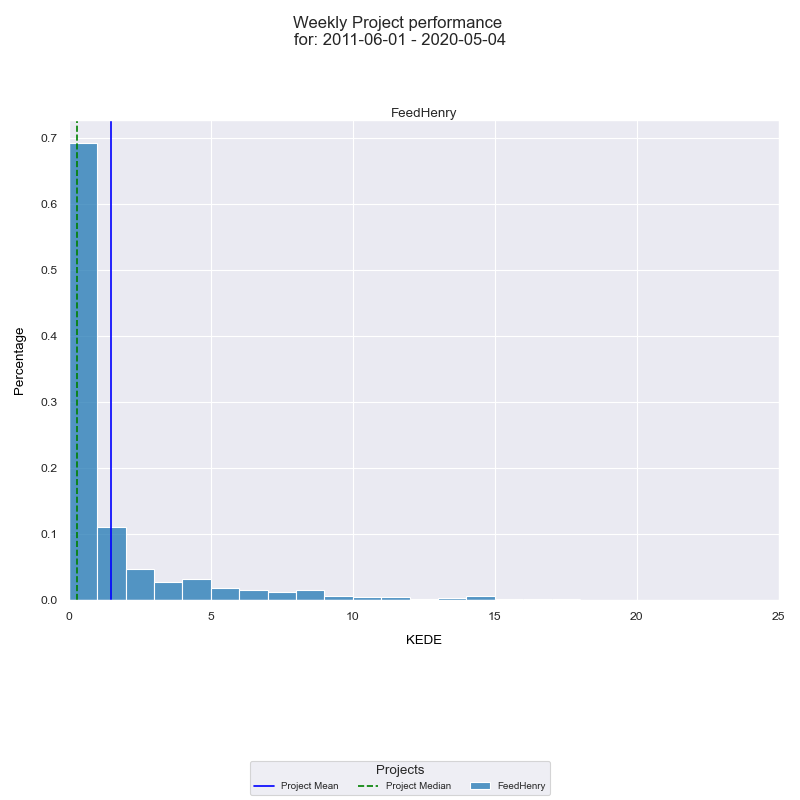
Along with the time series of FeedHenry capability it's very useful to see a histogram.of the underlying frequency distribution. A frequency distribution shows how often each different value in a set of data occurs. The diagram below presents a histogram of aggregated Weekly KEDE values for the Agile transformation period.
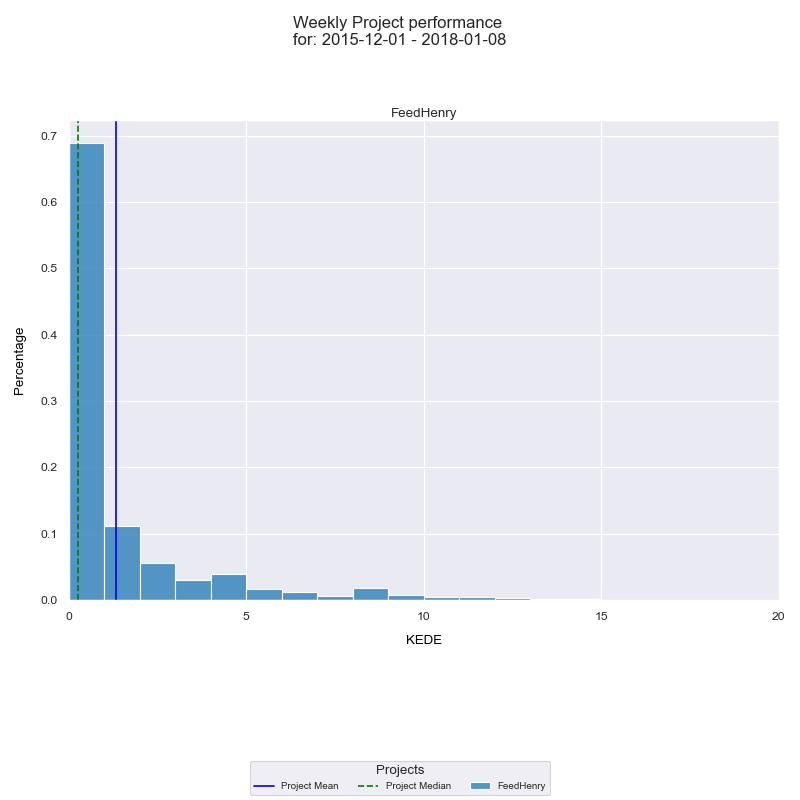
On the x-axis we have the Weekly KEDE. On the y-axis we have the percentage of each particular value. The blue vertical line is the average weekly KEDE for all FeedHenry developers for the selected period. The average values are calculated by arithmetic mean. The median Weekly KEDE for the selected period is presented by the green vertical dashed line.
The average capability was KEDE of 1.2. As explained here KEDE has values between 0 and 100. As such KEDE of 1.5 is not spectacular. Moreover, the median is less than 0.5. That means half of the time development capability was very unsatisfactory. One would expect that a core team working with the same technology solving the same problems would accumulate new knowledge and skills through time. That would have manifested itself in much higher kede KEDE of around 10. Ideas on how to improve the capability of their human capital are presented here.
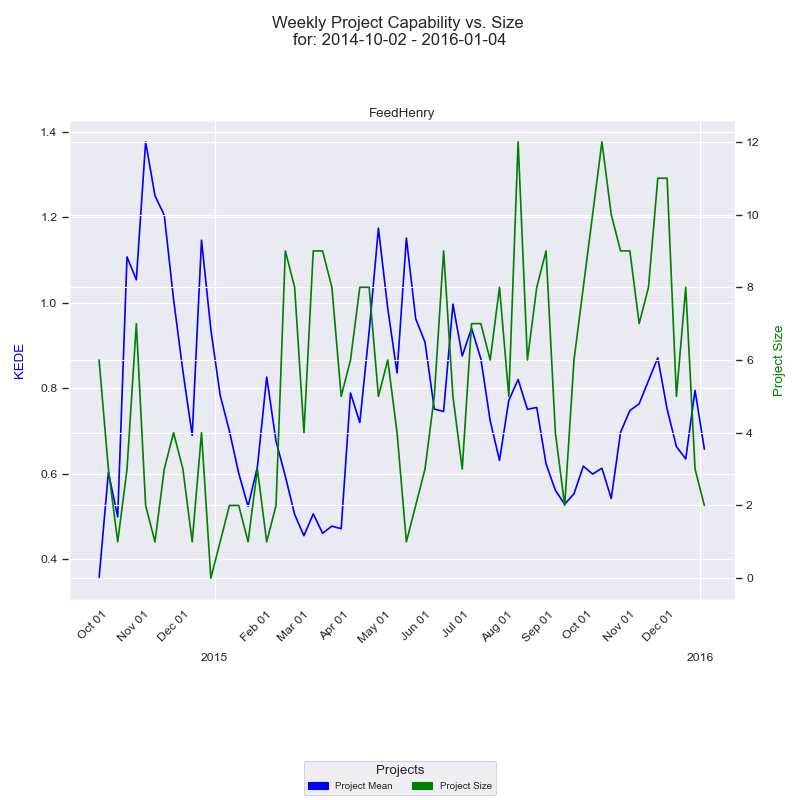
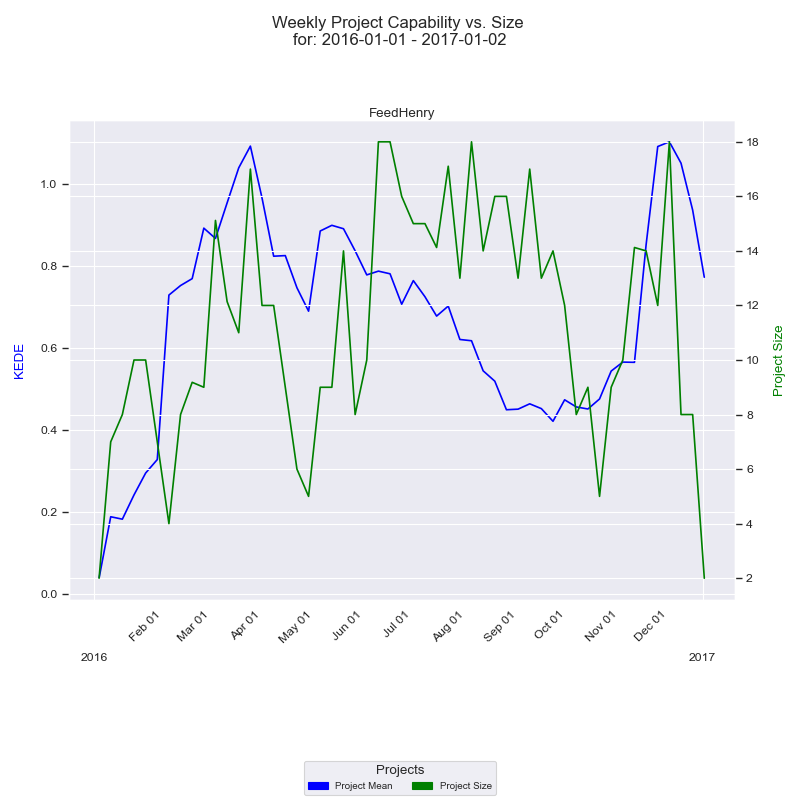
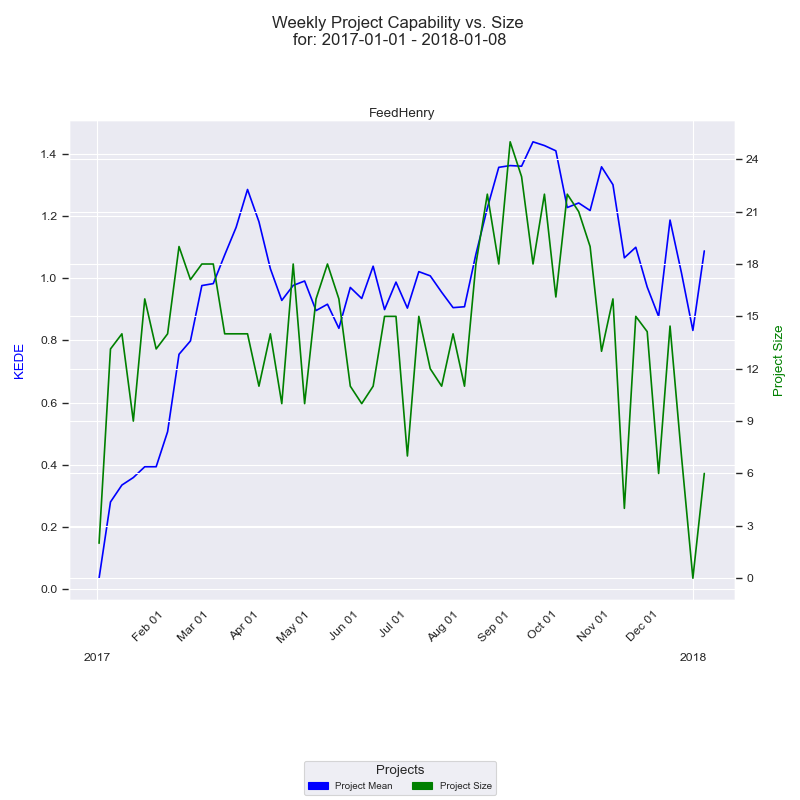
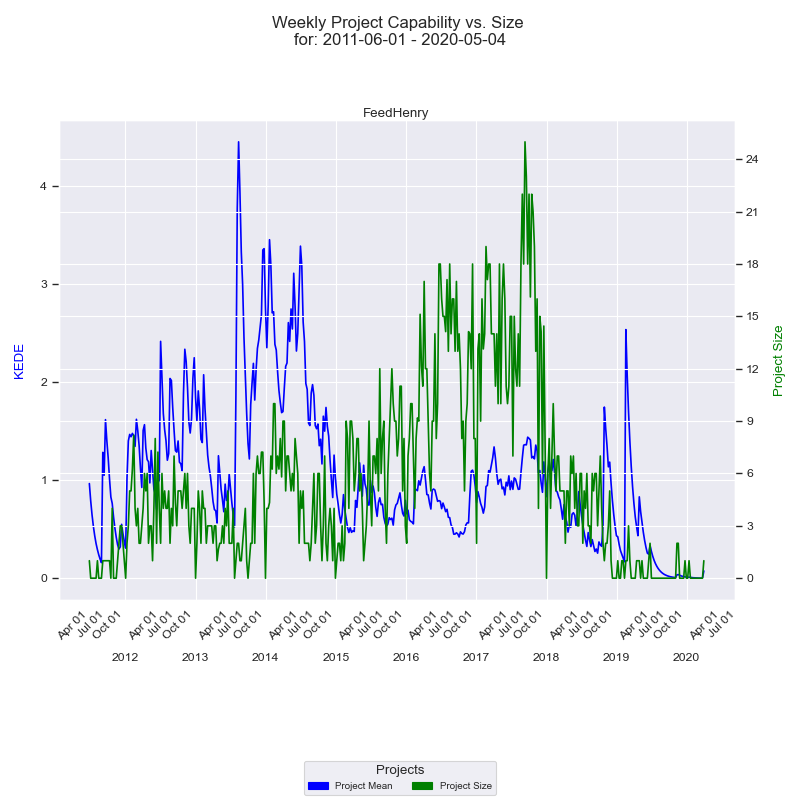
Such a low capability could be the result of constant attrition and involvement of new developers. To check if that's the case we can take a look at the impact project size has had on the development capability. Below is a time series diagram of the impact project size has had on the development capability for the Agile transformation period.
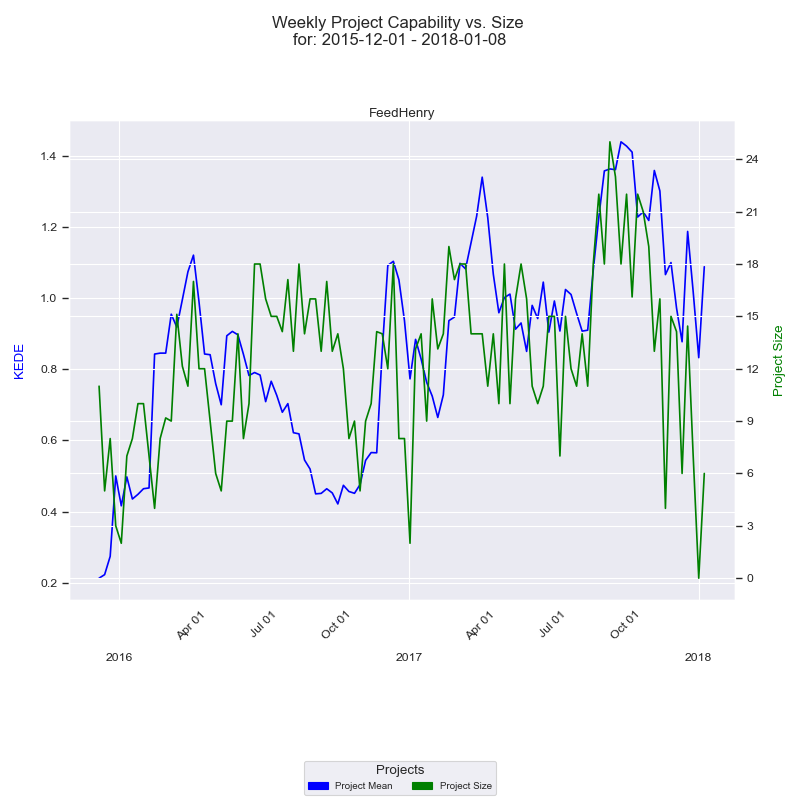
On the x-axis we have the quarter dates. Then we have two y-axises - one for the capability and one for the size of the company. Capability axis is to the left and is in Weekly KEDE values. How capability changes through time is presented by the dark blue line calculated using EWMA. Each point of the blue line is the average Weekly KEDE for all the developers who contributed in that week. Company size axis is to the right and is the number of developers who contributed to FeedHenry in a given week. How project size changed through time is presented by the green line. Each point of the green line is the number of developers who contributed in a given week. How the diagram is constructed is explained here. For the full details on what impact project size has had on the development capability for the whole history of FeedHenry look here.
On Fig. 3 we see that the third quarter of 2016 had the capability dropped almosted to the level when the Agile transformation started. At the same time the number of contributing developers doubled. That may be an instance of Brooks' Law which states that "adding people to a late project makes it later." It is to be expected the new developers will need time to understand the technology and the product. Indeed, in the fourth quarter of 2016 and beyond, the number of contributing developers stabilized and the development capability only increased.
Background
FeedHenry was initially built by a startup of the same name based in Waterford, Ireland. FeedHenry had raised only $9 million since first opening for business in 2010. That came in a single, Series A round in 2013, with participation from Intel Capital, VMWare and others. In September 2014, Red Hat acquired FeedHenry for €63.5 million ($82 million) in cash[6]. By that time FeedHenry employed 65 people in the Waterford region[10].
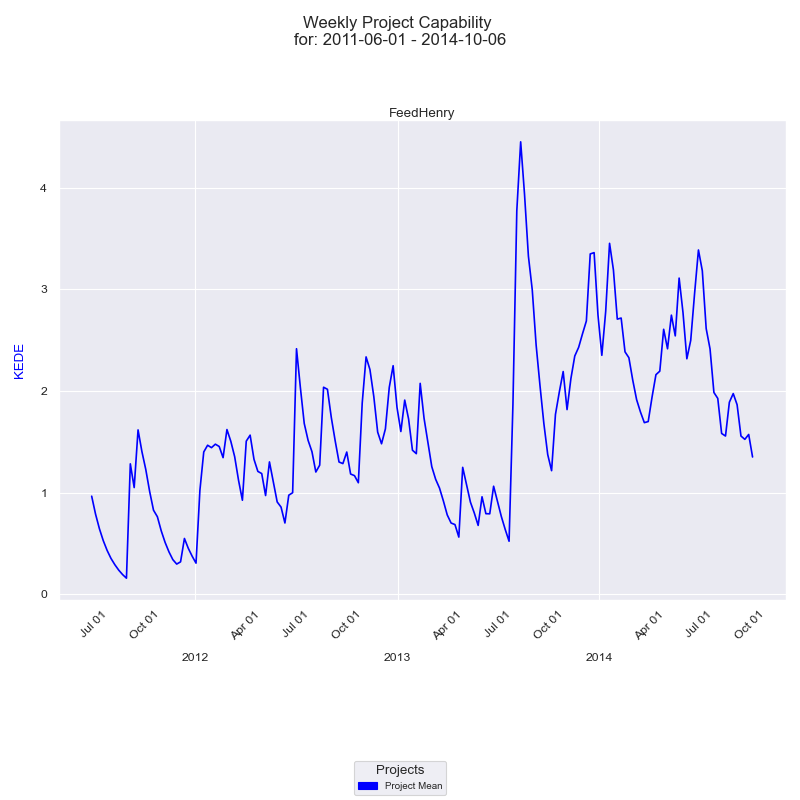
Below is a time-series diagram of the development capability for the period from the movement FeedHenry opened for business until the acquisition by Red Hat.
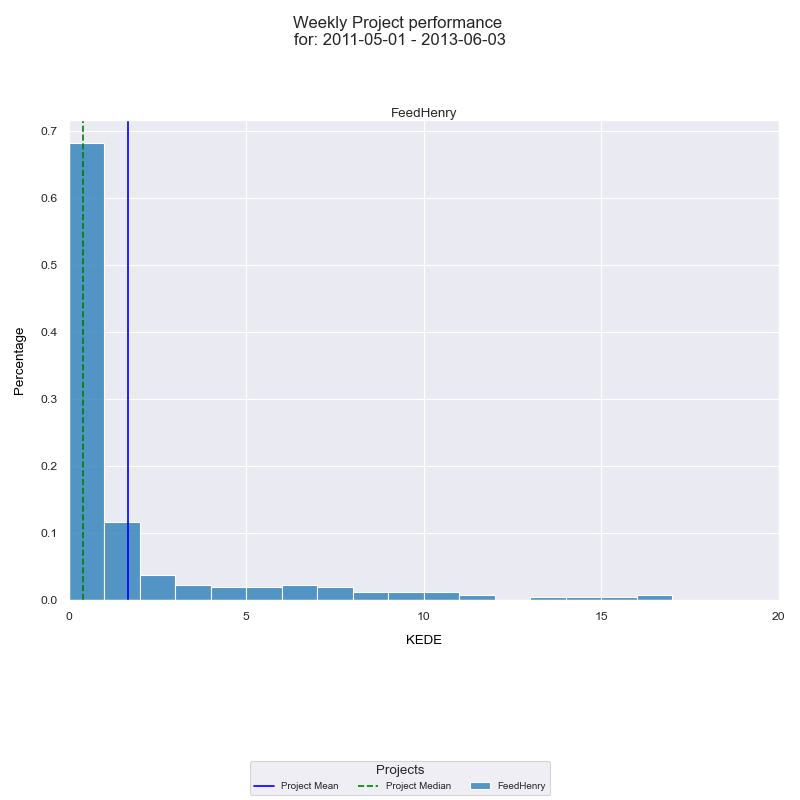
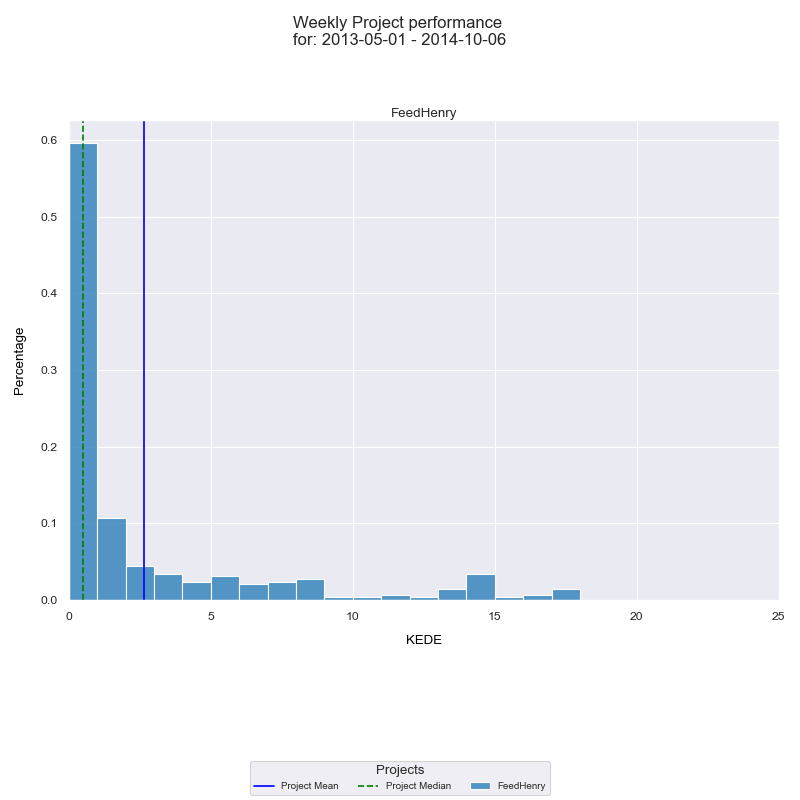
It's very useful to see a histogram.of the underlying frequency distribution. The diagram below presents a histogram of aggregated Weekly KEDE values for the whole pre Red Hat period.

For this whole period they had an average KEDE of a bit more than 2. However, it is visible from Fig. 1 that in mid 2013 their capability jumped. As visible from the histograms below there was a 50% increase in capability - from KEDE less than 2 to almost 3.
What could be the cause for that jump? We have no inside information, but we can look at the below diagram. It is a time series diagram of the impact company size has had on the development capability.
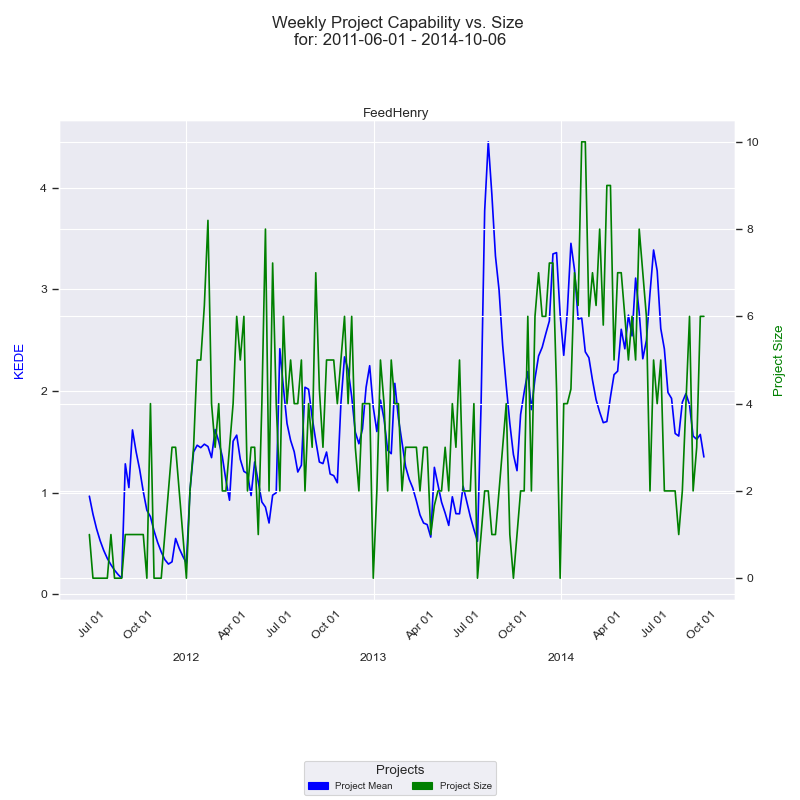
So, what could be the cause for that jump? One reason for the increase in capability could have been the much clearer understanding in the team about what to develop and how to do it. That is supported by the fact that as we see the number of contributing developers doubled but capability didn't decrease as Brooks' Law would suggest. Another reason could be the Series A round and the interest from Red Hat. The developers collaborated much better in discovering the knowledge needed. That is supported by the fact as visible above that KEDE fell towards the acquisition.
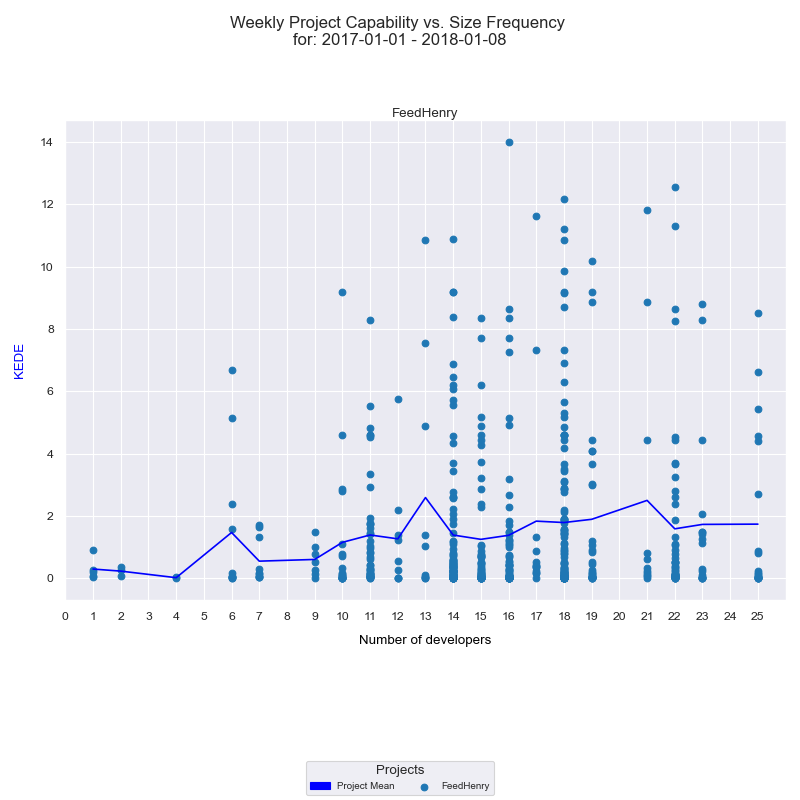
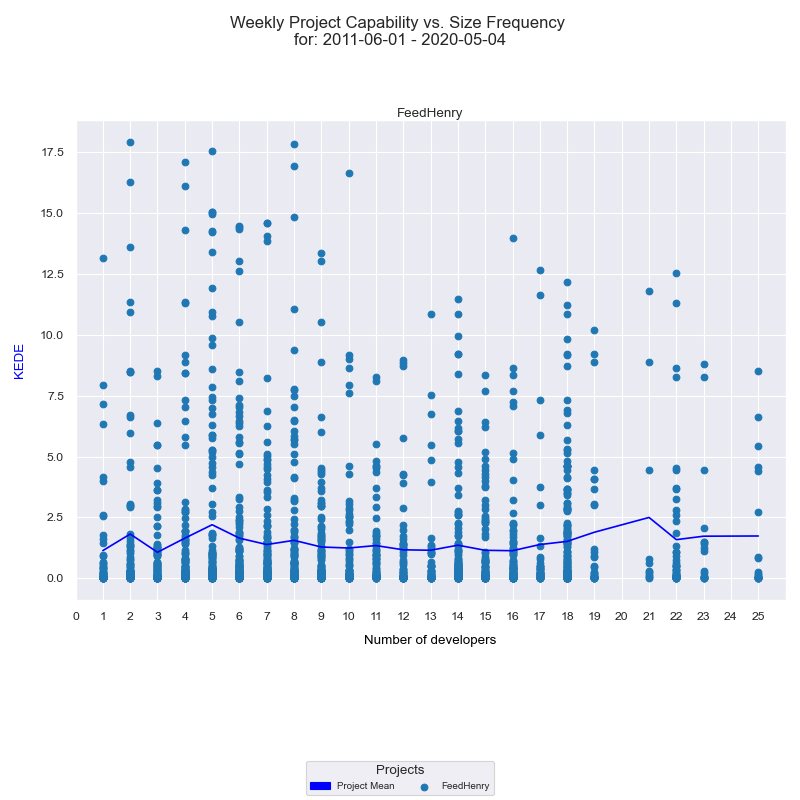
Along with the time series of FeedHenry capability it's very useful to see a frequency diagram of the same data. A frequency distribution shows how often each different value in a set of data occurs. Since a certain size can happen in more than one week we would like to know what would be the average capability for each project size. We have this presented on the diagram below.
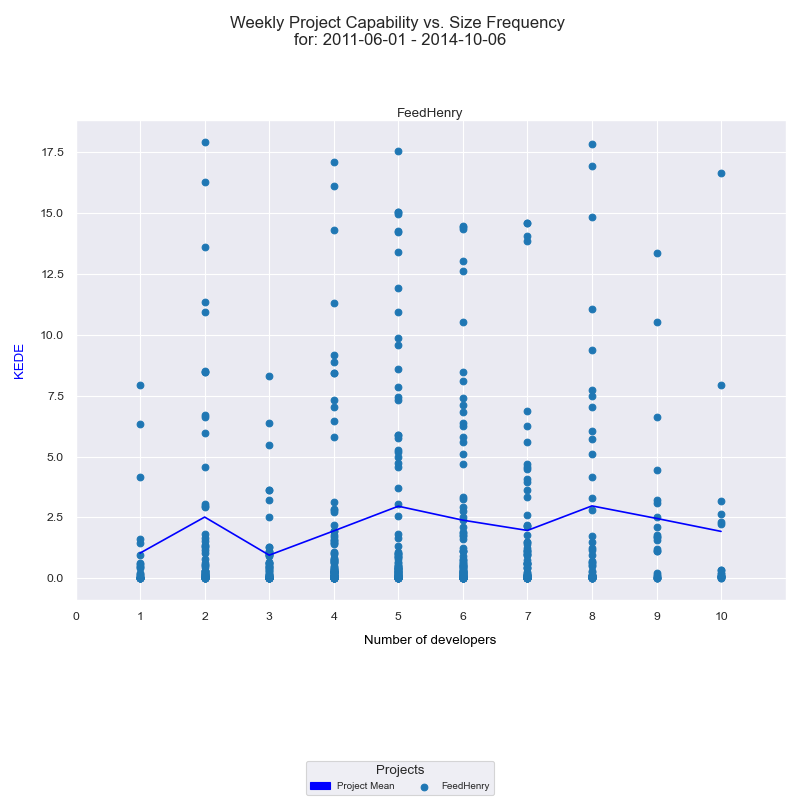
On the x-axis we have the number of developers who contributed to FeedHenry in a given week. On the y-axis we have Weekly KEDE values. Each individual developer's aggregated Weekly KEDE is presented as a light blue dot on the diagram. The dark blue line is the average weekly KEDE for all developers calculated by arithmetic mean. How the diagram is constructed is available here.
Initial state
Following the acquisition, FeedHenry's supported offerings were released under the Red Hat Mobile Application Platform brand. The “FeedHenry” name was retained for releasing related open source projects. Red Hat is THE open source company and in keeping with their philosophy, began the process of open-sourcing the platform. For most of its life, FeedHenry has been a closed-source SaaS product. Therefore the open-sourcing process has been gradual[3].
The initial months of bedding in was very much business as usual for the ex-FeedHenry staff as they still had customer requests and a roadmap to adhere to. Meanwhile several support teams were introduced to assist the FeedHenry team in evolving what the FeedHenry product was and help transition it into the Red Hat Mobile Application Platform (RHMAP). This included a program manager - who acted as a coordinator and integrator and the merging of the existing Red Hat open source mobile (Aerogear project) team into the wider RHMAP team.
On the below diagram we see how for three months capability was preserved at 1.4 KEDE.
The negative effect of adding additional support teams to the development capability is visible above. After that the number of contributing developers doubled. That resulted in the capability collapsing to 0.5 KEDE. Such a drop is expected since the new support teams needed to learn about FeedHenry.
The biggest addition was the access to a more rigorous Quality Engineering (QE) team focused on the creation and maintenance of testing suites, the automation of test execution and the overall quality of the product. This was a huge learning opportunity for both sides that led to the first year being an information exchange, as the FeedHenry team adjusted to life in an open source company with huge support networks available to them. A change here was relinquishing control of areas in which they, as a startup, would have had to upskill in and manage. At the end of the period in Red Hat, dedicated teams were able to take ownership and allow the FeedHenry team to focus on their strengths. They embraced it but equally struggled with leaving the start up mentality behind as visible on Fig. 6 above.
For Red Hat Mobile (RHMAP), 12 months after the acquisition the honeymoon period was well and truly over. The support teams in Red Hat, primarily driven by the QE team, had become well acquainted with the FeedHenry platform and had released small versions of RHMAP to get comfortable with the process.
The first major release under Red Hat's guidance was 3.6. The main focus of this release was the integration of the Aerogear UnifiedPush Server into the platform[11]. It was due to stay in a QE cycle for 20 days. But it took over three months to get that release into shape[3]. As the manager[5] reports, coding was continuous during this cycle, as requirements were changing and the team as a whole found it hard to say no to their loyal customers. The ex-FeedHenry team was well used to working in a very fast manner and would have been well versed in multiple releases a week, turning around features quickly for customers and operating in that frantic start up mentality where every hour of every day matters. At Red Hat it was more or less a waterfall process. QE were finding problems and as they were working downstream from the development waterfall, the cost of change was high and the development fixes were slow due to the passing of time and context shift needed to switch back in and address a bug in a piece of functionality that was worked on several weeks back.
Based on the above description there should have been a decline in development capability. Indeed, we can see that on the time series diagram below. We have Average Weekly KEDE presented for the period from the acquisition by Red Hat until the end of release 3.6.
It shows the same average Weekly KEDE like Fig. 6, but this time without the project size. We see the steady decline in capability.
We have the same data presented as a histogram below.
For the period they had an average Weekly KEDE=1. That is half the KEDE from the startup days. If we take only the last three months it is much lower. As the manager said, such a drop in development capability is explained by the constantly changing requirements and the addition of new people on the team.
The team simply had enough. They now had a reference point and the right motivation to enact positive change. Fundamentally between engineering and QE, they did understand how they could bridge the gap in expectations, yet struggled to move in an Agile direction. That was the point when the coach[4] joined the team to help guide the transition.
Transition to Agile
The FeedHenry team transitioned to Agile slowly. The expectations were well set that the full conversion would be a 12 month project[3].
The coach joined the FeedHenry team in December, 2015 as a ScrumMaster and Senior Software Engineer. It looks like he was a self-taught Agile practitioner since his first Agile training came 6 months later when he became CSPO [4]. The coach spent the first six weeks onboarding with the product and hearing the war stories of the most recent release that caused so much turmoil and heartache. Then the coach began with a single team (out of seven teams). The team was already used to following a very loose interpretation of Scrum, so they stuck with it but the coach started enforcing the Scrum ceremonies and making people aware of the value they can bring. They introduced a Definition of Done that helped bridge the gap in expectations between QE and Engineering with respect to the Quality Assurance (QA) work. That was the pivotal moment where the teams realized that work cannot simply be thrown over the fence[3].
Below we have KEDE presented for the 12-month period of the initial Agile transformation.
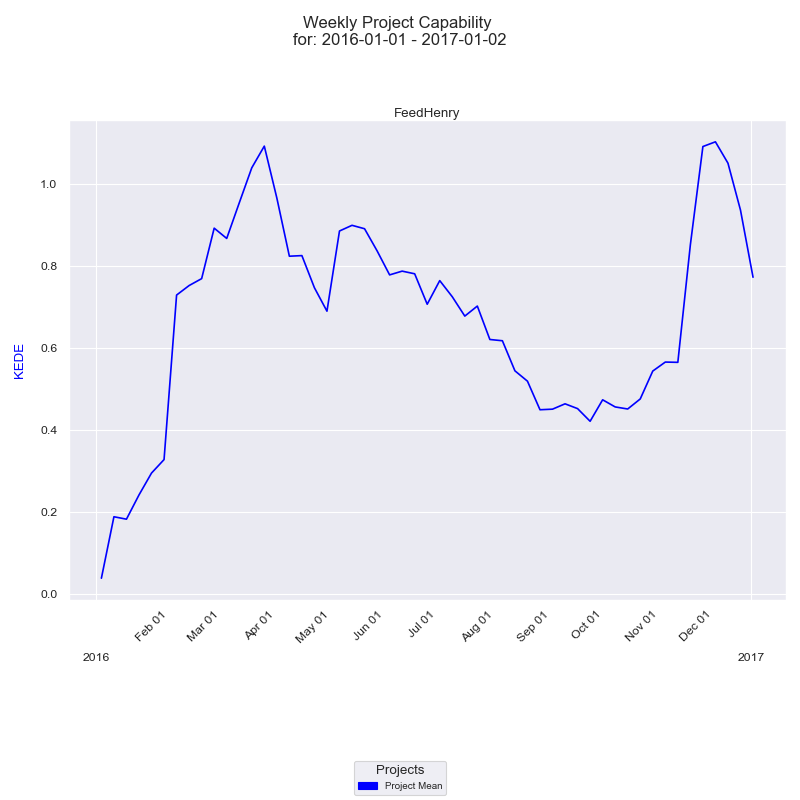
As reported by the coach, over the following weeks and months they saw huge improvements in feature velocity and overall happiness of the team, which helped get the crucial managerial buy-in. That allowed the organization to accelerate its plans, and more teams came on board.
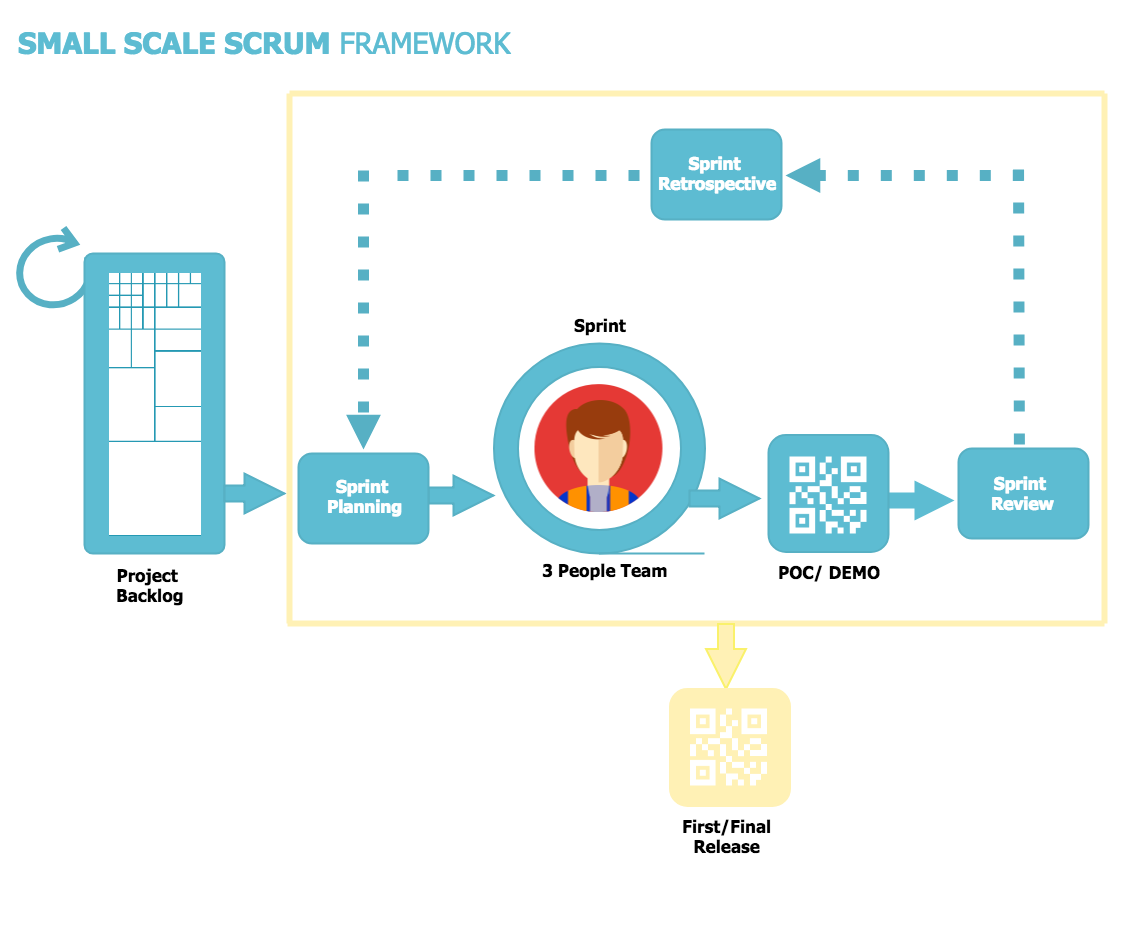
All teams within Red Hat Mobile were following a flavor of an Agile methodology. Most followed a modified Scrum framework and some were Kanban teams. This did not mean the transition was complete; adjustments were required. They implemented a variant of Scaled Scrum to ensure alignment, as the teams would feed enhancements, feature requests and bug fixes into our major releases. This gave them a much better control over releases. Sprints boundaries were tweaked to finish on a Wednesday instead of the traditional Friday because many team members took leave on Fridays, especially when there was a bank holiday, and this badly affected the Scrum events associated with a sprint end. Three week sprints were adopted so they could more easily account for outside influences, unexpected staff absence, external meetings and effectively become more reactive to customers' needs. On a weekly basis, they saw an increase in velocity.
The diagram below shows how the capability was affected by the number of contributing developers.
We see that the increase in headcount negatively affected capability. That would mean the increase in features velocity was due to the increase in the headcount and not the increase in development capability.
On the below histogram we see the average KEDE for the organization a bit better compared with the waterfall days. For this period they had an average KEDE=1.1. That can be attributed to the introduction of Definition of Done and the other Scrum practices.
Small Scale Scrum
12 months after introducing Agile, the manager and the coach decided that the transition to Agile had reached a level of
maturity in all seven teams.
So they decided to try it in small dynamic teams.
As per the manager the team adopted “Small Scale Scrum”[7].
Below we have KEDE presented for the period of the team being Agile by using “Small Scale Scrum”. For this period they had an average KEDE = 1.2.
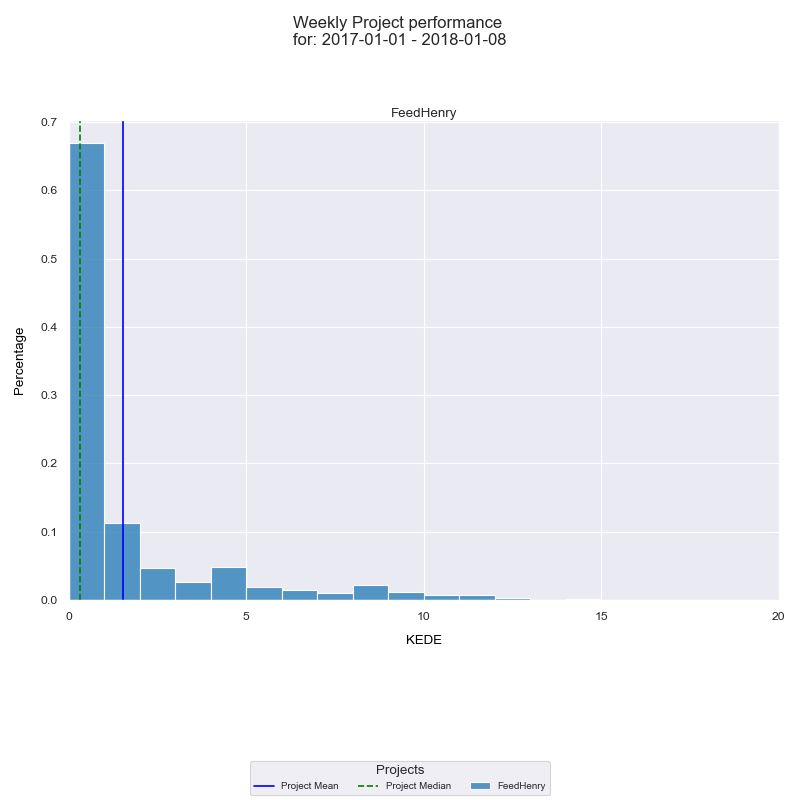
We see the average KEDE for the organization was 20% higher than the KEDE from the previous period. Actually the team got back to the knowledge discovery efficiency from the good old startup days.
Below is the time series for the period. Visibly they had no major ups and downs in their capability.
The relationship between capability and the number of contributing developers is presented on the diagram below.
It is visible that to the end of the period when the team had 21 different developers contributing their capability was not negatively affected. 12 contributing developers was actually the most capable team size as visible on the frequency diagram below.
The happiness level i.e. how close developers were to the psychological state of Flow is presented on the diagram below.
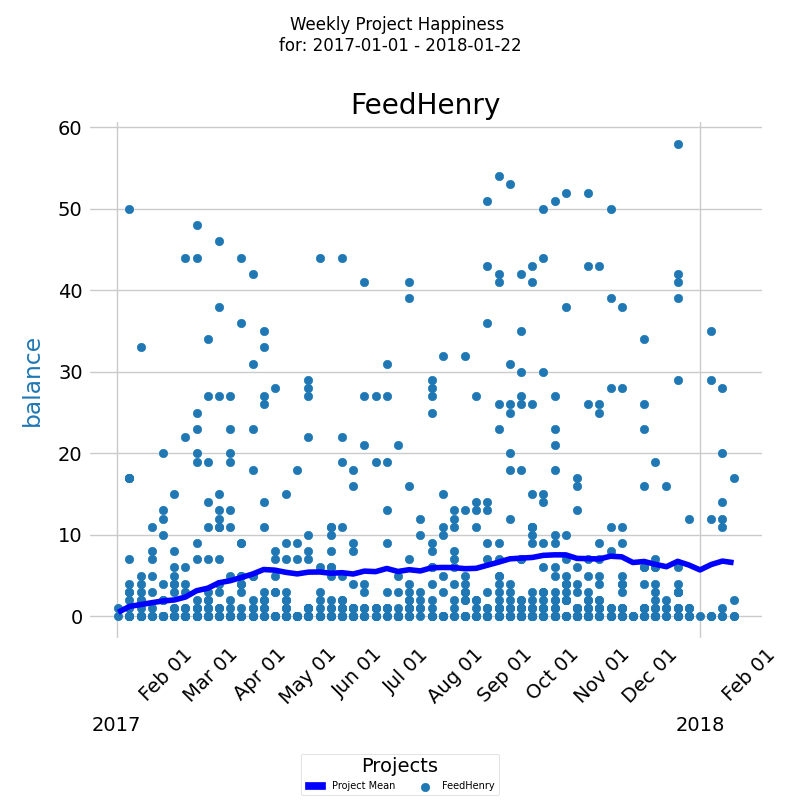
This diagram presents a time series of Happiness levels for a company over a given period. On the x-axis, the diagram displays the week dates, while on the y-axis, it shows the Happiness levels. Each colored dot represents an individual developer's Happiness level, and the blue line represents the average Happiness level for all developers.
The manager and the coach broke information and skill silos and cross-skilled the teams to allow them take a more holistic view on team composition. They started to assemble the right skills for the right job. Notwithstanding the headaches of timing issues for when to start and stop efforts, they started to see the real potential of the overall team. Features were shipped faster, the team was more engaging and more reactive to customers than ever. The small tweaks, spread over a long time, helped the team transition from a variation of Agile to actually being Agile in both thought and action.
End of FeedHenry
Red Hat Mobile Application Platform development and support concluded on December 31, 2019 with Red Hat Mobile Application Platform 4.x and Red Hat Mobile Application Platform Hosted[2]. Red Hat continues to develop mobile services under the AeroGear project and those services are on the feature roadmap for Red Hat Managed Integration. FeedHenry is still available as an open source project.
On the below diagram we see all three periods in the life of FeedHenry.
The initial startup period up to 2015, the active Red Hat period up to 2019 and then the keep-the-lights-on period which concludes in 2020. The knowledge discovery efficiency (KEDE) is different in each of the periods. It was higher during the startup period and recovered a bit when the team became Agile.
Below is the KEDE histogram for the whole life of FeedHenry.
Average KEDE is at 1.5. That points to a very low development capability during the days after the Red Hat acquisition.
The negative effect of adding additional support teams to the development capability is visible below. The Agile period however, mitigate the negative effect.
The effect the Agile transformation had is visible on the frequency diagram below.
The most capable team size was 21 at the peak of Small Scale Scrum implementation.
Conclusion
In the past it was argued that the physician's touch captured information richer than any tool. The present day attitude toward measuring knowledge work productivity very much resembles how temperature was understood 400 years ago[14]. It is argued that the manager's touch captures information richer than any tool. However, we don't agree. It is time to start measuring the productivity of knowledge work by its essence, which is the acquisition and application of knowledge.
Today physicians use a thermometer in order to get an understanding about what is going on inside the black box that is a human organism. Managers and decision-makers , who want to unleash the untapped potential in their organization, can use KEDEHub to get visibility into the black box that is an organization developing software with our scientific and non-intrusive method.
By acquiring a deeper understanding about how efficient the knowledge discovery process is we can tell if there are constantly changing requirements, a mismatch between skills applied and the work requested, a broken communication with the business etc.
That is what the one and only scientifically based metric - knowledge discovery efficiency (KEDE) is used for! KEDE allows us to objectively and scientifically answer: How has the latest Agile transformation contributed to the efficiency of an organization's software development capability?
As explained here individual KEDE is a function of processes and policies of the organization the software developer works in. Even though KEDE is objective and scientifically based you should not rely only on it. There are cases where KEDE alone is not sufficient to understand how knowledge discovery happens inside the organization. Very often you'd need a closer look inside the black box and take into account the white box. The white box goes beyond the numbers and gets into how the organization produced the numbers.
Appendix A: Methodology
We have included repositories that are exclusively hosted on GitHub for this release of the report. Repositories that have been forked from other repositories have been excluded from our analysis such that some genuine development activities may not have been included. Some projects may be affected more than others. In this report, we have included activity not only of the main branch, but also of all other branches. Hence commits that have not yet reached the main branch or are for any reason kept out from the main branch have been included.
List of analyzed repositories:
- https://github.com/feedhenry/Node.js-Smoke-Test-App.git
- https://github.com/feedhenry/vmcjs.git
- https://github.com/feedhenry/FHActProxy.git
- https://github.com/feedhenry/fh-fhc.git
- https://github.com/feedhenry/fhc-studio.git
- https://github.com/feedhenry/fh-ios-sdk.git
- https://github.com/feedhenry/HP-JQM-Demo.git
- https://github.com/feedhenry/monitjs.git
- https://github.com/feedhenry/AppForms-Template.git
- https://github.com/feedhenry/openstack-storage.git
- https://github.com/feedhenry/fh-android-sdk.git
- https://github.com/feedhenry/websocket-demo-java.git
- https://github.com/feedhenry/fh-js-sdk.git
- https://github.com/feedhenry/psjson.git
- https://github.com/feedhenry/nodejs-adventure.git
- https://github.com/feedhenry/fh-streamer.git
- https://github.com/feedhenry/FeedHenryApiTester.git
- https://github.com/feedhenry/fh-connect.git
- https://github.com/feedhenry/fh-sync-integrations.git
- https://github.com/feedhenry/Basic-App.git
- https://github.com/feedhenry/monkeytalk-test-app.git
- https://github.com/feedhenry/fh-android-sdk-blank-app.git
- https://github.com/feedhenry/fh-ios-sdk-blank-app.git
- https://github.com/feedhenry/appforms-project-client.git
- https://github.com/feedhenry/turbo.git
- https://github.com/feedhenry/fh-basic-webapp-blank-app.git
- https://github.com/feedhenry/fh-template-apps.git
- https://github.com/feedhenry/welcome-currentgui.git
- https://github.com/feedhenry/fh-advanced-webapp-blank-app.git
- https://github.com/feedhenry/fh-dotnet-sdk.git
- https://github.com/feedhenry/fh-cordova-plugin-ftputil.git
- https://github.com/feedhenry/fh-cordova-plugin-monkeytalk.git
- https://github.com/feedhenry/fh-cordova-plugin-orientation.git
- https://github.com/feedhenry/fh-cordova-plugin-stream.git
- https://github.com/feedhenry/fh-cordova-plugin-webview.git
- https://github.com/feedhenry/fh-basichybrid-plugins.git
- https://github.com/feedhenry/fh-appform-form-templates.git
- https://github.com/feedhenry/fh-appform-theme-templates.git
- https://github.com/feedhenry/fh-cordova-plugin-apkdownloader.git
- https://github.com/feedhenry/fh-cordova-plugin-external-storage.git
- https://github.com/feedhenry/fh-cordova-plugin-sms.git
- https://github.com/feedhenry/fh-cordova-plugin-device.git
- https://github.com/feedhenry/Custom-Forms-App.git
- https://github.com/feedhenry/js-security-rhino.git
- https://github.com/feedhenry/mcms.git
- https://github.com/feedhenry/fh-windowsphone-sdk-blank-app.git
- https://github.com/feedhenry/fh-xamarin-sdk-blank-app.git
- https://github.com/feedhenry/geoip.git
- https://github.com/feedhenry/appforms-integration-client.git
- https://github.com/feedhenry/appforms-integration-cloud.git
- https://github.com/feedhenry/gitlab-shell-client.git
- https://github.com/feedhenry/node-jolokia.git
- https://github.com/feedhenry/rhcjs.git
- https://github.com/feedhenry/fh-internal-stats.git
- https://github.com/feedhenry/fh-ios-swift-sdk.git
- https://github.com/feedhenry/fh-android-sdk-repository.git
- https://github.com/feedhenry/fh-logger.git
- https://github.com/feedhenry/fh-cluster.git
- https://github.com/feedhenry/grunt-fh-build.git
- https://github.com/feedhenry/Appforms-Template-v3.git
- https://github.com/feedhenry/mbaas-monitoring.git
- https://github.com/feedhenry/sendEmail-rpm.git
- https://github.com/feedhenry/testing-cloud-app.git
- https://github.com/feedhenry/fh-filesystem-api.git
- https://github.com/feedhenry/openshift-template-tool.git
- https://github.com/feedhenry/fh-statsc.git
- https://github.com/feedhenry/fh-mbaas-client.git
- https://github.com/feedhenry/fh-amqp-js.git
- https://github.com/feedhenry/fh-reportingclient.git
- https://github.com/feedhenry/fh-security.git
- https://github.com/feedhenry/fh-mbaas-express.git
- https://github.com/feedhenry/fh-mbaas-api.git
- https://github.com/feedhenry/fh-system-dump-tool.git
- https://github.com/feedhenry/nagios-container.git
- https://github.com/feedhenry/fh-db.git
- https://github.com/feedhenry/fh-build.git
- https://github.com/feedhenry/users-api.git
- https://github.com/feedhenry/rhm.git
- https://github.com/feedhenry/fh-cup.git
- https://github.com/feedhenry/fh-sdk-api-test-app.git
- https://github.com/feedhenry/fh-config.git
- https://github.com/feedhenry/fh-metrics-client.git
- https://github.com/feedhenry/fh-component-metrics.git
- https://github.com/feedhenry/negotiator.git
- https://github.com/feedhenry/fh-gridfs.git
- https://github.com/feedhenry/fh-messaging-client.git
- https://github.com/feedhenry/fh-service-auth.git
- https://github.com/feedhenry/fh-stats.git
- https://github.com/feedhenry/fh-messaging.git
- https://github.com/feedhenry/fh-mbaas.git
- https://github.com/feedhenry/fh-forms.git
- https://github.com/feedhenry/fh-mbaas-middleware.git
- https://github.com/feedhenry/fh-openshift-templates.git
- https://github.com/feedhenry/sample-jenkins-pipeline.git
- https://github.com/feedhenry/feedhenry.github.io
- https://github.com/feedhenry/fh-dataman.git
- https://github.com/feedhenry/wendy-jenkins-s2i-configuration.git
- https://github.com/feedhenry/wildcard_proxy.git
- https://github.com/feedhenry/feedhenry-sdk-docs.git
- https://github.com/feedhenry/sync-acceptance-testing.git
- https://github.com/feedhenry/load-runner.git
- https://github.com/feedhenry/nodeschool.git
- https://github.com/feedhenry/rhmap-push-test-driver.git
- https://github.com/feedhenry/rhmap-push-test-cloud-app.git
- https://github.com/feedhenry/jenkins-plugin-install.git
- https://github.com/feedhenry/sync-metrics-openshift.git
- https://github.com/feedhenry/fh-pipeline-library.git
- https://github.com/feedhenry/snapscreen.git
- https://github.com/feedhenry/tag_instances.git
- https://github.com/feedhenry/fh-sync.git
- https://github.com/feedhenry/wit-docker-example.git
- https://github.com/feedhenry/fh-sync-js.git"
- https://github.com/feedhenry/buildfarm-installer.git
- https://github.com/feedhenry/git-tutorial.git
- https://github.com/feedhenry/mcp-web-poc.git"
- https://github.com/feedhenry/fh-sync-server.git
- https://github.com/feedhenry/mobile-apiserver.git
- https://github.com/feedhenry/mcp-openshift-ui-extension.git
- https://github.com/feedhenry/mobile-control-panel.git
- https://github.com/feedhenry/mobile-security.git
- https://github.com/feedhenry/fh-sync-android.git
- https://github.com/feedhenry/mcp-standalone.git
- https://github.com/feedhenry/student-help-guide.git
- https://github.com/feedhenry/fh-cachekey-client.git
- https://github.com/feedhenry/fh-millicore-client.git
- https://github.com/feedhenry/fh-aaa-client.git
- https://github.com/feedhenry/mobile-security-android-template.git
- https://github.com/feedhenry/fh-mobile-core-js.git
- https://github.com/feedhenry/mobile-security-ios-template.git
- https://github.com/feedhenry/keycloak-prometheus.git
- https://github.com/feedhenry/student-help-guide-content.git
- https://github.com/feedhenry/fh-sync-ios.git
- https://github.com/feedhenry/rhmap-backups.git
- https://github.com/feedhenry/mobile-security-cordova-template.git
- https://github.com/feedhenry/minishift-install-rhmap.git
- https://github.com/feedhenry/onboarding-cloud-services.git"
References
4. LinkedIn profile of Leigh Griffin, PhD
5. LinkedIn profile of Brendan O'Farrell
6. Red Hat Buys FeedHenry For $82M To Add Mobile App Development To Its Platform
Getting started


