The Learning Curve: A Leading Indicator
When Managing Software Development Projects
Introduction
Knowledge is the core resource in software development, acting as the fuel that drives the engine of development. The true nature of software development is a progression from initial ideas to a comprehensive understanding embodies in a finished product ready for deliver Essentially, software development is a process of continuous knowledge accumulation.
The learning curve shows the rate of knowledge accumulation about "what to do" and "how to do it" in order to deliver working software.
The learning curve serves as a leading indicator for project predictability by measuring the rate of knowledge acquisition, enabling proactive management of potential issues and alignment with project expectations.
Unlike traditional metrics such as throughput and lead time, which are only measurable after work items are completed and delivered, the shape of the learning curve becomes visible just a few weeks into the project. This early visibility allows managers to anticipate problems well before any deliverables are affected. By comparing the knowledge acquisition of the current project's team with that of teams from similar past projects, we can gauge how closely the process aligns with our expectations
If a team is not acquiring knowledge at an expected rate, it may indicate underlying issues within the project. Conversely, if a team acquires the necessary knowledge at the expected rate, the process is considered predictable.
This article not only addresses the theoretical aspects of learning curves in project management but also provides practical strategies for their implementation. By analyzing and comparing learning curves from past projects, project managers can gain invaluable insights into potential issues and areas for intervention in current projects. We outline a comprehensive strategy for establishing and utilizing learning curves, including the selection of reference classes, benchmarking, and actionable steps post-benchmarking.
The advantages of this approach are significant, encompassing enhanced project monitoring, preemptive troubleshooting, informed decision-making, cost reductions, and minimized wastage. Visualizing learning curves helps identify patterns of swift knowledge gains, as well as periods of stagnation or decline.
Learning Curve in Software Development Projects
"All software is simply a representation of knowledge and it is the acquisition of this knowledge that is the real activity of software development." ~ Phillip Glen Armour [1]
Traditional methods for monitoring the progress of new technology development tend to fall short due to their focus on lagging indicators. These indicators, such as velocity, throughput, and lead time for newly developed features, user stories, and components, often overlook the crucial aspect of knowledge acquisition in software development. Recognizing this gap, our approach marks a significant paradigm shift towards a knowledge-centric perspective in managing software development projects. We utilize the learning curve as a key metric, moving beyond conventional metrics to capture the essence of knowledge growth and application within project teams.
A learning curve represents the rate at which knowledge and proficiency are acquired over time in a project or learning environment[2]. In the context of software development projects, learning curves are particularly important due to the rapid evolution of technologies and methodologies.
In economics, learning curves often relate to production efficiency, showing how costs decrease as cumulative production experience increases. In software development, while the focus is on knowledge acquisition, similar principles apply – as more knowledge is gained, the team's efficiency and productivity typically improve.
To effectively establish learning curves, we utilize the Cumulative Growth Rate (CR) of knowledge discovered. CR quantifies the rate of knowledge acquisition over time, calculated using log returns, which measure the relative growth in knowledge between two time points. Importantly, CR effectively normalizes growth by taking into account variations in project sizes, durations, and initial knowledge levels. This normalization makes CR a relative measure, enabling fair and equitable comparisons across diverse projects.
Application in Project Management
Project managers are encouraged to use the learning curve of their current project as a benchmark against a reference class of past similar projects. Since the main challenges are related to lack of knowledge, by observing how the current project's team acquires knowledge compared to teams from past projects, managers can identify early signs of potential issues. If a team is not acquiring knowledge at an expected rate, it may indicate underlying problems within the project. This insight allows managers to investigate and address the root causes proactively.
We will be using the approach from Reference Class Forecasting (RCF). Reference Class Forecasting is an estimation technique based on the idea of using historical data from similar projects, or a "reference class," to predict the outcomes of a current project. Developed by Daniel Kahneman and Amos Tversky as part of their work on decision-making and cognitive biases, RCF aims to reduce the influence of optimism bias and planning fallacy on project estimates[3].
Implementation Strategy for Learning Curve Analysis
- Identify a Suitable Reference Class: Select past projects that are similar to the current project to serve as a reference class. When determining similarity, consider factors that impact knowledge acquisition and project complexity, such as gaps in understanding, client type, team structure, and business domain expertise.
- Collect Historical Data: Collect historical data from past projects, including the knowledge discovered at each time point. For each project, calculate the cumulative growth rate of knowledge discovered over time. Compare the learning curves for all projects in the reference class using statistical methods and visual inspection. Employ Dynamic Time Warping (DTW) as the primary statistical method. DTW measures the similarity between two time series by minimizing the distance between their points, allowing for non-linear time alignment. A smaller DTW distance between two curves indicates a higher degree of similarity. This method is particularly beneficial when the curves have similar shapes but are misaligned in time or exhibit different progression speeds.
- Establish Baseline: Examine the learning curves of the reference projects to gain insights into the learning and problem-solving activities likely to occur in your project. This analysis will provide a baseline learning curve, which will be used to anticipate the expected learning trajectory of the new project.
- Benchmark New Development: As the new project progresses, benchmark the actual learning curve against the baseline learning curve from similar past projects. This process, involving the same statistical methods (DTW) and visual inspection used in reference class establishment, allows for early identification of deviations from expected learning rate. Such benchmarking is crucial for recognizing and addressing potential issues well before the testing and deployment phases of the new features.
Benchmarking the learning curve is key to early identification of potential issues and their root causes in areas where the learning rate lags behind expectations. It enables early interventions such as:
- Targeted Training: Focused training efforts to address specific knowledge gaps.
- Addressing the Mismatch Between Capabilities and Challenges: Reallocation of developers to optimize learning and talent utilization.
- Collaboration Improvement: Process improvements to enhance knowledge transfer and sharing.
- Shortening feedback loops: Shortening feedback loops to accelerate learning and problem-solving.
- Reducing rework: Reducing rework by addressing knowledge gaps early on.
- Reducing Multitasking: Reducing multitasking to improve focus and knowledge retention.
Expected Benefits
- Enhanced Project Oversight: By anticipating potential risks and deviations, project managers can maintain a proactive stance, ensuring better control over the project's trajectory.
- Proactive Issue Resolution: With the ability to foresee potential risks and deviations from the expected learning curve, the organization can take proactive measures to address issues before they escalate.
- Data-Driven Decision Making: The use of empirical data from similar past projects empowers managers to make decisions based on solid evidence, rather than intuition or guesswork, leading to more controlled and predictable project outcomes.
- Cost Savings Early identification of potential issues allows for cost-effective solutions, minimizing the need for expensive corrective measures later in the project.
- Waste Reduction: Proactive management helps in minimizing the waste of resources, including time, manpower, and materials, thereby enhancing overall project efficiency.
Case Study
Visualizing the learning curve is a crucial step in understanding the dynamics of knowledge acquisition within a project. This visualization typically involves plotting the rate of knowledge acquisition over time, which can highlight various patterns:
- Rapid Learning Phases: Periods where knowledge acquisition is accelerated.
- Plateaus: Times when the rate of learning stabilizes.
- Declines in Learning Rates: Phases where the pace of knowledge acquisition slows down.
The below diagram provides a comparative view of learning curves.
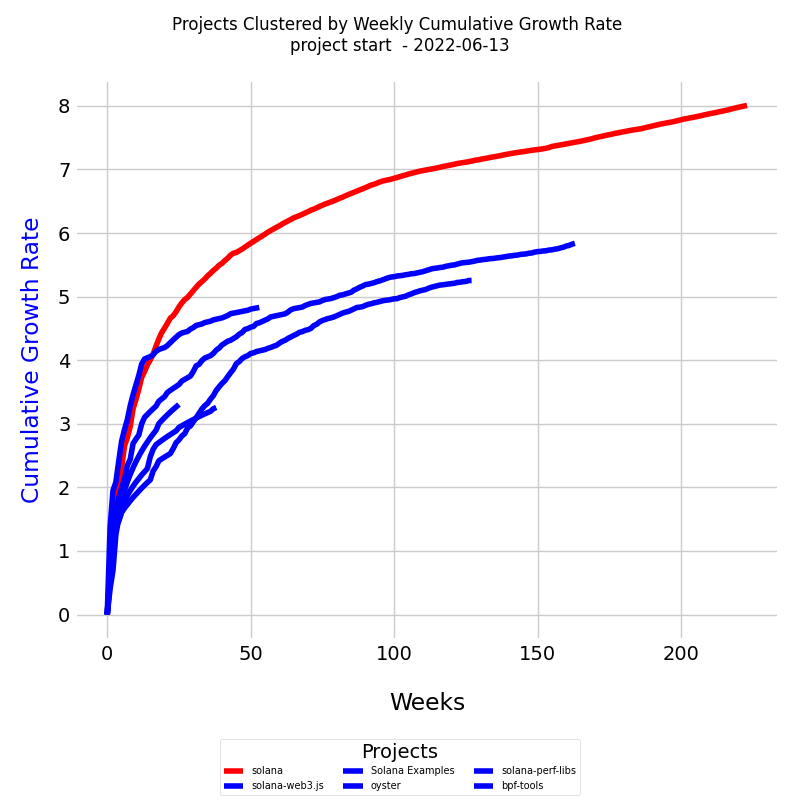
Each line traces the cumulative growth rate for its respective project over the specified period.
- Reference Class Curves (in Blue): These curves represent the learning trajectories of similar past projects. They serve as a benchmark for expected knowledge growth.
- New Project Curve (in Red): This curve illustrates the learning rate of the current project.
- Axes Interpretation: The x-axis of the diagram represents the timeline, measured in weeks, while the y-axis indicates the cumulative growth rate (CR).
- Dates: Each learning curve starts at the project's inception and continues to the specified end date.
In this example, we observe that the CR of the new project is not aligning with the trend seen in the reference class. This discrepancy suggests potential areas within the new project that may require closer examination and intervention.
Unlike traditional metrics such as throughput and lead time, which are only measurable after work items are completed and delivered, the shape of the learning curve becomes visible just a few weeks into the project. This early visibility allows managers to anticipate problems well before any deliverables are affected. By comparing the knowledge acquisition of the current project's team with that of teams from similar past projects, we can gauge how closely the process aligns with our expectations
Conclusion
In software development, where projects often involve complex and rapidly changing technologies, learning curves are vital for effective project management. These curves provide insights into how effectively a team is adapting to new technologies and challenges, guiding decisions on training, resource allocation, and project planning.
Our approach synthesizes elements from agile methodologies and traditional project management, all supported by empirical evidence from the field of software development. This fusion creates a robust method for project management, one that is adaptable, insightful, and grounded in real-world experiences.
Works Cited
1. Armour, P.G. (2003). The Laws of Software Process, Auerbach
2. L. B.S. Raccoon. 1996. A learning curve primer for software engineers. SIGSOFT Softw. Eng. Notes 21, 1 (Jan 1 1996), 77–86. https://doi.org/10.1145/381790.381805
3. Lovallo, D., and Kahneman, D. (2003), "Delusions of Success: How Optimism Undermines Executives' Decisions", Harvard Business Review, July, 56-63.
How to cite:
Bakardzhiev D.V. (2023) The Learning Curve: A Leading Indicator In Managing Software Development Projects. https://docs.kedehub.io/kede-manage/kede-leading-indicator.html
Getting started


