How to avoid outsourcing pitfalls
A Knowledge-centric approach
Outsourcing pitfalls explained
Global demand for software development talent has never been so high. Consequently, software outsourcing is among the fastest-growing industries — and it's the future. While trust forms the bedrock of any relationship, in the business of outsourcing software development, it's critical to recognize where blind spots may exist. It's not just about trust; it's about aligning motivations. Thus, the question is not if to outsource, but how to avoid outsourcing pitfalls? Principal Agent Theory has a few things to say about it.
The Principal Agent Theory provides a lens through which we can view the complex relationship between companies and their software outsourcing vendors. The theory, which has been around since the 1970s, dives deep into the challenges faced by principals who rely heavily on their agents, to achieve desired outcomes:
- The agent has an advantage due to incomplete and asymmetric information and monitoring costs. The smaller the ability to control the agent's activity (i.e., the bigger the information asymmetry), the bigger is the principal's uncertainty.
- There is a divergence of interests i.e. the agent shows opportunistic behavior to maximize their own expected profit instead of acting in line with the goals of the principal. The three types of opportunistic behavior are hidden characteristics (the abilities and skills of the agent are not "common knowledge"), hidden intention (agent has goals and interests not known by the principal) and hidden action (principal cannot fully control the agent's actions).
In software development outsourcing the vendor is the agent and the client, represented by the CTO, is the principal.
Imagine this - the CTO is at the top, then the outsourcing vendor, and then their developers. But there's an inherent power shift: while the CTO invests resources and assumes risks, the developers, operating at the granular level, hold most of the day-to-day information, creating a potential for misaligned interests.
Before the start of the interaction (ex ante), the CTO cannot fully judge:
- The vendor's "quality" (hidden characteristics) indicated by historical productivity, quality of people, retention rate.
- The plans of the outsourcing vendor and each of the team members (hidden intentions) if and how to maximize their own profit.
After the vendor have started the work (ex post), the CTO cannot control:
- The activities undertaken by the vendor and their developers (hidden actions). The vendor has an opportunity to utilize its information advantage and to maximize his profit e.g. through working less than expected, unnecessarily high budgets
The information asymmetry can give rise to hidden actions and intentions: developers perhaps not working as efficiently as they could, the outsourcing vendor not acknowledging underperformers, or even worse, intentional over-estimations of budgets and timeframes.
The problem is manifested by undesirable effects like double booking, bait and switch, working less than expected, unnecessarily high budgets. overemployment and not enough work.
The end result for the client is low productivity of software development.
On the diagram below we have the problem of low productivity outlined.
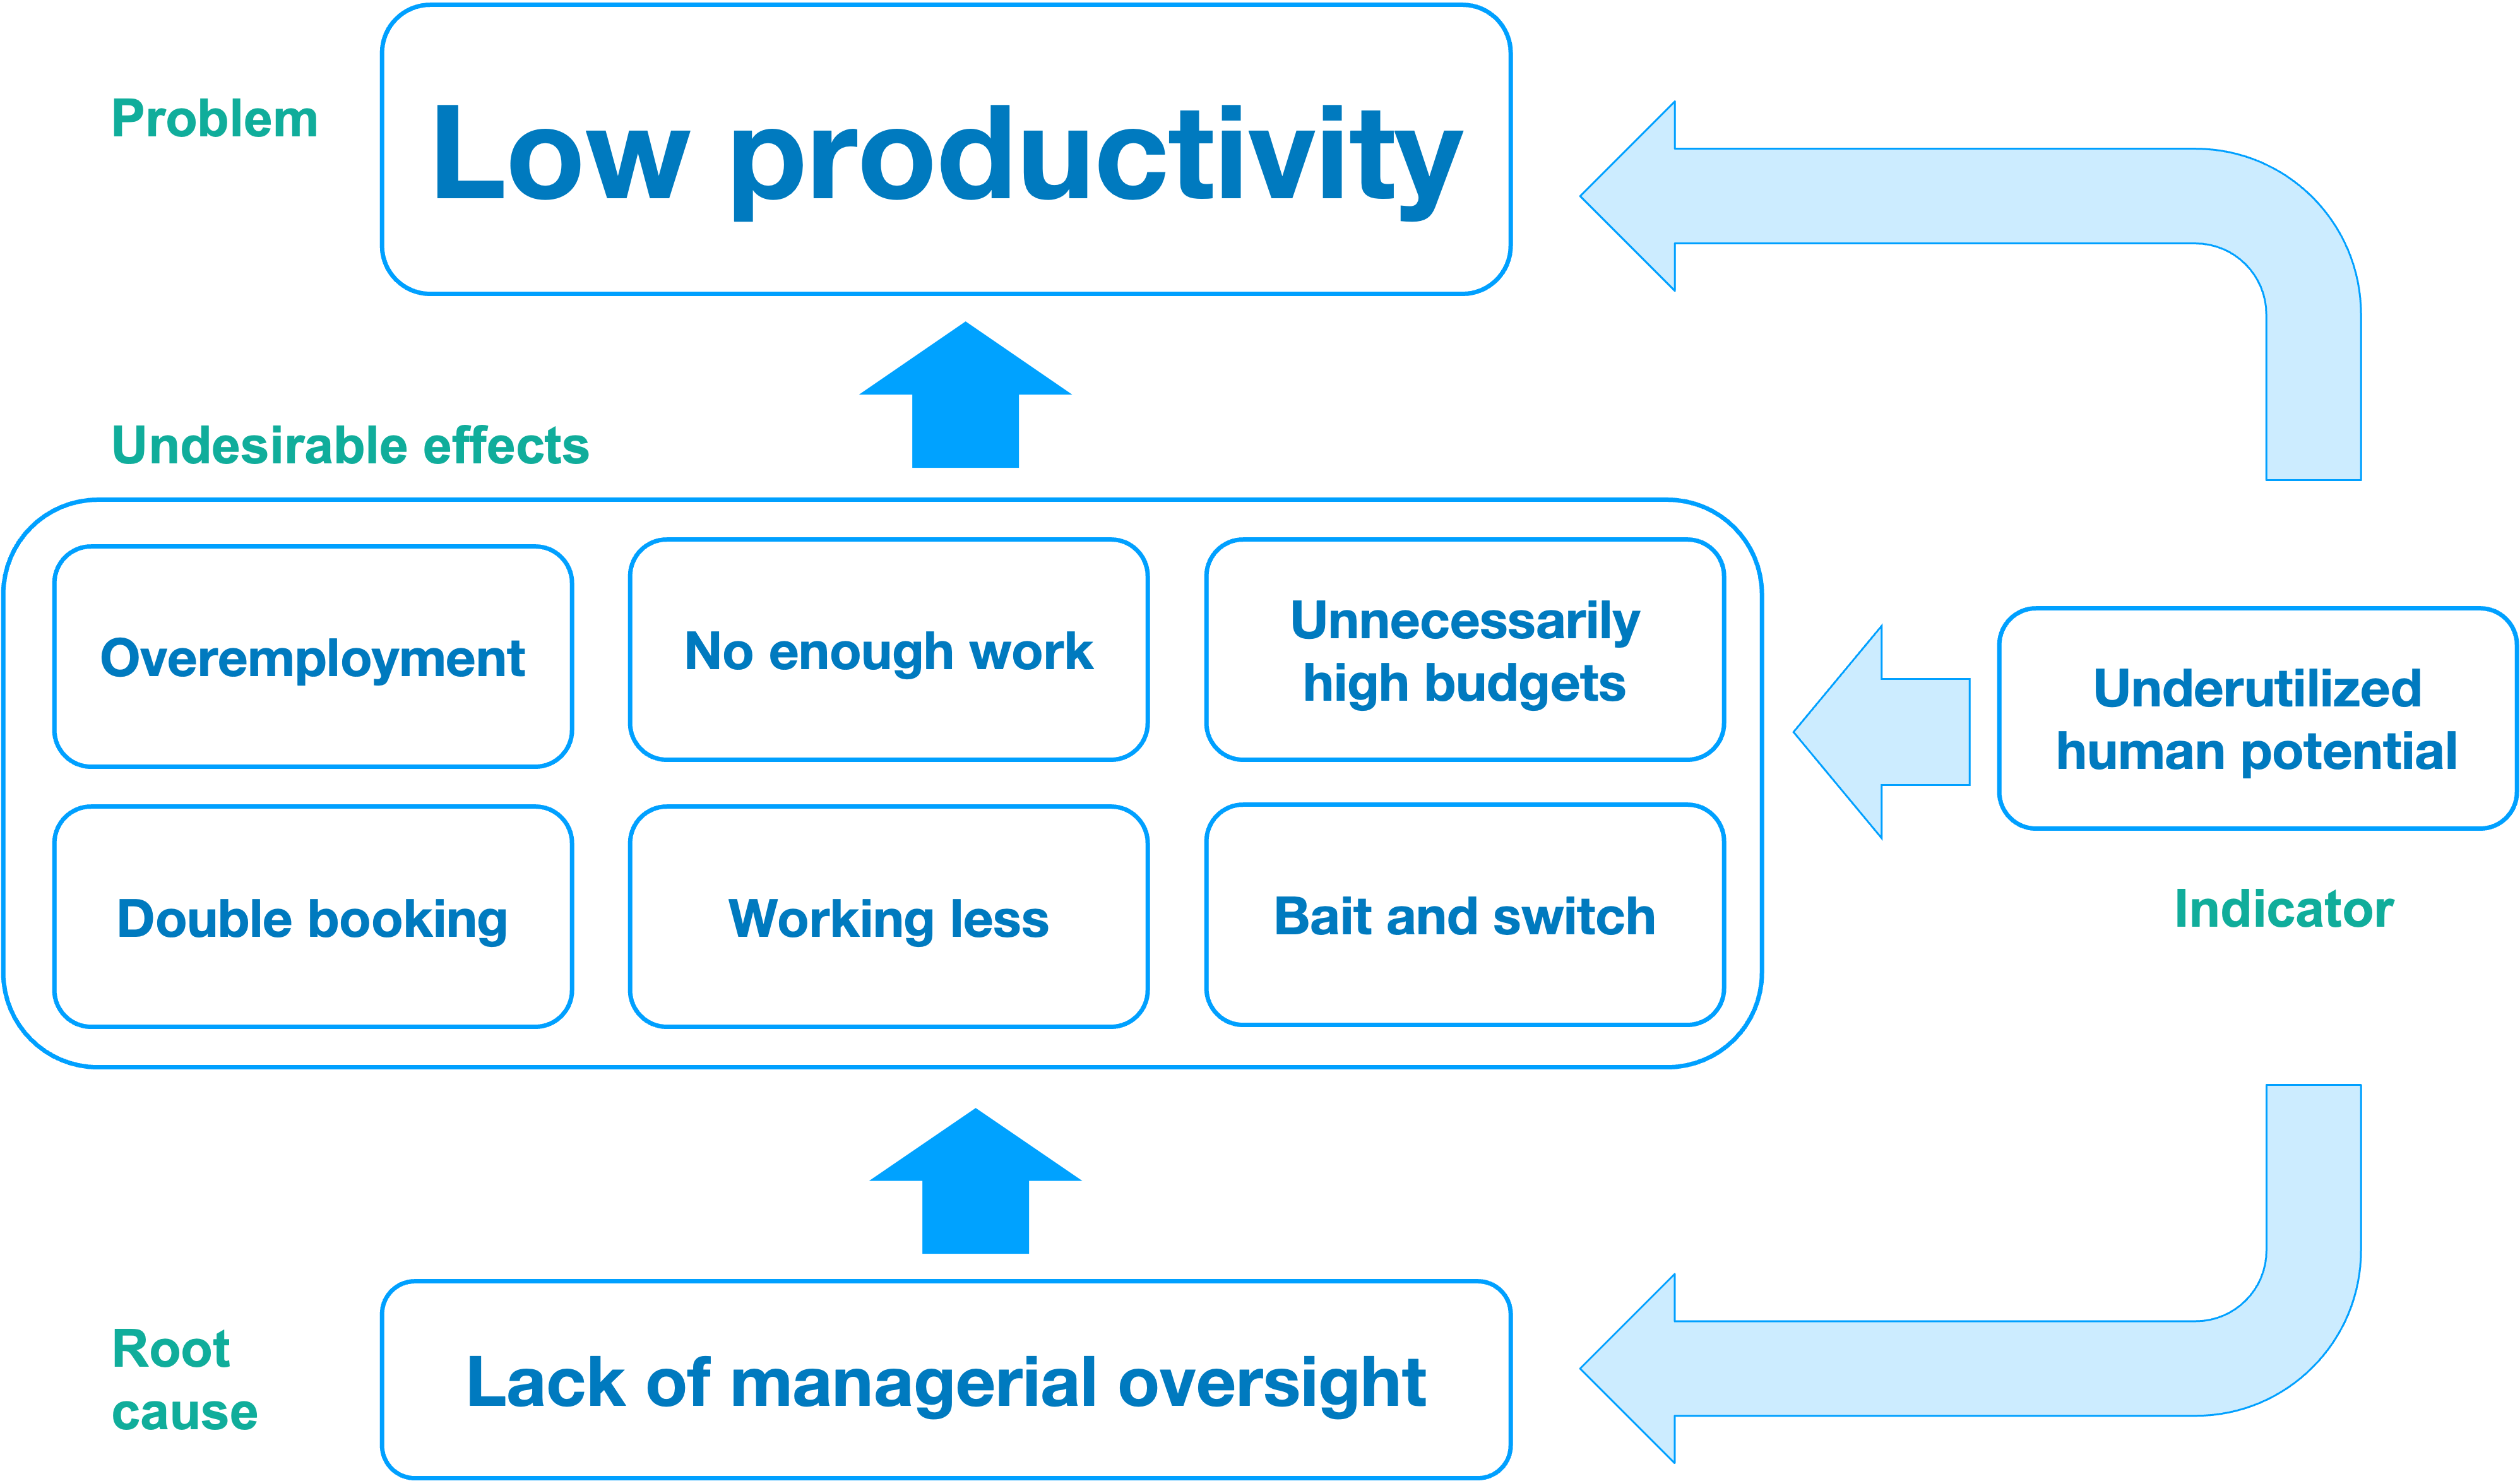
Common trait to all six undesirable effects is that they are instances of underutilized human potential. Thus, the underutilized human potential can be used as an indicator of all undesirable effects.
All six undesirable effects have a root cause - the lack of managerial oversight. Thus, we can conclude as presented in the diagram above that if there is underutilized human potential then there is:
- Lack of managerial oversight
- Low productivity
How to overcome the pitfalls
In general, to mitigate against all of the undesirable effects the client needs to decrease the information gap, the information asymmetry.
Benchmarking is an important tool to ensure performance over the course of an outsourcing deal.
While benchmarking clauses remain standard in most outsourcing contracts, few customers have been invoking their rights to compare their service provider's performance to industry averages.
Unnecessarily high budgets
Changes, new services and projects in outsourcing agreements are usually priced on either a fixed-price model or a time-and-materials model.
A fixed-price model is used when the customer's requirements are predictable, making it possible to quantify them and agree on a fixed price. The benefits of a fixed-price model are that the customer can achieve a high amount of predictability in relation to what his costs and savings will be. During the contract, payment is made in accordance with agreed milestones. This incentivises the vendor to allocate sufficient resources to ensure the agreed deadlines are met.
The pitfall of a fixed-price contract is that the vendor will add a premium for the potential risks of the project going over-time and over-budget. Unfortunately these premiums can go as high as 100% on top of the estimated time-and-material budget. If the contracted budget is higher than the actual need the vendor just doesn't have enough work for all contracted developers . In this case, the vendor may ask some of the project's developers to work for another client at the same time. That will again result in the vendor's human potential to be underutilized.
The efficiency of knowledge discovery can be understood in terms of how rapidly and effectively missing information is acquired and integrated into the team's work. This can be reflected in the time taken to incorporate missing information, the completeness or accuracy of the understanding of new information, and the impact of the new information on the team's productivity or the quality of their output.
Knowledge Discovery Efficiency (KEDE) is a metric that can be used to measure the efficiency of knowledge discovery in software development. We will refer to an organization's efficiency of knowledge discovery as its 'capability.'
KEDE values range from 0 to 100, representing the extent of a developer's knowledge application:
- A KEDE value of 0 indicates no utilization of the developer's capabilities—meaning the developer's knowledge is not being applied to the project at that time.
- A KEDE value of 100 signifies full utilization, where the developer's capabilities are fully utilized in applying knowledge to project tasks.
This metric helps in assessing how effectively the knowledge and skills of software developers are being utilized in the development process, ensuring that projects are staffed optimally and that each developer's talents are used efficiently.
Consider the time-series diagram below, which illustrates the utilization of an organization's capability over time.
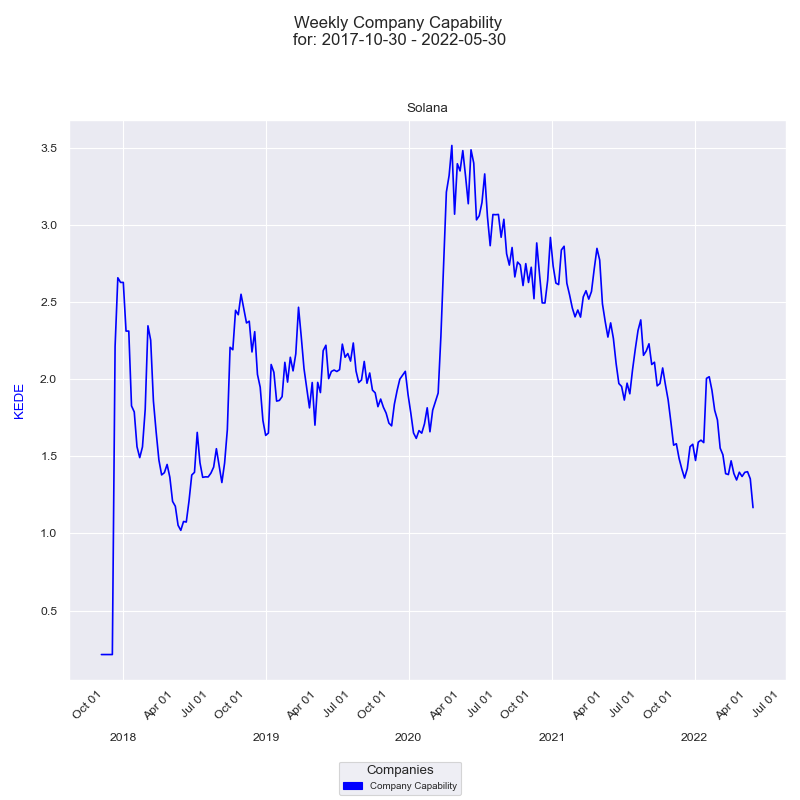
The x-axis represents the quarters, while the y-axis on the left displays the 'capability' in terms of Weekly KEDE values. The dark blue line in the diagram represents the average Weekly KEDE for all developers who contributed to the company's projects in a given week, calculated using Exponential Weighted Moving Average (EWMA). This line offers a visual representation of how the organization's capability fluctuates over time.
Time-and-materials is used when the parties know there will be a need for a particular service but cannot easily predict the volumes required. In the time-and-materials model, on the other hand, the customer is billed for the actual developers hours spent on the project. The hourly prices for the developers are agreed during the negotiation of the agreement and are set out in rate cards in the outsourcing agreement's pricing schedules. The parties may agree rates based on overall educational levels, skills and experience, or they can agree to a blended rate. This pricing model allows for great flexibility and scalability, as the customer will be able to decide where and how developers are to be allocated.
The pitfall of time-and-materials contracts is that the vendor has no incentive to increase productivity and thus bill less hours. Instead, the vendor is incentivized if possible to sell additional hours or more developers. Thus, if the managerial oversight from the client is non-existent, and everyone is forgiving for under performance that could encourage the vendor to increase hours billed in two ways. First is to claim the current resources are not sufficient and more developers are needed. Second, to ask some of its developers to work for another client at the same time. Both approaches will result in the vendor's human potential to be underutilized.
Scalability can be measured, with the efficiency of a knowledge discovery process, relative to the number of contributing software developers.
The number of contributing developers can be determined by counting those actively participating in a project over a certain period of time.
Consider the time-series diagram below, which illustrates the interplay between an organization's size and its capability over time.
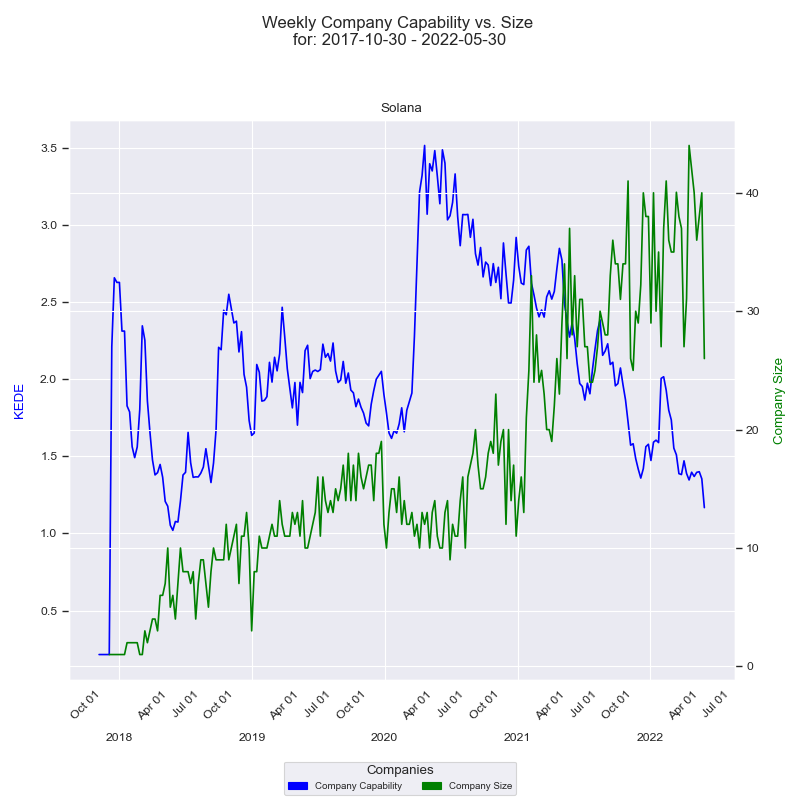
The x-axis represents the quarters, while the y-axis on the left displays the 'capability' in terms of Weekly KEDE values. The dark blue line in the diagram represents the average Weekly KEDE for all developers who contributed to the company's projects in a given week, calculated using Exponential Weighted Moving Average (EWMA). This line offers a visual representation of how the organization's capability fluctuates over time.
The right y-axis showcases the size of the company, depicted by the number of developers who contributed to the company's projects in a given week. The green line represents the company's size over time, with each point marking the count of contributing developers for that week. A detailed construction of the diagram can be found here.
The diagram displays a notable period where there is an inverse correlation between the company's size and its capability. Over the span of more than two years, the company size surged from 20 to 44, a substantial 120% increase. Conversely, during the same period, the capability steadily declined from 3.6 to 1.3, indicating a 64% decrease. The diagram illustrates a trend wherein the efficiency of knowledge discovery decreases as the number of contributing software developers increases.
Quality of people
"I'm going to let you in on a little secret: You can write absolutely anything you want on your resume." ~ Anonymous Software developer
Today, due to the promotion of IT education in many countries, the availability of novice programmers is several times that of experienced software engineers. Some of the outsourcing companies hire employees with little to no experience and charge them off as experienced developers. Many of these programmers do not have a basic foundation in software engineering. The attractive job market in the IT industry draws them from different backgrounds to join short term programming courses. Many firms hire such people due to their low cost availability. Although they may be capable and intelligent, they cannot be allowed to handle your projects immediately, as their approach to the problem may be different from qualified programmers. They may take longer to solve problems and may not follow the development process strictly. There have been many disasters in outsourcing relationships due to this factor. Many companies still continue to do this and have not learnt from their failures.
It is essential that you confirm the quality of people who would be working on your projects. You need to take a look at their resumes and earlier project work. It is also important that you have them interviewed by your technical person. It may also be useful if you talk to references where the programmers have worked directly with customers, and get their feedback.
It is important that you do not outsource your work to an amateur team. You need to find out the years of experience of the vendor's development team. Ensure that the average years of experience of the development staff works out to at least 3 years.
It is important that you find out if the vendor has enough resources to work on your project, matching the technology requirement you need resources in.
It is also important that you find out the capability of the vendor to source skill sets with short notice.
Retention Rate
Retaining good people must always be a top priority for any firm. This is especially true in the IT industry where there has been a high turnover of people because of heavy competition and better opportunities. Any good offshore development firm has to keep looking for innovative ideas to attract and retain their best people.
The higher the retention rate, the better the company environment. You could expect better productivity from a firm that retains the best talent i.e. maintains its capability. Find out the retention rate of the company and ensure that it is high.
KEDEHub provides insights into project average happiness over time, allowing organizations to monitor and identify trends in their performance. The diagram below presents a time series of Happiness levels for a selected project over a given period. On the x-axis, the diagram displays the week dates, while on the y-axis, it shows the Happiness levels.
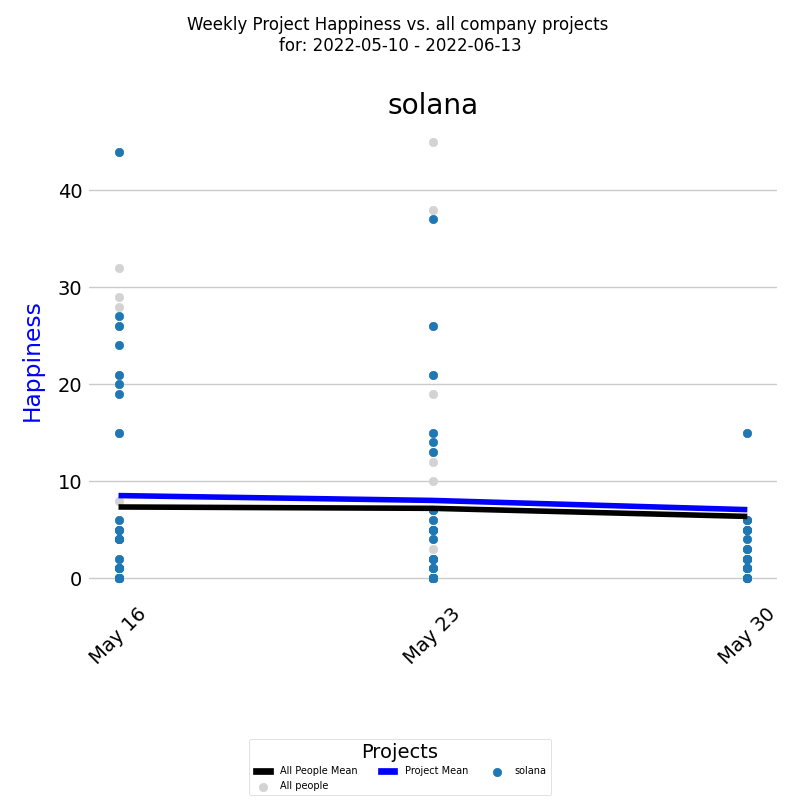
Each colored dot represents an individual developer's Happiness level, and the blue line represents the average Happiness level for all developers calculated by EWMA.
In addition, it's important to compare the project's happiness with the average happiness of the company. This is presented by the Weekly Happiness for all developers who contributed code to any of the company projects during the selected time period. Each individual developer's Weekly Happiness is presented as a light gray dot, and the black line is the average weekly Happiness for those developers calculated by EWMA.
This report can be generated for Daily Happiness as well. Additionally, the same report can be run for multiple projects, allowing organizations to compare and analyze their project Happiness level across various initiatives.
Bait and switch
Some vendors present a senior developer to the client for evaluation. After they win the job they have juniors who might be recent graduates with some technical certifications but no practical experience. They help the senior out although the senior could be doing the most difficult parts of the work. The juniors make more mistakes. That means there are more defects to be fixed.
Bait and switch is successful only if the client lacks the managerial oversight needed. The end result is underutilized human potential for the client.
The resource allocation diagram below answers the question: "How are different developers (each with their unique skills and expertise) allocated over time to a specific project over a specified time period?"
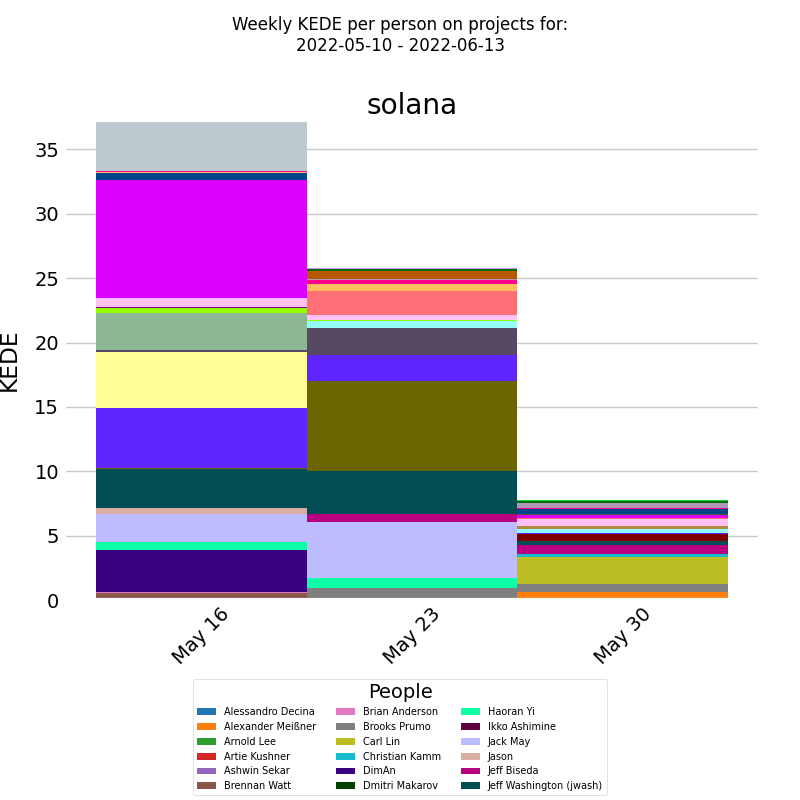
On the x-axis, we have the week dates, and on the y-axis, we have the weekly KEDE values. The chart displays a series of stacked bars, with each bar representing the capability for the selected project. Each bar is divided into segments, with each segment corresponding to the fraction of capability contributed by a specific software developer. The legend lists all the developers who contributed to the selected project, and the colors in each bar indicate which developer made each contribution.
By using this chart, it is possible to identify which developers had the greatest allocation to the project during any given week or over the entire period. This information can help organizations to optimize their development teams and assign tasks more effectively. Ensuring that the project progresses efficiently without overloading any single team member is crucial for effective project management and planning, ultimately improving project outcomes.
The developer allocation diagram below answers the questions: "How a developer's workload is distributed, which projects are consuming most of their talent, and how their skills and efforts are being utilized within the organization?"
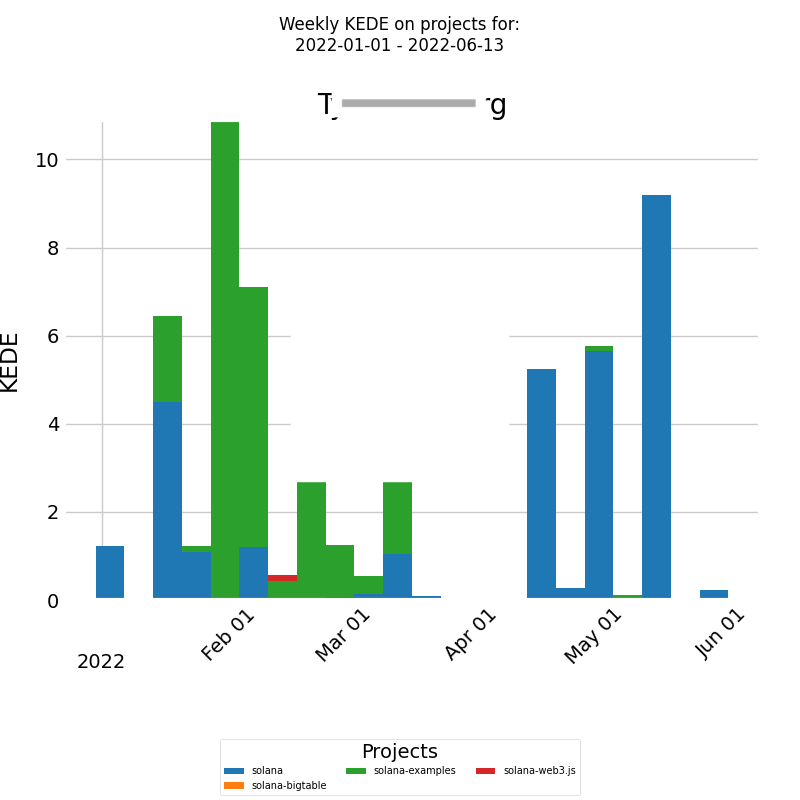
On the x-axis, we have the week dates, and on the y-axis, we have the weekly KEDE values. Each bar represents the capability of the selected developer divided into a number of segments, each corresponding to the fraction of the capability that the developer contributed to a particular project. This allows for a clear visualization of the developer's allocation across different projects.
This visualization is crucial for ensuring that the developer's skills are utilized efficiently without risking burnout. It also assists managers in making informed decisions about project assignments and workload distribution.
KEDEHub provides insights into project average waste over time, allowing organizations to monitor and identify trends in their performance. The diagram below presents a time series of waste levels for a selected project over a given period. On the x-axis, the diagram displays the week dates, while on the y-axis, it shows the waste levels.
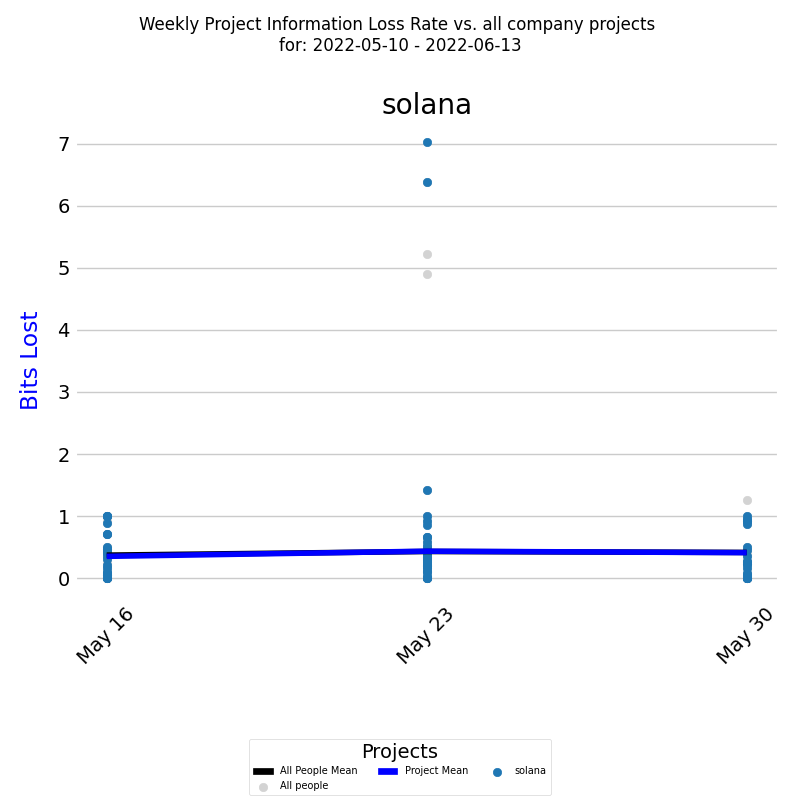
Each colored dot represents an individual developer's waste level, and the dark blue line represents the average waste level for all developers calculated by EWMA.
In addition, it's important to compare the project's waste with the average waste of the company. This is presented by the Weekly waste for all developers who contributed code to any of the company projects during the selected time period. Each individual developer's Weekly waste is presented as a light gray dot, and the black line is the average weekly waste for those developers calculated by EWMA.
This report can be generated for Daily waste as well. Additionally, the same report can be run for multiple projects, allowing organizations to compare and analyze their project waste level across various initiatives.
Land and expand
Thevendor manages to get a senior developer or a senior team into the client company. They gai trust by doing a great job on some projects. Now they are in a position to influence the decision making process at the client company. So next time a new project is planned the vendor can say we have another star team ready to work for the client. The new team happens to be staffed with junior developers as in bait and switch.
Vendor lock-in
A vendor has the incentive to make it as costly as possible to be replaced. They do that by not sharing the knowledge they acquired while working for the client. One way is to have as little documentation as possible. Then the technologies and tools used need to be novel and difficult to find developers for them. That decreases the talent pool that can replace the vendor. If the vendor is really smart they would sell to the client a tool or technology the vendor developed inhouse. That means the vendor is the only one who can and is allowed to use that software tool.
Working less than expected
“People are great at interviews, excel during the trial, then their output plummets.” ~ Anonymous Project Manager
A developer can win a job by performing a solid interview. After that their performance does not reflect what they showed during the interview. There can be several reasons for that.
One reason might be that some people frankly optimize for working 3-4 hours/day[7]. That is possible if the developer is not at the client's office but works remotely. It really stings how some local cultures and remote work ethic don't mix. The developer could do that to be able to have more leisure or to start on overemployment.
Working less than expected is successful only if the client lacks the managerial oversight needed. The end result is underutilized human potential for the client.
Overemployment
“Some people took a second job on the side… I never expected this.” ~ Anonymous Engineering Manager
Some developers do two jobs at the same time because they can pull it off, and make double the money. This is called "dual employment", "overemployment" or simply "OE"[1]. That is equally possible when people work at the office or remote and applies both for developers and managers alike. OE for the management roles are easy because managers delegate most of their work. they can work their first job on-site and the second job remotely[2].
One needs to get the first job down to 20 hours a week to allow room for a second job. The strategy is to create slack but look busy. The ways to create slack are: delegation, automation, over-communication, insistence of asynchronous communication, and setting your ego aside to meet the minimum performance requirements instead of being a rising star[3].
What happens when both of the jobs decide to schedule a recurring meeting at the same time? Yes, meetings clash, but it's easy to get meetings rescheduled if one just asks. The developer can handle two calls at the same time if they know it's a call where they're mainly going to be listening. If needed the developer can always claim "bad internet" and drop out of one to answer questions in another.
Overemployment is successful only if the client lacks the managerial oversight needed. The end result is underutilized human potential for the client.
Double booking
Double booking refers to the practice of an outsourcing vendor to sell one developer to more than one client. This is like overemployment, but organized by the vendor. Regrettably there are outsourcing vendors who actually mandate their employees to work for two or more clients at the same time. Such an approach is only successful if the client lacks the managerial oversight needed. The result is that the vendor's human potential is underutilized.
Leech
After the vendor is inside the client company they may want to recruit some of the top talent by paying them a bit better. This will ensure that the client is locked-in because part of the client's knowledge is now with the vendor.
If the vendor is extra devious they can sell the top talent back to the clent at a premium.
Not enough work for all developers
The client at some point may have not enough work for all contracted developers, especially if some of them are very specialized. Now the human potential is underutilized because of this lack of managerial oversight. Developers from the vendor might get a bit worried since if they have nothing to do there wouldn't be a reason to keep them. So they could update their supervisor at the vendor company. The advice could be to stay put because as far as they were concerned, everything is fine as his time is being billed and paid for. The vendor may ask some of its developers to work for another client at the same time. On the other hand, if the developesr don't tell the supervisor they could start on overemployment. The result is an unnecessarily high budget for the client.
Works Cited
1. Overemployed - Work Two Remote Jobs, Reach Financial Freedom
3. OE Methods
4. Jorgensen, S., & Kort, P. M. (2002). Autonomous and induced learning: An optimal control approach. International Journal of Technology Management, 23(7–8), 655–674. https://doi.org/10.1504/IJTM.2002.003032
5. DeMarco, T. (2002). Slack: Getting Past Burnout, Busywork, and the Myth of Total Efficiency (Reprint edition). Currency.
6. I currently have 10 fully remote engineering jobs.
7. Are most of us developers lying about how much work we do?
Getting started


